. 2018 Jan;8(1):49-58.
doi: 10.1158/2159-8290.CD-17-0787. Epub 2017 Nov 9.

Genetic Predictors of Response to Systemic Therapy in Esophagogastric Cancer

Affiliations

Genetic Predictors of Response to Systemic Therapy in Esophagogastric Cancer

Yelena Y Janjigian et al. Cancer Discov. 2018 Jan.

Abstract

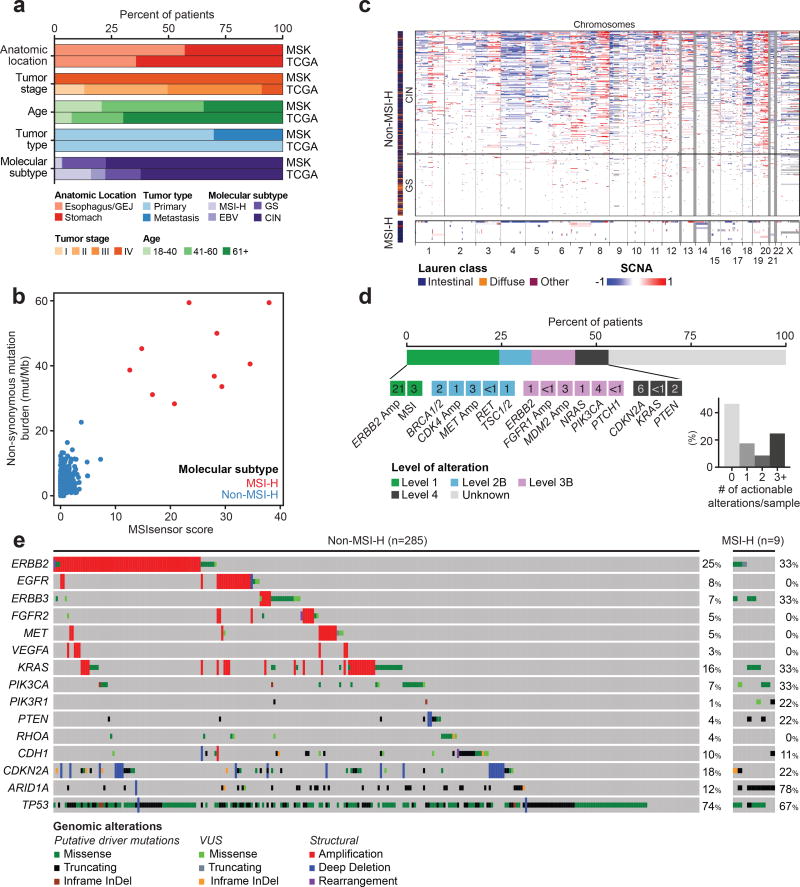
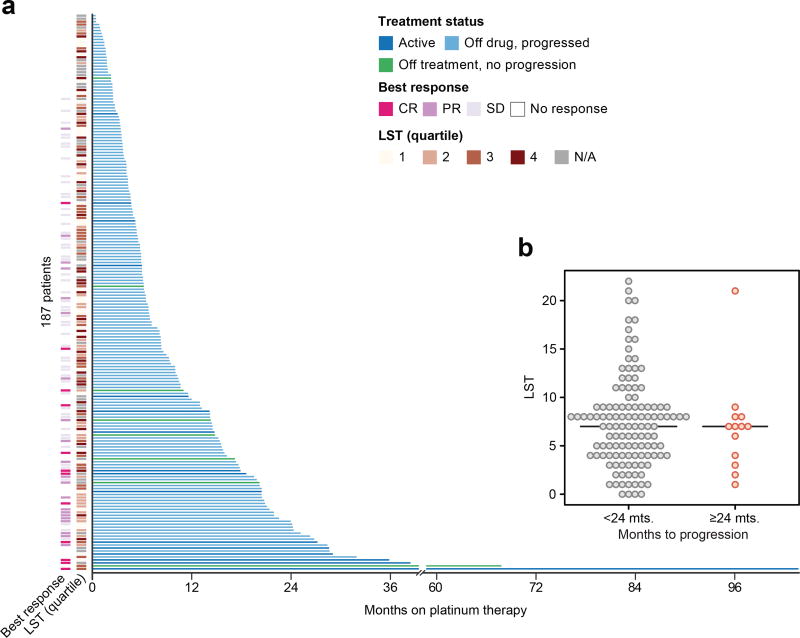
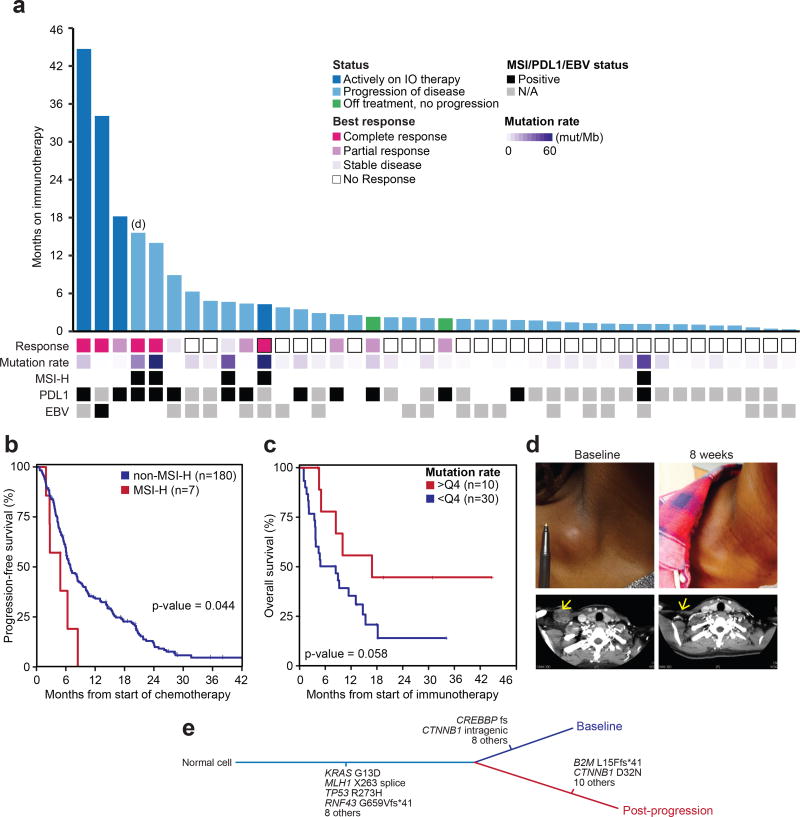
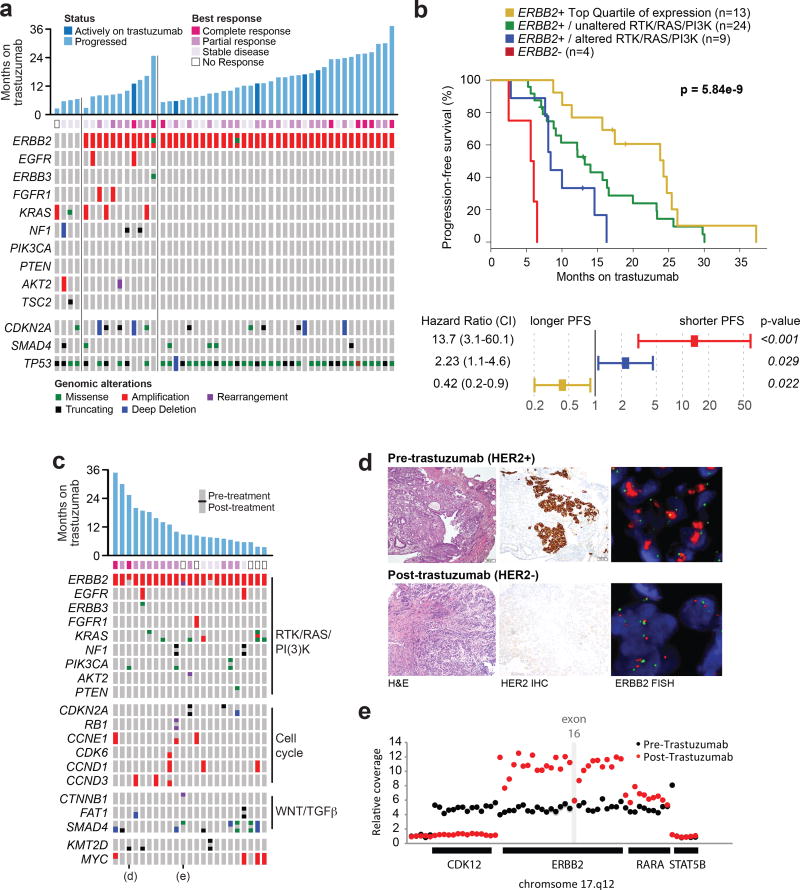
The incidence of esophagogastric cancer is rapidly rising, but only a minority of patients derive durable benefit from current therapies. Chemotherapy as well as anti-HER2 and PD-1 antibodies are standard treatments. To identify predictive biomarkers of drug sensitivity and mechanisms of resistance, we implemented prospective tumor sequencing of patients with metastatic esophagogastric cancer. There was no association between homologous recombination deficiency defects and response to platinum-based chemotherapy. Patients with microsatellite instability-high tumors were intrinsically resistant to chemotherapy but more likely to achieve durable responses to immunotherapy. The single Epstein-Barr virus-positive patient achieved a durable, complete response to immunotherapy. The level of ERBB2 amplification as determined by sequencing was predictive of trastuzumab benefit. Selection for a tumor subclone lacking ERBB2 amplification, deletion of ERBB2 exon 16, and comutations in the receptor tyrosine kinase, RAS, and PI3K pathways were associated with intrinsic and/or acquired trastuzumab resistance. Prospective genomic profiling can identify patients most likely to derive durable benefit to immunotherapy and trastuzumab and guide strategies to overcome drug resistance.Significance: Clinical application of multiplex sequencing can identify biomarkers of treatment response to contemporary systemic therapies in metastatic esophagogastric cancer. This large prospective analysis sheds light on the biological complexity and the dynamic nature of therapeutic resistance in metastatic esophagogastric cancers. Cancer Discov; 8(1); 49-58. ©2017 AACR.See related commentary by Sundar and Tan, p. 14See related article by Pectasides et al., p. 37This article is highlighted in the In This Issue feature, p. 1.


Figures

Figure 1
Figure 1. Molecular characterization of esophagogastric tumors
A, Comparison of clinical characteristics between the MSK and TCGA cohorts. B, Correlation between the MSIsensor score (x-axis) to non-synonymous mutation burden (y-axis). Samples are colored according to molecular subtype. C, DNA copy number changes categorized by molecular subtype. Chromosomes are presented from left to right, samples from top to bottom. Regions of losses appear in shades of blue while regions of gains are in shades of red. D, Highest level of clinical actionability across the cohort, as defined by OncoKB. Standard therapeutic implications include FDA–recognized or NCCN-guideline listed biomarkers that are predictive of response to an FDA-approved drug in a specific indication (Level 1). Investigational therapeutic implications include FDA-approved biomarkers predictive of response to an FDA-approved drug detected in an off-label indication (Level 2B), FDA- or non–FDA-recognized biomarkers that are predictive of response to novel targeted agents that have shown promising results in clinical trials (Level 3B), and non–FDA-recognized biomarkers that are predictive of response to novel targeted agents on the basis of compelling pre-clinical data (Level 4). E, Alterations of known drivers in esophagogastric cancer. Gene alteration types, patterns and overall frequencies are shown for non-MSI-H and MSI-H tumors separately. Tumors are shown from left top right. Mutations are color-coded by type and by presumed oncogenicity, as defined by prior knowledge and recurrence (cancerhotspots.org).
Figure 2
Figure 2. Genomic determinants of response to cytotoxic chemotherapy
A, Swimmer’s plot showing months on first-line platinum-based therapy for 185 patients with metastatic, HER2-negative esophageal cancer. The annotation tracks on the left of the y-axis indicate the patient's best response to platinum and the estimated LST score. The color of individual bars indicate the current status of the patient on this line of treatment. B, Distribution of LST scores in patients that progressed on platinum treatment before 24 months compared to patients with prolonged response (>24 months). Horizontal bars represent the median by group.
Figure 3
Figure 3. Genomic determinants of response to immune checkpoint inhibitors
A, Months on immune checkpoint inhibitors for 40 patients with metastatic, chemotherapy-refractory esophagogastric cancer. The annotation tracks below x-axis indicate EBV and MSI status, mutational burden, and best response to immunotherapy (see legend). B, Kaplan-Meier progression free survival on first-line platinum-based therapy for patients with MSI-H vs non-MSI-H tumors, demonstrating shorter PFS and chemotherapy-resistance in MSI-H esophagogastric cancers. C, Kaplan-Meier overall survival curve of patients receiving immunotherapy demonstrating favorable OS for those in the top quartile of tumor non-synonymous mutational burden (those with >9.7 mut/Mb). D, Photograph and corresponding CT image showing complete response in a biopsy-proven lymph node metastases of a patient with Stage IV MSI-H chemotherapy-refractory esophagogastric cancer treated with anti-PD-1 monotherapy in 4th line setting. E, Genomic comparison of matched pre- and post-progression primary tumor sample from patient in (D):12 mutations were private to the post-treatment sample, including a loss-of-function mutation in exon 1 of the B2M gene, which encodes β2-microglobulin.
Figure 4
Figure 4. Intrinsic and acquired trastuzumab resistance
A, Duration, best response, and pre-treatment genomic alterations for 50 patients with HER2+ metastatic esophagogastric cancer treated with first-line trastuzumab/chemotherapy. The first four tumors had no ERBB2 amplification detected by sequencing, the next set of samples had co-alterations in the RTK/RAS/PI3K pathways, and the third set had no co-occurring alterations in these pathways. B, Kaplan-Meier progression free survival curves (top panel) and multivariate analysis (bottom panel) showing favorable outcome in patients with ERBB2-amplified and RTK/RAS/PI3K-wildtype tumors. Patients with tumors that were ERBB2-negative or ERBB2-amplified and RTK/RAS/PI3K pathway-activated had significantly shorter time to progression on first-line trastuzumab therapy, and patients in the highest quartile of ERBB2 levels as determined by sequencing had the best outcome. C, Analysis of somatic alterations in 23 pairs of matched pre- and post-trastuzumab samples. The oncoprint illustrates several oncogenic alterations, grouped by pathway, that are shared between or private to the paired pre- or post-treatment samples. The cells of the oncoprint are split, with the alteration status in the pre- and post-treatment samples shown in the top and bottom, respectively. D, A representative case illustrating loss of ERBB2 amplification and HER2 protein expression in the post-treatment sample, confirmed by FISH and IHC, respectively. E, The structure of the acquired ERBB2 exon 16 deletion in a post-trastuzumab specimen. The relative DNA-sequencing coverage is shown for each exon of ERBB2 and the adjoining genes on chromosome 17, as well as select intragenic regions. The post-trastuzumab sample had a distinct, more focal, amplification that did not include exon 16 of ERBB2.

Comment in

References

    1. Siegel RL, Miller KD, Jemal A. Cancer Statistics, 2017. CA: Cancer J Clin. 2017;67:7–30. - PubMed
    1. Cancer Genome Atlas Research Network, Analysis Working Group: Asan University, BC Cancer Agency, Brigham and Women’s Hospital, Broad Institute, Brown University et al. Integrated genomic characterization of oesophageal carcinoma. Nature. 2017;541:169–75. - PMC - PubMed
    1. Cancer Genome Atlas Research Network. Comprehensive molecular characterization of gastric adenocarcinoma. Nature. 2014;513:202–9. - PMC - PubMed
    1. Cristescu R, Lee J, Nebozhyn M, Kim K-M, Ting JC, Wong SS, et al. Molecular analysis of gastric cancer identifies subtypes associated with distinct clinical outcomes. Nat Med. 2015;21:449–56. - PubMed
    1. Secrier M, Li X, de Silva N, Eldridge MD, Contino G, Bornschein J, et al. Mutational signatures in esophageal adenocarcinoma define etiologically distinct subgroups with therapeutic relevance. Nat Genet. 2016;48:1131–41. - PMC - PubMed

Publication types

MeSH terms

Substances