. 2018 Jan;38(1):120-130.
doi: 10.1161/ATVBAHA.117.309886. Epub 2017 Nov 9.

Non-Endoplasmic Reticulum-Based Calr (Calreticulin) Can Coordinate Heterocellular Calcium Signaling and Vascular Function

Affiliations

Non-Endoplasmic Reticulum-Based Calr (Calreticulin) Can Coordinate Heterocellular Calcium Signaling and Vascular Function

Lauren A Biwer et al. Arterioscler Thromb Vasc Biol. 2018 Jan.

Abstract

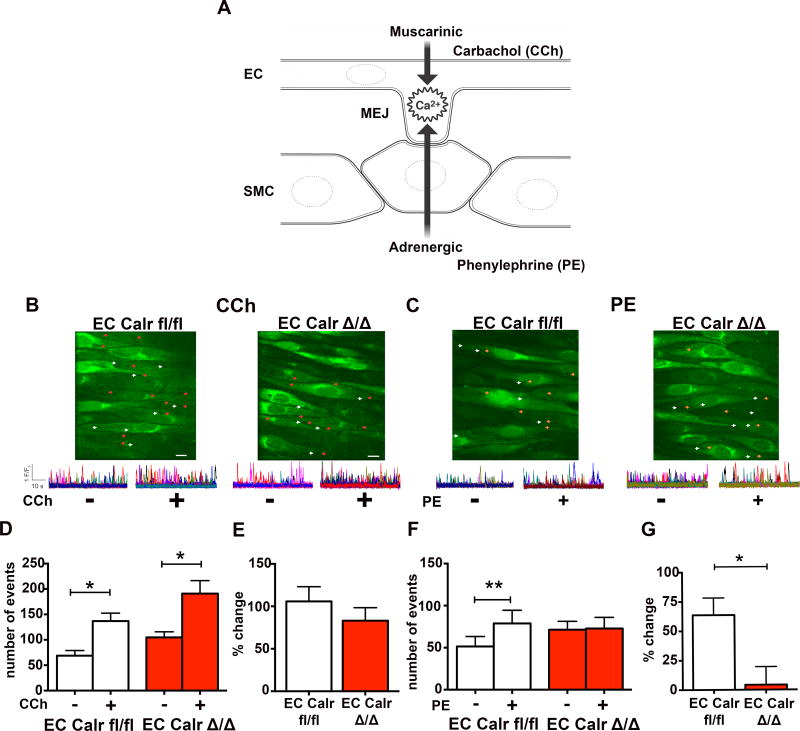
Objective: In resistance arteries, endothelial cell (EC) extensions can make contact with smooth muscle cells, forming myoendothelial junction at holes in the internal elastic lamina (HIEL). At these HIEL, calcium signaling is tightly regulated. Because Calr (calreticulin) can buffer ≈50% of endoplasmic reticulum calcium and is expressed throughout IEL holes in small arteries, the only place where myoendothelial junctions form, we investigated the effect of EC-specific Calr deletion on calcium signaling and vascular function.

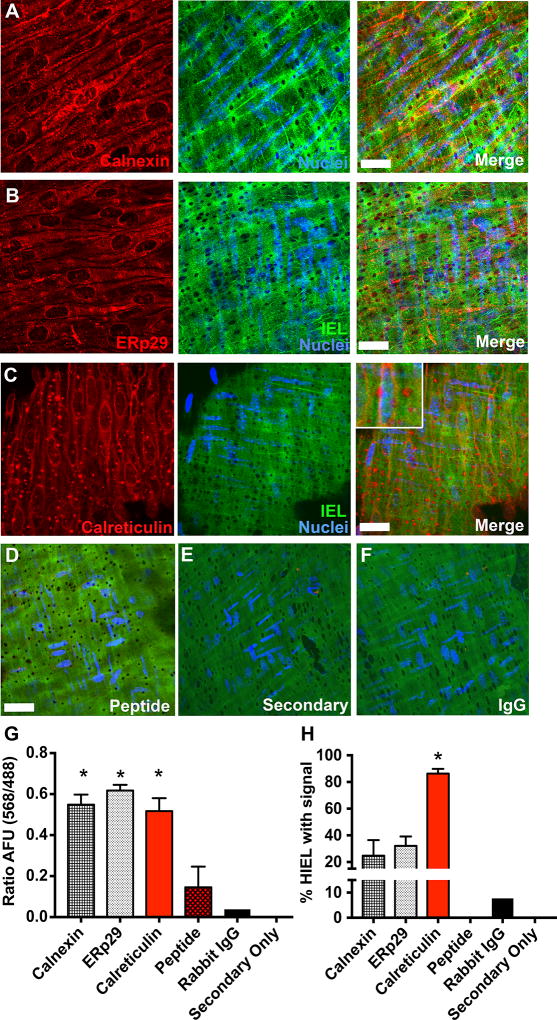
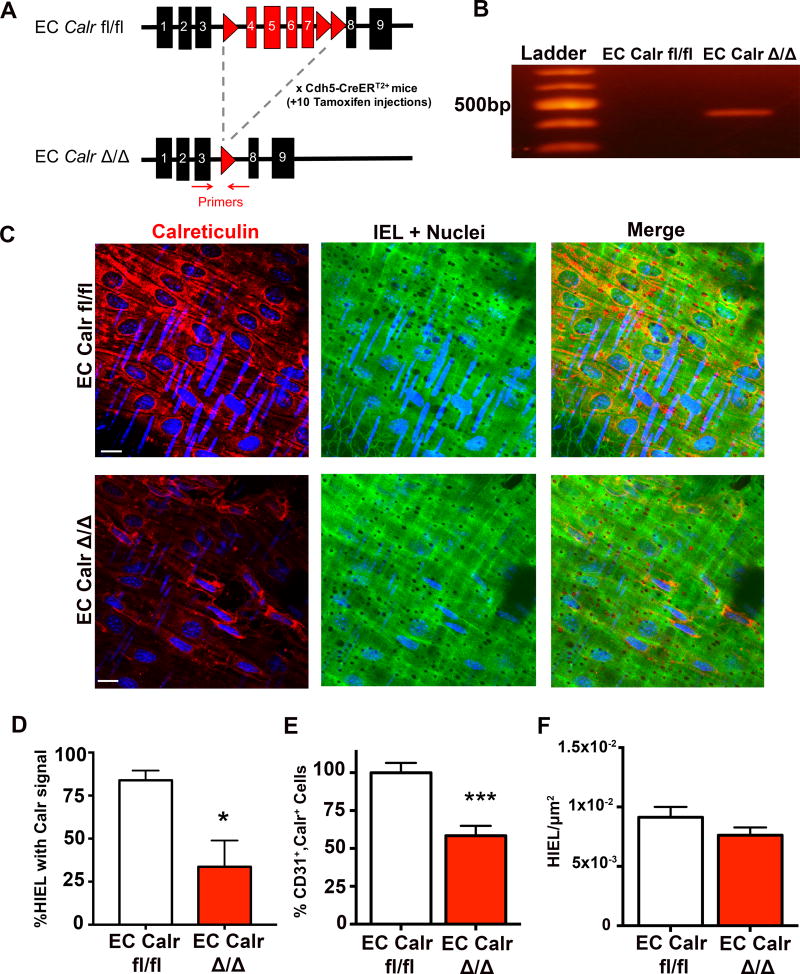
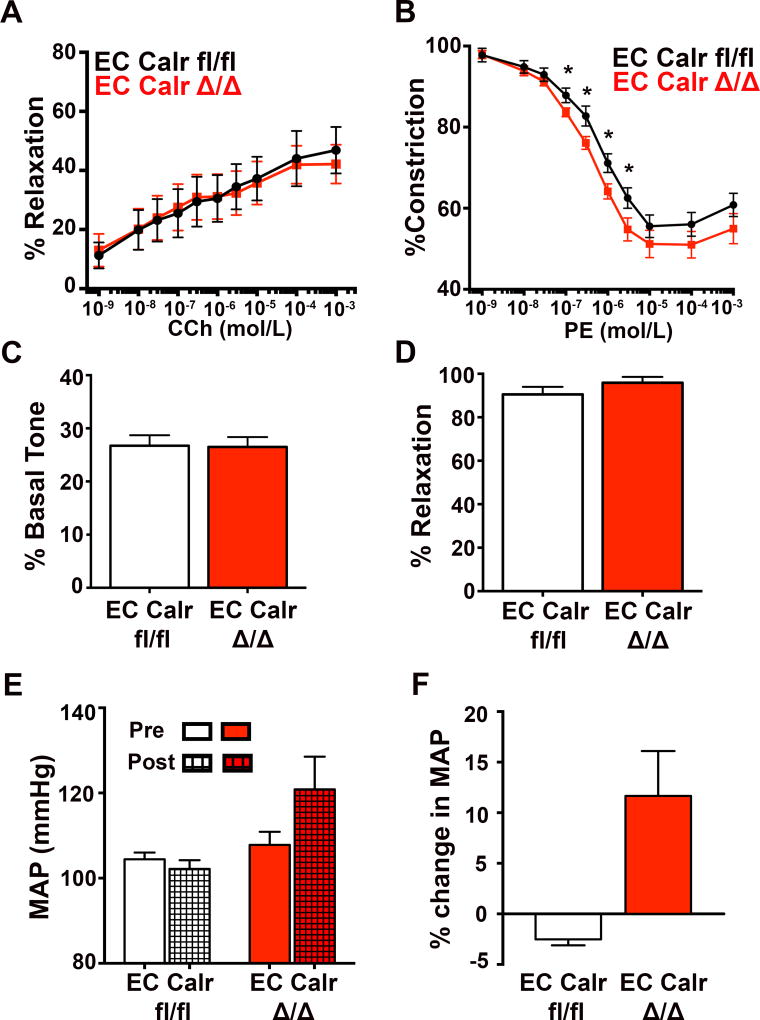
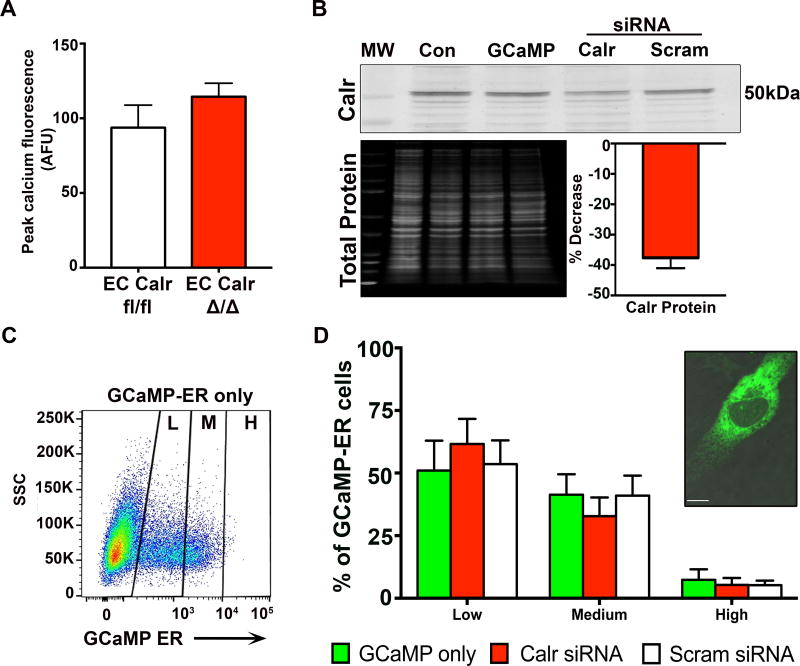
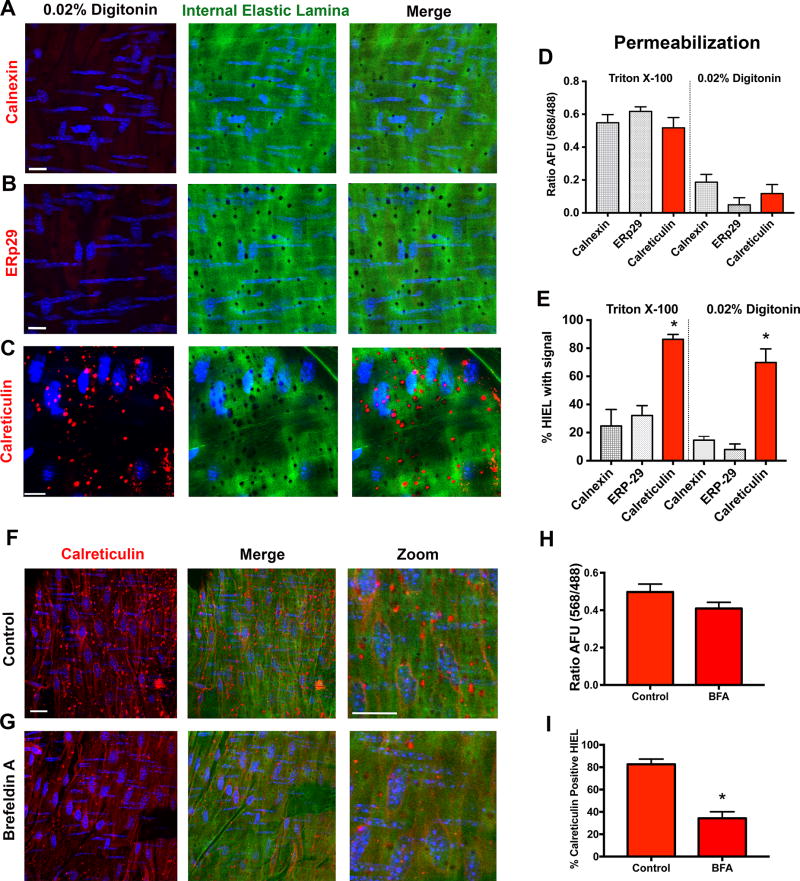
Approach and results: We found Calr expressed in nearly every IEL hole in third-order mesenteric arteries, but not other ER markers. Because of this, we generated an EC-specific, tamoxifen inducible, Calr knockout mouse (EC Calr Δ/Δ). Using this mouse, we tested third-order mesenteric arteries for changes in calcium events at HIEL and vascular reactivity after application of CCh (carbachol) or PE (phenylephrine). We found that arteries from EC Calr Δ/Δ mice stimulated with CCh had unchanged activity of calcium signals and vasodilation; however, the same arteries were unable to increase calcium events at HIEL in response to PE. This resulted in significantly increased vasoconstriction to PE, presumably because of inhibited negative feedback. In line with these observations, the EC Calr Δ/Δ had increased blood pressure. Comparison of ER calcium in arteries and use of an ER-specific GCaMP indicator in vitro revealed no observable difference in ER calcium with Calr knockout. Using selective detergent permeabilization of the artery and inhibition of Calr translocation, we found that the observed Calr at HIEL may not be within the ER.

Conclusions: Our data suggest that Calr specifically at HIEL may act in a non-ER dependent manner to regulate arteriolar heterocellular communication and blood pressure.

Keywords: blood pressure; calcium signaling; calreticulin; endoplasmic reticulum; endothelial cells; myoendothelial junction.


Conflict of interest statement

Disclosures: None of the authors declare any conflicts of interest with the work in this manuscript.

Figures

Figure 1
Figure 1. Calreticulin is enriched in the majority of holes in the artery internal elastic lamina (IEL)
Confocal Z-stack of en face immunofluorescence for established endoplasmic reticulum (ER) markers, including A calnexin (red), B ERp29 (red), or C calreticulin (Calr; red) in a third order mesenteric artery with autofluorescence of the internal elastic lamina (IEL; green) and DAPI stained nuclei from endothelial cell (EC; blue). Merge indicates overlay of the three fluorescent channels. D, Arteries were incubated with Calr peptide prior to Calr primary antibody. E, Separate experiments show a representative artery incubated with secondary antibody only or F rabbit IgG instead of primary antibody. G, Quantification of EC monolayer fluorescence (568 nm) normalized to IEL autofluorescence (488 nm) in arbitrary fluorescent units (AFU). * p<0.05 versus peptide, rabbit IgG and secondary only. H, Percentage of HIEL with positive staining. * p<0.05 versus calnexin, ERp29, peptide, rabbit IgG and secondary only. Calreticulin/Secondary only/Rabbit IgG, n=6 fields of view. ERp29/calnexin/peptide, n=3 fields of view. Scale bar=10µm. Samples were compared using a one-way ANOVA with Sidak's multiple comparison test to compare to Calr expression.
Figure 2
Figure 2. Generation of EC specific, tamoxifen inducible Calr knockout mice
A, Gene map showing loxP sites (red triangles) around exons 4–7 in the Calr gene. The Calr floxed mice were bred with EC specific promoter mice (Cdh5-CreERT2+). All EC Calr fl/fl mice were injected for 10 days with vehicle control (peanut oil, EC Calr fl/fl) or tamoxifen (EC Calr Δ/Δ). Red arrows in A indicate location of primers for B, Representative end-point PCR gel indicating excision of Calr exons only in EC Calr Δ/Δ with a product of approximately 400 kilobase pairs (kb). C, Representative images of Calr (red) en face immunofluorescence in arteries (green=autofluorescence of IEL, blue= nuclei). Scale bar=10µm. D, Percentage of HIEL with Calr signal in EC Calr fl/fl and Δ/Δ arteries (EC Calr fl/fl n=5 fields of view; EC Calr Δ/Δ n=5 fields of view). E, Diaphragm microvasculature was digested, stained for CD31 (EC marker) and Calr and analyzed via flow cytometry. (EC Calr fl/fl n=6, EC Calr Δ/Δ n=5) F, HIEL were quantified to approximate the number of myoendothelial junctions (MEJ). Images were from en face arteries using autofluorescence of the IEL (EC Calr fl/fl n=22 fields of view, EC Calr Δ/Δ n=19 fields of view). * indicates p<0.05, *** p<0.001. Groups were compared using an unpaired student's t-test.
Figure 3
Figure 3. EC Calr Δ/Δ arteries have differential, internal elastic lamina (IEL)-localized calcium responses to adrenergic versus muscarinic agonists
A, Schematic showing both muscarinic stimulation (via carbachol; CCh) and adrenergic stimulation (via phenylephrine; PE) cause increases in calcium events at the MEJ. En face preparations of third order mesenteric arteries were loaded with fluo-4AM, incubated in physiological salt solution and maintained at 37°C. B, C, Representative images show locations of baseline (white arrows) and stimulated (red or orange arrows) events occurring within holes of the IEL (HIEL). Scale bar=10µm. Representative F/F0 traces show calcium release events occurring before and after CCh or PE. Each color trace represents distinct holes in the IEL and the peaks represent the calcium events that occur within the holes of the IEL. D, Quantification of the absolute number of calcium events occurring at HIEL before and after CCh stimulation. E, Percent increase in calcum events with CCh compared to baseline. F, Quantification of absolute number of calcium events before and after PE stimulation. G, Percent increase in calcium events with PE compared to baseline. (EC Calr fl/fl n=5 arteries from 5 mice, EC Calr Δ/Δ n=5 arteries from 5 mice). *p<0.05, **p<0.01. Baseline and drug values were compared using a paired student's t-test while EC Calr fl/fl and EC Calr Δ/Δ changes were compared using an unpaired student's t-test.
Figure 4
Figure 4. EC Calr Δ/Δ arteries have differential vasoreactive responses to adrenergic versus muscarinic agonists that results in a higher mean arterial pressure
Third order mesenteric arteries were dissected clean of fat, cannulated and pressurized to 80mmHg. Arteries were maintained at 37°. A, Quantification of diameter response to CCh (EC Calr fl/fl n=3; EC Calr Δ/Δ n=3). B, Quantification of diameter response to PE (EC Calr fl/fl n=12 arteries from 8 mice; EC Calr Δ/Δ n=11 arteries from 8 mice; *p<0.06). Smooth muscle cell (SMC) function and viability was assessed via C, initial tone at 80 mmHg (EC Calr fl/fl n=12 arteries from 8 mice; EC Calr Δ/Δ n=11 arteries from 8 mice). D, NS309 (1µM) dilation indicates intact signaling at the myoendothelial junction (MEJ) along with endothelial viability (EC Calr fl/fl n=12 arteries from 8 mice; EC Calr Δ/Δ n=11 arteries from 8 mice.) E, Radiotelemetry catheters were implanted and daily averages for mean arterial pressure (MAP) were recorded over the course of 50 days. Each mouse was compared back to its initial baseline MAP. The average MAP 5 days prior to injections (left, solid bars) versus after injections (right, patterned bars). F, Percent change from baseline to the end of the study (EC Calr fl/fl n=3; EC Calr Δ/Δ n=3). *p<0.05. Comparisons were made using unpaired student's t-test at each drug dose, with the exception of F, which used Mann-Whitney test.
Figure 5
Figure 5. Calreticulin knockdown in endothelial cells does not affect the level of endoplasmic reticulum calcium
A, Third order mesenteric arteries from EC Calr fl/fl and EC Calr Δ/Δ mice were loaded with Fluo-4AM. Arteries were incubated in 0 mM extracellular calcium, along with cyclopiazonic acid (20µM) to inhibit SERCA refilling of ER calcium stores. This provides an indirect measurement of ER calcium stores (EC Calr fl/fl n=3; EC Calr Δ/Δ n=3, compared using unpaired student's t-test). B, Representative western blot of primary human aortic EC, which were transfected with GCaMP-ER plasmid to specifically detect ER calcium fluorescence. Then EC were transfected with either calreticulin siRNA or scrambled siRNA. Knockdown was assessed via western blot for calreticulin. Values were normalized to total protein for each lane.and compared to scrambled siRNA. Control EC were untransfected. MW=molecular weight ladder. C, Representative flow cytometry plot for EC transfected with GCaMP-ER to visualize ER calcium, divided into low (L), medium (M) and high (H) fluorescent signal. SSC=side scatter. D, Quantification of GCaMP-ER signal for EC co-transfected with Calr or scrambled siRNA. Inset: Representative confocal image of an EC with GCaMP-ER signal (green, visualized with GFP laser) indicating calcium within the ER. (GCaMP-ER only n=3, Calr siRNA n=3, Scram siRNA n=3, compared using one-way ANOVA. No comparisons were made between Low/Med/High expression.) Scale bar=10µm.
Figure 6
Figure 6. Calreticulin at myoendothelial junctions may be localized outside the endoplasmic reticulum
Representative en face immunofluorescence for A, calnexin B, ERp29 and C, Calr (red) with 0.02% digitonin permeabilization. This selectively permeabilizes plasma membrane and not the intracellular ER membrane. D, Quantification of EC monolayer fluorescence (568 nm) normalized to IEL autofluorescence (488 nm) in arbitrary fluorescent units (AFU). E, Percentage of holes in the IEL (HIEL) with positive staining. (Calreticulin/ERp29/calnexin n=3) Representative arteries were incubated F, without or G, with Brefeldin A (BFA; 1µg/mL), fixed with 4% paraformaldehyde, and stained for Calr (red). Scale bar=10µm. H, Quantification of EC monolayer fluorescence (568) normalized to IEL autofluorescence (488) in AFU. I, Percentage of HIEL with calreticulin signal. (Control/BFA n=4) *p<0.05. Digitonin experiments were compared using one way ANOVA with Sidak's multiple comparisons test. BFA experiments were compared using unpaired student's t-test.

Similar articles

Cited by

References

    1. Beevers G, Lip GY, O'Brien E. ABC of hypertension: The pathophysiology of hypertension. BMJ. 2001;322:912–6. - PMC - PubMed
    1. Billaud M, Lohman AW, Johnstone SR, Biwer LA, Mutchler S, Isakson BE. Regulation of cellular communication by signaling microdomains in the blood vessel wall. Pharmacol Rev. 2014;66:513–69. - PMC - PubMed
    1. Coffman TM. Under pressure: the search for the essential mechanisms of hypertension. Nat Med. 2011;17:1402–9. - PubMed
    1. Oparil S, Zaman MA, Calhoun DA. Pathogenesis of hypertension. Ann Intern Med. 2003;139:761–76. - PubMed
    1. Levy BI, Ambrosio G, Pries AR, Struijker-Boudier HA. Microcirculation in hypertension: a new target for treatment? Circulation. 2001;104:735–40. - PubMed

Publication types

MeSH terms