. 2018 Mar;32(3):1196-1206.
doi: 10.1096/fj.201700518R. Epub 2018 Jan 3.

Reducing insulin via conditional partial gene ablation in adults reverses diet-induced weight gain

Affiliations

Reducing insulin via conditional partial gene ablation in adults reverses diet-induced weight gain

Melissa M Page et al. FASEB J. 2018 Mar.

Abstract

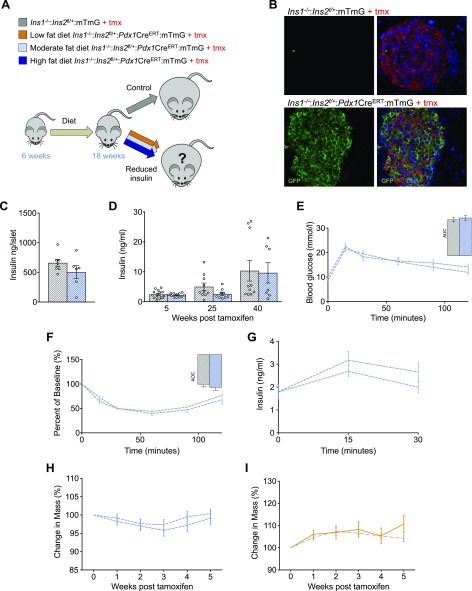
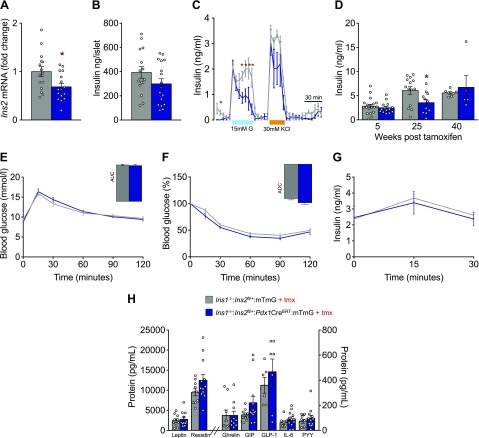
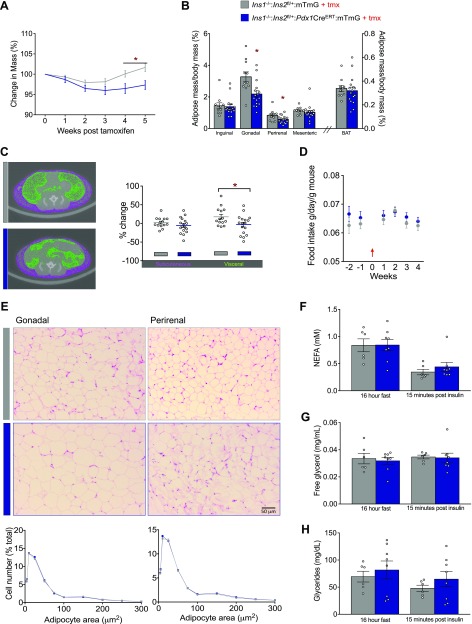
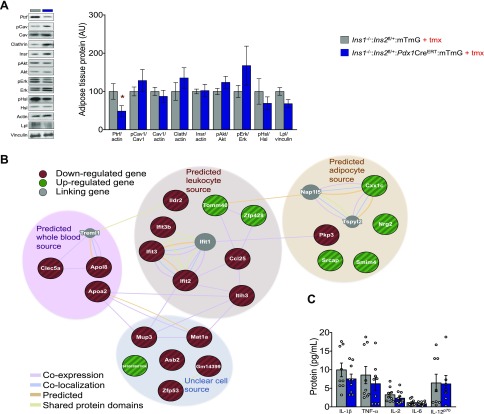
Excess circulating insulin is associated with obesity in humans and in animal models. However, the physiologic causality of hyperinsulinemia in adult obesity has rightfully been questioned because of the absence of clear evidence that weight loss can be induced by acutely reversing diet-induced hyperinsulinemia. Herein, we describe the consequences of inducible, partial insulin gene deletion in a mouse model in which animals have already been made obese by consuming a high-fat diet. A modest reduction in insulin production/secretion was sufficient to cause significant weight loss within 5 wk, with a specific effect on visceral adipose tissue. This result was associated with a reduction in the protein abundance of the lipodystrophy gene polymerase I and transcript release factor ( Ptrf; Cavin) in gonadal adipose tissue. RNAseq analysis showed that reduced insulin and weight loss also associated with a signature of reduced innate immunity. This study demonstrates that changes in circulating insulin that are too fine to adversely affect glucose homeostasis nonetheless exert control over adiposity.-Page, M. M., Skovsø, S., Cen, H., Chiu, A. P., Dionne, D. A., Hutchinson, D. F., Lim, G. E., Szabat, M., Flibotte, S., Sinha, S., Nislow, C., Rodrigues, B., Johnson, J. D. Reducing insulin via conditional partial gene ablation in adults reverses diet-induced weight gain.

Keywords: Ptrf/Cavin; adipose tissue; high-fat diet; innate immunity; obesity.


Conflict of interest statement

The authors thank Farnaz Taghizadeh and Xiaoke (Betty) Hu [both with the University of British Columbia (UBC)] for assistance with islet isolations, perifusions, and animal work; the UBC Sequencing and Bioinformatics Consortium for RNA sequencing; the UBC Centre for High-Throughput Phenogenomics for micro-CT imaging; and John Schipilow and Dr. Nancy Ford (UBC) for technical support and assistance. The Centre is supported by the Canadian Foundation for Innovation, British Columbia Knowledge Development Foundation, and the UBC Faculty of Dentistry. Financial support was provided by an operating grant from the Canadian Institutes of Health Research; Canadian Diabetes Association postdoctoral fellowship awards (to M.M.P. and M.S.); a Canadian Diabetes Association Doctoral Student Research Award (to A.P.C.); a Benzon Foundation Fellowship (to S.S.); and the Juvenile Diabetes Research Foundation and Michael Smith Foundation for Health Research Postdoctoral Fellowship Awards (to G.E.L.). The authors declare no conflicts of interest.

Figures

Figure 1.
Figure 1.
Adult reduction of Ins2 gene dose in mice consuming low- and moderate-fat diets does not reverse weight gain. A) Schematic of our hypothesis that reduced insulin would reverse weight gain and obesity in adult male mice fed a low-fat (10%, yellow), moderate-fat (25%, light blue), or high-fat (58%, dark blue) diet. B) Tamoxifen induction of Pdx1CreERT led to near complete, as evidenced by membrane GFP expression (bottom). C) Insulin content in mice (n = 7, 6; control n is listed first throughout) fed a moderate-fat diet were measured from isolated islets 40 wk after tamoxifen injections. For insulin content measurements, n represents individual mice. D) Circulating insulin at 5, 25, and 40 wk after tamoxifen injection in control littermates (n = 10–15) and experimental mice (n = 7–12) fed a moderate-fat diet. E, F) Glucose tolerance (E) and insulin sensitivity (F) in mice (n = 15, 12). Insets: area under the curve (AUC) (E) and area over the curve (AOC) (F). G) Glucose-stimulated insulin secretion (n = 15, 12). H) Percentage change in body mass of male mice fed a moderate-fat diet; control littermates (n = 20; Ins1−/−:Ins2f/+:mTmG; gray dashed line) and experimental mice (n = 20; Ins1−/−:Ins2f/+:Pdx1CreERT:mTmG; blue dashed line). I) Percentage change in body mass of male mice fed a low-fat diet; control littermates (n = 3; Ins1−/−:Ins2f/+:mTmG; gray dashed line) and experimental mice (n = 2; Ins1−/−:Ins2f/+:Pdx1CreERT:mTmG; yellow line). Unless otherwise indicated, measurements were conducted from samples collected from mice between 5 and 7 wk after tamoxifen injection. Data are means ± sem.
Figure 2.
Figure 2.
Adult reduction of Ins2 gene dose in mice fed an HFD impairs the second phase of high-glucose–stimulated insulin secretion without altering glucose tolerance and insulin sensitivity. A) Islet Ins2 transcript level in control littermates (n = 15, Ins1−/−:Ins2f/+:mTmG; gray) and experimental mice (n = 16; Ins1−/−:Ins2f/+:Pdx1CreERT:mTmG; blue) fed an HFD were measured from isolated islets of mice 5 wk after tamoxifen injections. B) Islet insulin content of mice (n = 15, 17; control n is listed first throughout) fed an HFD were measured from isolated islets of mice 5 wk after tamoxifen injections. For insulin content and transcript level measurements, n represents individual mice. C) In vitro basal, glucose- (15 mM) and KCl- (30 mM) stimulated insulin release from isolated islets (n = 3, 3). D) Fasting circulating insulin 5, 25, and 40 wk after tamoxifen injection in control littermate (n = 7–19) and experimental mice (n = 5–14). E, F) Glucose tolerance (E) and insulin sensitivity (F) in mice (n = 14, 19). Insets: area under the curve (AUC) (E) and area over the curve (AOC) (F). G) Glucose-stimulated insulin secretion in mice (n = 26, 19). H) Leptin, resistin, ghrelin, GIP, GLP-1, IL-6, PYY levels in plasma extracted from control littermates (n = 6–10) and experimental mice (n = 7–12). Unless otherwise indicated, measurements were conducted from samples collected from mice between 5 and 7 wk after tamoxifen injection. Data are means ± sem. *P < 0.05.
Figure 3.
Figure 3.
Adult reduction of Ins2 gene dose reverses obesity in mice fed an HFD, primarily because of reduced mass of gonadal and perirenal fat pads. A) Percentage change in mass of control littermate (n = 39) and experimental (n = 29) mice 5 wk after tamoxifen injection. B) Inguinal, gonadal, perirenal, and mesenteric WAT depots and BAT from mice were weighed after 16 h without food and again at 15 min after an insulin stimulation (n = 16, 11). C) Representative transsectional images obtained by micro-CT (left) and quantification (right) of percentage change in subcutaneous and visceral fat depots after tamoxifen injection (n = 14, 17). D) Daily food intake was measured for 2 wk before, and 4 wk after, tamoxifen injection (n = 14, 19; control n is listed first throughout). Arrow: the week of tamoxifen injection. E) Representative sections of gonadal (n = 7, 10) and perirenal (n = 8, 11) adipose tissue (top; hematoxylin and eosin staining) and analysis of adipocyte size distribution (bottom; perilipin staining). FH) NEFA (F), free glycerol (G), and glyceride (H) levels (n = 6, 8) were measured after food was withheld for 16 h and again 15 min after insulin stimulation. Unless otherwise indicated, measurements were conducted in samples collected from mice between 5 and 7 wk after tamoxifen injection. Data are means ± sem. *P < 0.05.
Figure 4.
Figure 4.
Network analysis of gonadal fat pad from adult mice with reduced Ins2 gene dose. A) Representative immunoblots (left) and quantification (right) of key proteins involved in lipid metabolism. B) Analysis of a protein–protein interaction network assembled from RNAseq data. Node color reflects whether mRNA is increased (green) or decreased (red); gray represents linking genes. C) IL-1β, TNF-α, Il-2, IL-6, and IL-12p70 levels in control littermate (n = 8–9) and experimental (n = 7–12) mice.

References

    1. World Health Organization . (2000) Obesity: preventing and managing the global epidemic. WHO Technical Report Series 894 - PubMed
    1. Nolan C. J., Ruderman N. B., Kahn S. E., Pedersen O., Prentki M. (2015) Insulin resistance as a physiological defense against metabolic stress: implications for the management of subsets of type 2 diabetes. Diabetes 64, 673–686 https://doi.org/10.2337/db14-0694 - DOI - PMC - PubMed
    1. Kitamura T., Kahn C. R., Accili D. (2003) Insulin receptor knockout mice. Annu. Rev. Physiol. 65, 313–332 https://doi.org/10.1146/annurev.physiol.65.092101.142540 - DOI - PubMed
    1. Gray S. L., Donald C., Jetha A., Covey S. D., Kieffer T. J. (2010) Hyperinsulinemia precedes insulin resistance in mice lacking pancreatic beta-cell leptin signaling. Endocrinology 151, 4178–4186 https://doi.org/10.1210/en.2010-0102 - DOI - PubMed
    1. Templeman N. M., Skovsø S., Page M. M., Lim G. E., Johnson J. D. (2017) A causal role for hyperinsulinemia in obesity. J. Endocrinol. 232, R173–R183 https://doi.org/10.1530/JOE-16-0449 - DOI - PubMed

Publication types

Grants and funding