. 2017 Dec 4;214(12):3627-3643.
doi: 10.1084/jem.20170545. Epub 2017 Nov 9.

MicroRNA regulation of type 2 innate lymphoid cell homeostasis and function in allergic inflammation

Affiliations

MicroRNA regulation of type 2 innate lymphoid cell homeostasis and function in allergic inflammation

Priti B Singh et al. J Exp Med. .

Abstract

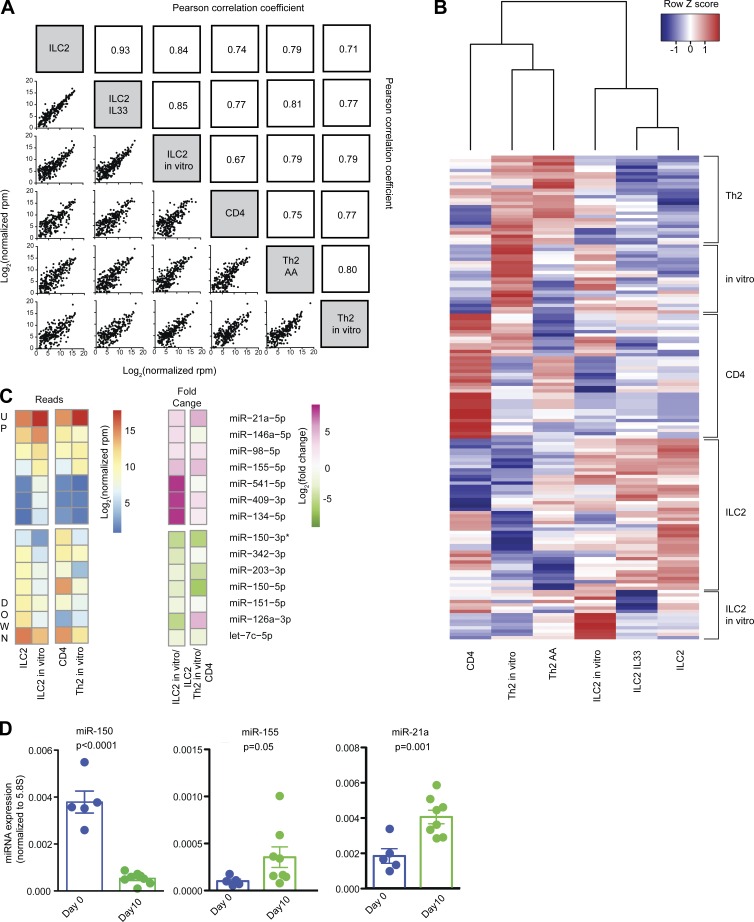
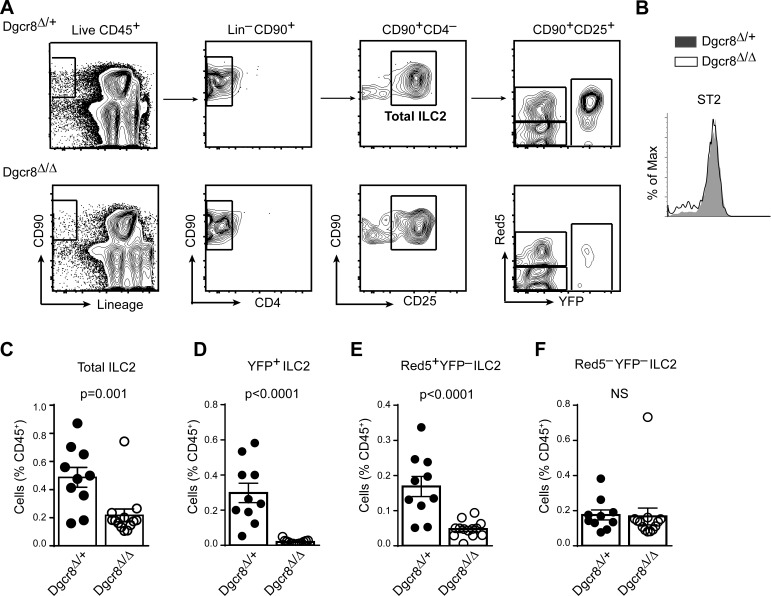
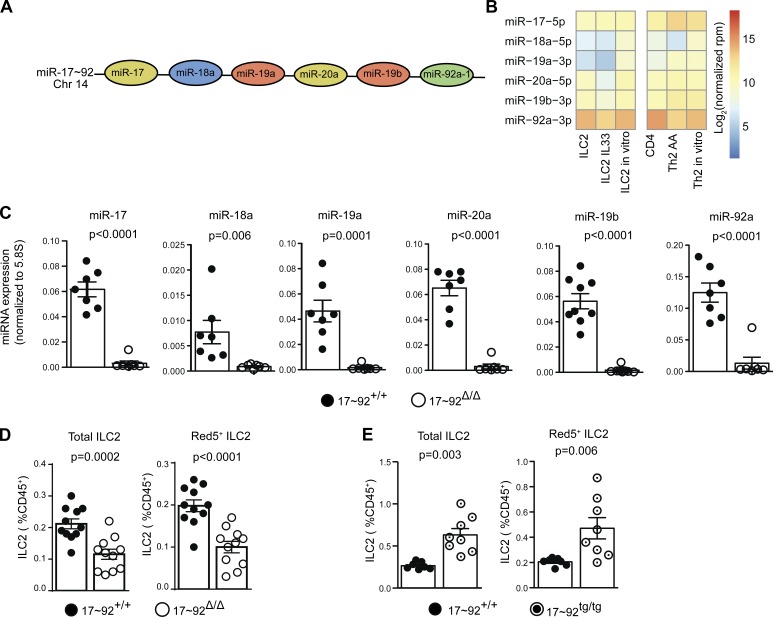
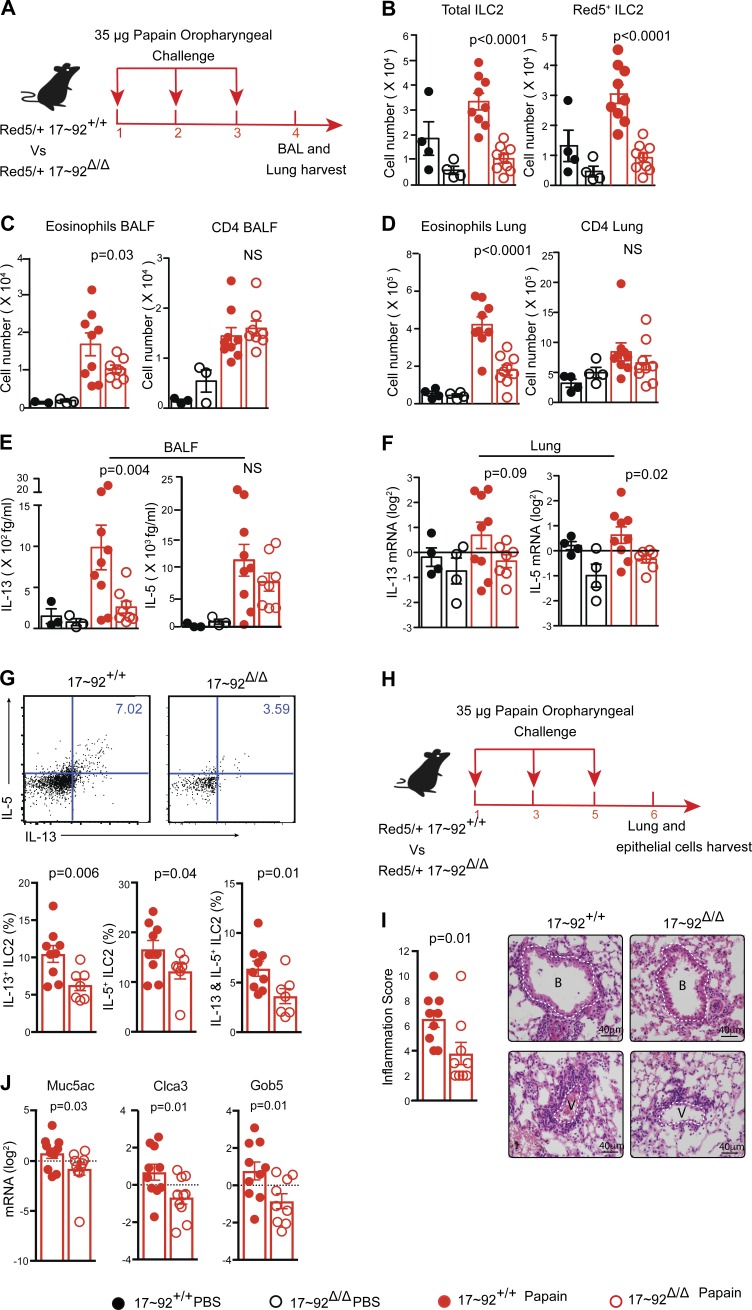
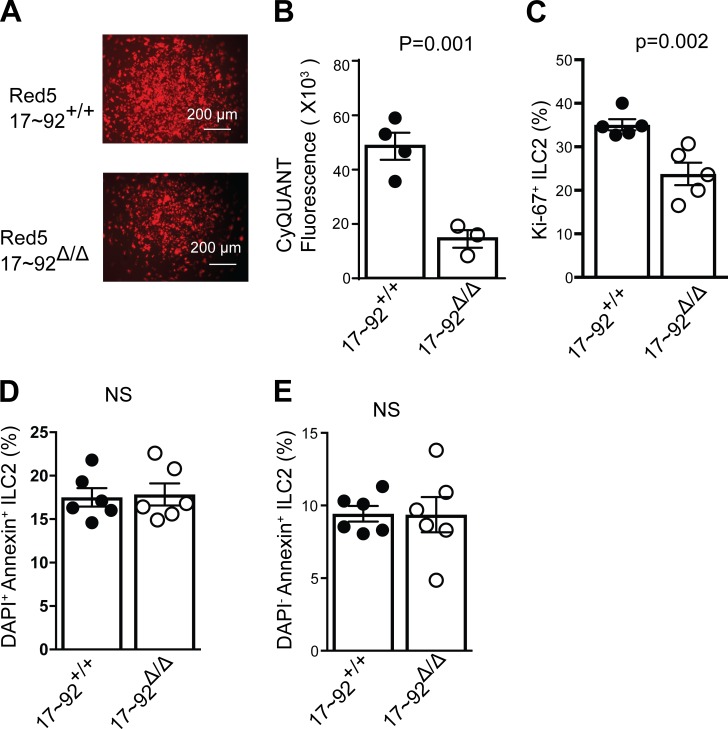
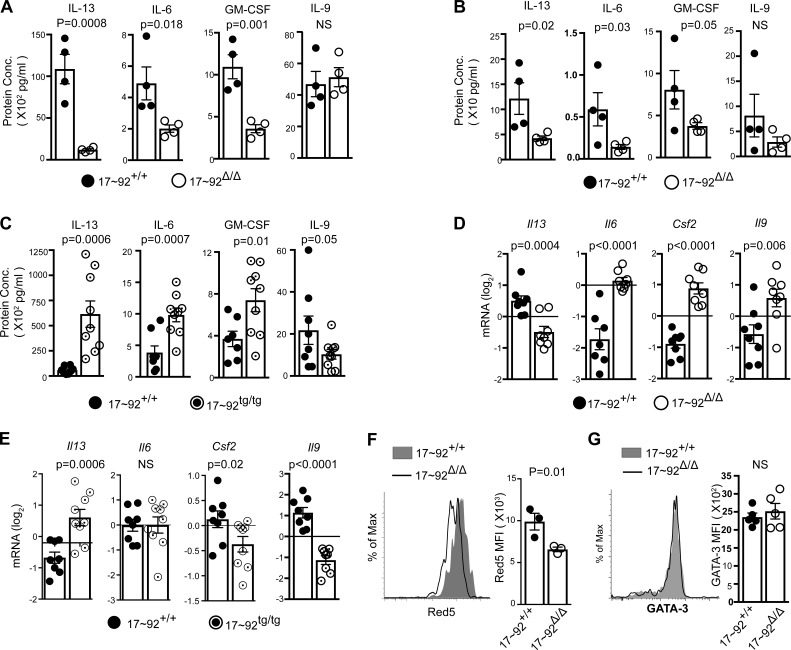
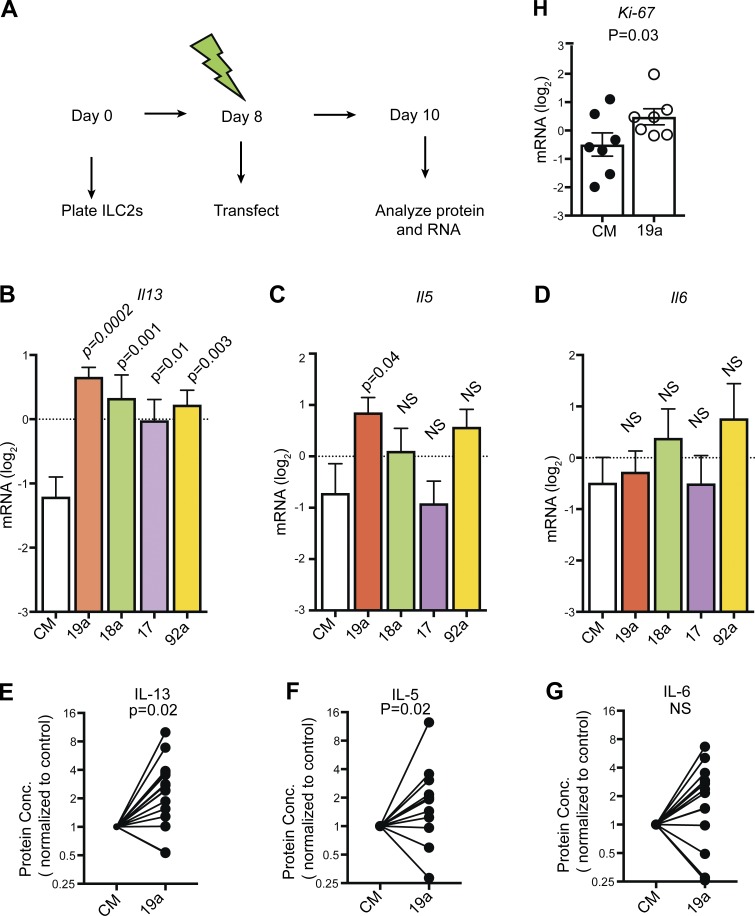
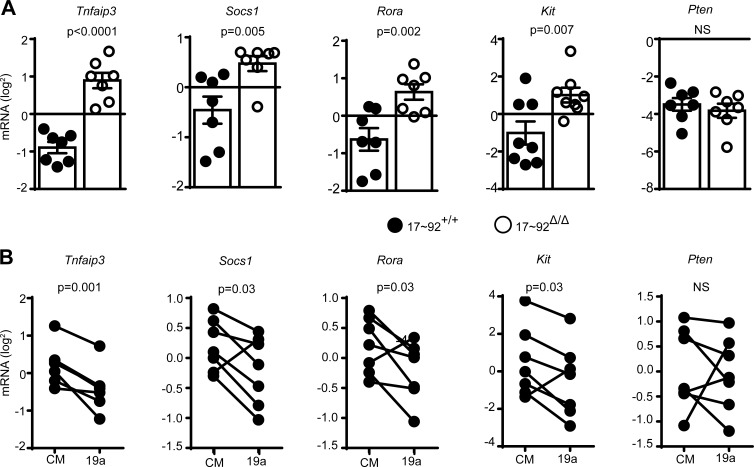
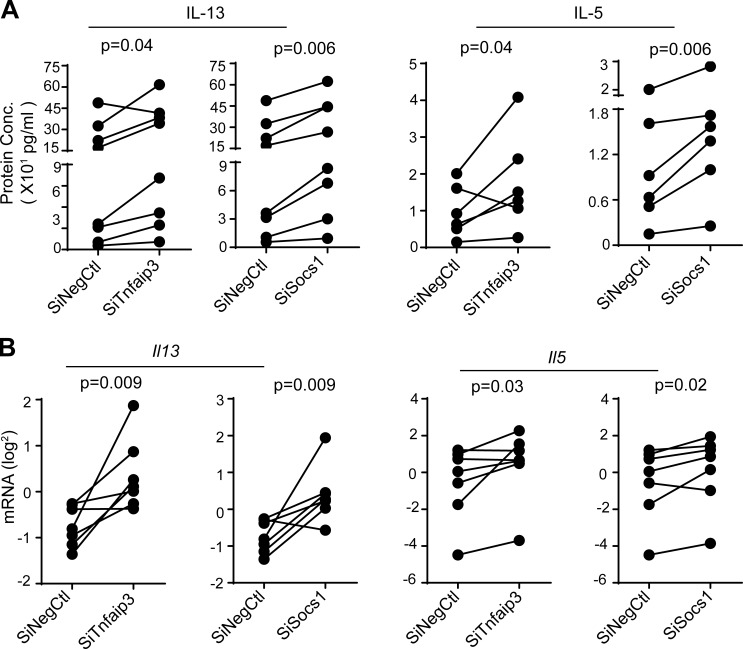
MicroRNAs (miRNAs) exert powerful effects on immunity through coordinate regulation of multiple target genes in a wide variety of cells. Type 2 innate lymphoid cells (ILC2s) are tissue sentinel mediators of allergic inflammation. We established the physiological requirements for miRNAs in ILC2 homeostasis and immune function and compared the global miRNA repertoire of resting and activated ILC2s and T helper type 2 (TH2) cells. After exposure to the natural allergen papain, mice selectively lacking the miR-17∼92 cluster in ILC2s displayed reduced lung inflammation. Moreover, miR-17∼92-deficient ILC2s exhibited defective growth and cytokine expression in response to IL-33 and thymic stromal lymphopoietin in vitro. The miR-17∼92 cluster member miR-19a promoted IL-13 and IL-5 production and inhibited expression of several targets, including SOCS1 and A20, signaling inhibitors that limit IL-13 and IL-5 production. These findings establish miRNAs as important regulators of ILC2 biology, reveal overlapping but nonidentical miRNA-regulated gene expression networks in ILC2s and TH2 cells, and reinforce the therapeutic potential of targeting miR-19 to alleviate pathogenic allergic responses.


Figures

Figure 1.
Figure 1.
Small RNA sequencing expression analysis of miRNAs in ILC2s and T cells. (A) Pearson correlation coefficients for global miRNA expression profiles among all samples. Sample groups include ILC2s isolated from naive mouse lung (ILC2), ILC2s isolated from mouse lung after IL-33 treatment (ILC2 IL33), ILC2 cultured in vitro for 10 d (ILC2 in vitro), naive CD4 T cells (CD4), TH2 cells isolated from BAL of mice with AAs (TH2 AA), and TH2 cells polarized in vitro (TH2 in vitro). (B) Unsupervised hierarchical clustering of all DESeq2 differentially expressed miRNAs. A list of individual miRNAs in each subgroup is included in Table S2. (C) Heat map of log2 normalized read counts and fold changes of miRNAs significantly (adjusted P < 0.01) up- or down-regulated in ILC2s after culture in vitro with IL-33, TSLP, and IL-7. Values for naive CD4 T cells and T cells after 5 d of TH2 polarizing culture are also provided for comparison. (D) Quantitative PCR confirmation of RNA sequencing data for the indicated miRNAs. Bars represent mean ± SEM. P-values were calculated with Student’s t test.
Figure 2.
Figure 2.
Severe reduction of lung ILC2s in Red5 Dgcr8Δ/Δ mice. (A) Contour plots depict the gating strategy for lung ILC2s in Dgcr8Δ/+ and Dgcr8Δ/Δ mice. Total ILC2s are identified as live CD45+CD90+linCD4CD25+ cells. Among total ILC2s, tdTomato (Red5) fluorescence indicates Cre expression, and YFP expressed from the R26-YFP reporter indicates Cre activity. (B) Flow cytometric analysis of ST2 median fluorescence intensity (MFI) in the total ILC2s of Dgcr8Δ/+ and Dgcr8Δ/Δ lung. (C–F) Flow cytometric quantification of total ILC2s (C), YFP+ ILC2s (D), Red5+ YFPILC2s (E), and Red5 YFPILC2s (F) in the lung of Dgcr8Δ/+ and Dgcr8Δ/Δ mice. Bar graphs show ILC2 frequency as percentage of live CD45+ cells (mean ± SEM). Each data point represents an individual mouse. Data were pooled from two independent experiments each with five to seven mice per group. P-values were calculated with Student’s t test.
Figure 3.
Figure 3.
miR-17∼92 cluster expression and requirement in lung ILC2s. (A) Schematic of the miR-17∼92 cluster miRNAs and their chromosomal positions. Colors indicate miRNAs families. (B) Heat map of log2 normalized read counts of miR-17∼92 cluster miRNAs in the indicated cell types (see Fig. 1 legend). (C) Quantitative PCR quantification of the indicated miRNAs in 10-d-cultured 17∼92Δ/Δ and 17∼92+/+ ILC2s. Symbols indicate individual cultures seeded with cells from a pool of two to three mice each. Data were pooled from three independent experiments. (D and E) Flow cytometric quantification of total lung ILC2 and Red5+ ILC2 frequency (see Fig. 2 A legend) in 17∼92Δ/Δ (D) and 17∼92tg/tg (E) mice compared with matched 17∼92+/+ controls. Each ILC2 culture was started with 10,000 (B) or 3,500 (C) ILC2s sorted from individual mouse or pools of two to six mice and cultured with IL-33, TSLP, and IL-7 for 10 d. Each data point represents the ILC2 frequency expressed as percentage of live CD45+ cells in an individual mouse. Data were pooled from two independent experiments. Bars represent mean ± SEM. P-values were calculated with Student’s t test.
Figure 4.
Figure 4.
miR-17∼92 cluster enhances ILC2 function in AA inflammation. (A) 4-d experimental model of papain-induced airway inflammation. Red5 heterozygous 17∼92Δ/Δ and 17∼92+/+ mice received 35 µg papain in 40 µl PBS or PBS alone oropharyngeally on three consecutive days, and lung tissue samples were harvested on day 4. (B) Flow cytometric enumeration of total ILC2s and Red5+ ILC2s in the lung. (C and D) Flow cytometric quantification of the number of eosinophils (Siglec-F+CD11c) and CD4+ T cells recovered in BAL (C) and digested lung tissue (D). (E) Cytometric bead array (CBA) measurement of IL-13 and IL-5 in BAL fluid. (F) Quantitative PCR (qPCR) quantification of Il13 and Il5 mRNA in total lung cells, normalized to Gapdh mRNA. (G) Representative flow cytometric analysis of intracellular cytokine staining (top). Numbers in quadrants indicate percentage of cytokine-producing live, LinCD45+CD90+CD4 ILCs. Bar graphs (bottom) show frequencies of lung ILCs expressing IL-5, IL-13, or both IL-5 and IL-13. (H) 6-d experimental model of papain-induced airway inflammation. (I) Inflammation score from hematoxylin and eosin staining of lung sections (see Materials and methods). Note the thicker and more circumferential inflammatory infiltrates cuffing a representative 17∼92+/+ versus 17∼92Δ/Δ mice bronchiole (B, top) and vessel (V, bottom). The thickness of the bronchiole or vessel wall without inflammation is highlighted by a dashed white line for reference. Bars, 40 µm. (J) qPCR quantification of IL-13–induced repair genes in epithelial brushing of papain-treated mice. Data are representative of three independent experiments each with 5–10 mice in each group (A–F). Bars represent mean ± SEM. P-values were calculated using one-way ANOVA with Sidak’s multiple comparison between papain-treated 17∼92+/+ and 17∼92Δ/Δ mice (B–F) or with Student’s t test (G–J).
Figure 5.
Figure 5.
The miR-17∼92 cluster promotes ILC2s proliferation. (A) Microscopic view of tdTomato fluorescence in Red5+ ILC2s. Bars, 200 µm. (B) CyQUANT NF cell proliferation assay fluorescent quantification of 17∼92Δ/Δ and 17∼92+/+ ILC2s after culture for 4 d. (C) Quantification of Ki67+ 17∼92Δ/Δ and 17∼92+/+ ILC2s frequencies after culture for 3 d. (D and E) Apoptosis in 17∼92Δ/Δ and 17∼92+/+ ILC2s was assessed using Annexin V and DAPI staining on day 4 of culture. Bar graphs show the percentage of dead apoptotic ILC2s (DAPI+ Annexin+; D) and live apoptotic ILC2s (DAPI Annexin; E). NS, not significant. Data in A, B, D, and E are representative of at least 20, 4, and 2 independent experiments, respectively. Bars represent mean ± SEM. P-values were calculated with Student’s t test (B–E).
Figure 6.
Figure 6.
The miR-17∼92 cluster regulates cytokines production from ILC2s. (A and B) IL-13, IL-6, GM-CSF, and IL-9 measured by cytometric bead array (CBA) in supernatants from 10- and 2-d cultured 17∼92Δ/Δ and 17∼92+/+ ILC2s, respectively. (C) IL-13, IL-6, GM-CSF, and IL-9 measured by CBA in supernatants from 10-d cultures of 17∼92+/+ and 17∼92tg/tg ILC2s. (D and E) Quantitative PCR quantification of Il13, Il6, Csf3, and Il9 in 10-d cultured ILC2s, normalized to Gapdh. (F) Red5 tdTomato median fluorescence intensity (MFI) in 4-d-cultured ILC2s, assessed by flow cytometry as an indirect measure of Il5 expression. (G) Flow cytometry analysis of GATA-3 expression in 17∼92Δ/Δ and 17∼92+/+ ILC2s at day 3 of culture, presented as MFI of GATA-3 expression in live singlet. Each culture was started with 3,500 (A–F) ILC2s, sorted from an individual mouse or pools of two to three mice, and cultured with IL-33, TSLP, and IL-7. Data in A and B are representative of at least 10 independent experiments. Data in D are pooled from three independent experiments. Data in F are representative of two independent experiments. Bars represent mean ± SEM. P-values were calculated with Student’s t test (A–G).
Figure 7.
Figure 7.
Cell-intrinsic defect in IL-13 and IL-5 production in 17∼92Δ/Δ ILC2s rescued by miR-19a. (A) 10-d experimental model of next-generation transfection of ILC2s. Each culture was started with 10,000–12,000 17∼92Δ/Δ ILC2s sorted from the pool of three to six mice and cultured with IL-33, TSLP, and IL-7. Cells were transfected on day 8 with control mimic (CM) or mimics of miR-19a, miR-18a, miR-17, and miR-92a and harvested on day 10. (B–D) Quantitative PCR (qPCR) quantification of Gapdh-normalized Il13, Il5, and Il6 mRNA from 17∼92Δ/Δ ILC2s transfected with CM or miR-19a, miR-18a, miR-17, and miR-92a mimic. (E–G) IL-13, IL-5, and IL-6 measured by cytometric bead array (CBA) in supernatants from 17∼92Δ/Δ ILC2s transfected with miR-19a or control miRNA mimic. Data are pooled from five independent experiments and are normalized to matched control mimic transfection in each biological replicate. Bars represent mean ± SEM. (H) qPCR quantification of Gapdh-normalized Ki-67 mRNA expression from 17∼92Δ/Δ ILC2s transfected with miR-19a or control miRNA mimic. Bars represent mean ± SEM. Data in B–D and H are pooled from two independent experiments. P-values were calculated with one-way ANOVA with Dunnett’s multiple comparison post hoc test (comparing each column to CM; B–D), paired Student’s t test on unnormalized data (E–G), or Student’s t test (H).
Figure 8.
Figure 8.
miR-19 regulates target gene expression in ILC2s. (A) Quantitative PCR (qPCR) quantification of the indicated candidate miR-19a target mRNAs in 10-d-cultured 17∼92+/+ and 17∼92Δ/Δ ILC2s. (B) qPCR quantification of mRNAs in 17∼92Δ/Δ ILC2s transfected with control mimic (CM) or miR-19a mimic (19a). Data are normalized to Gapdh mRNA. Each culture was started with 3,500 (A) or 10,000 (B) ILCs, sorted from pools of two to six mice. Data are pooled from three independent experiments (A and B). Bars represent mean ± SEM. P-values were calculated with Student’s t test (A) or paired Student’s t test (B).
Figure 9.
Figure 9.
miR-19 targets Tnfaip3 and Socs1 negatively regulate IL-13 and IL-5 expression in ILC2s. (A) IL-13 and IL-5 measured by cytometric bead array (CBA) in supernatants from 17∼92Δ/Δ ILC2s transfected with siRNAs targeting Tnfaip3 or Socs1 or negative control siRNA (siNegCtl). (B) Quantitative PCR quantification of Il13 and Il5 mRNA, normalized to Gapdh mRNA. Each culture was started with 10,000 ILC2s sorted from pools of five to seven mice. Data are pooled from three independent experiments. P-values were calculated with paired Student’s t test.

Similar articles

Cited by

References

    1. Bartemes K.R., Iijima K., Kobayashi T., Kephart G.M., McKenzie A.N., and Kita H.. 2012. IL-33-responsive Lineage−CD25+CD44hi lymphoid cells mediate innate type-2 immunity and allergic inflammation in the lungs. J. Immunol. 188:1503–1513. 10.4049/jimmunol.1102832 - DOI - PMC - PubMed
    1. Baumjohann D., and Ansel K.M.. 2013. MicroRNA-mediated regulation of T helper cell differentiation and plasticity. Nat. Rev. Immunol. 13:666–678. 10.1038/nri3494 - DOI - PMC - PubMed
    1. Baumjohann D., Kageyama R., Clingan J.M., Morar M.M., Patel S., de Kouchkovsky D., Bannard O., Bluestone J.A., Matloubian M., Ansel K.M., and Jeker L.T.. 2013. The microRNA cluster miR-17∼92 promotes TFH cell differentiation and represses subset-inappropriate gene expression. Nat. Immunol. 14:840–848. 10.1038/ni.2642 - DOI - PMC - PubMed
    1. Beaulieu A.M., Bezman N.A., Lee J.E., Matloubian M., Sun J.C., and Lanier L.L.. 2013. MicroRNA function in NK-cell biology. Immunol. Rev. 253:40–52. 10.1111/imr.12045 - DOI - PMC - PubMed
    1. Bronevetsky Y., Villarino A.V., Eisley C.J., Barbeau R., Barczak A.J., Heinz G.A., Kremmer E., Heissmeyer V., McManus M.T., Erle D.J., et al. . 2013. T cell activation induces proteasomal degradation of Argonaute and rapid remodeling of the microRNA repertoire. J. Exp. Med. 210:417–432. 10.1084/jem.20111717 - DOI - PMC - PubMed

MeSH terms