

Aβ inhibits SREBP-2 activation through Akt inhibition
- PMID: 29122977
- PMCID: PMC5748492
- DOI: 10.1194/jlr.M076703
Aβ inhibits SREBP-2 activation through Akt inhibition
Abstract
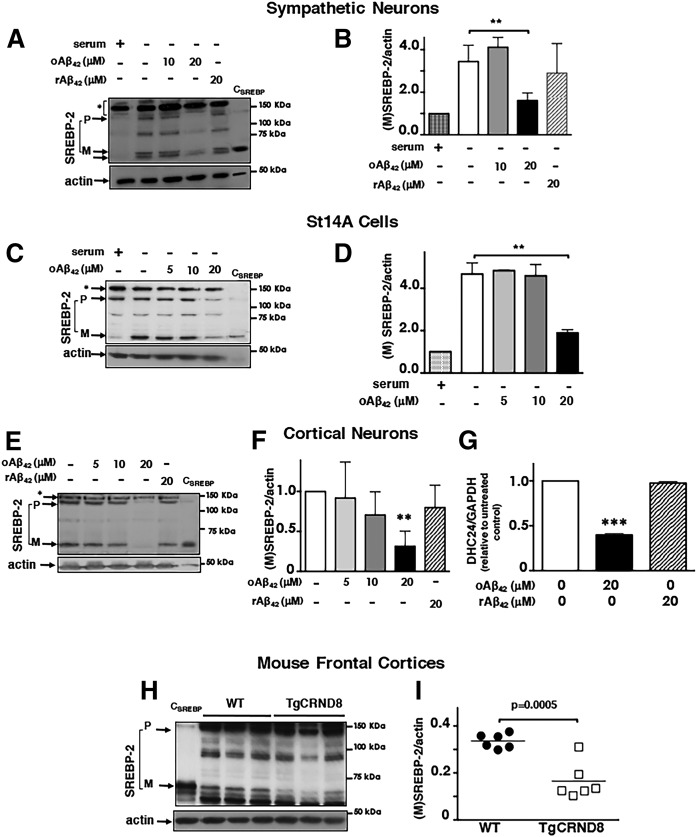
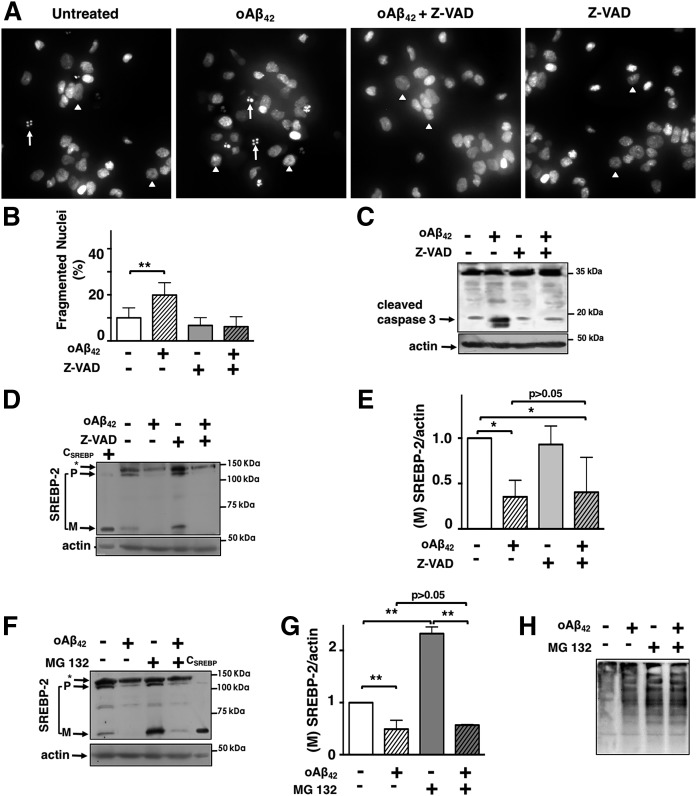
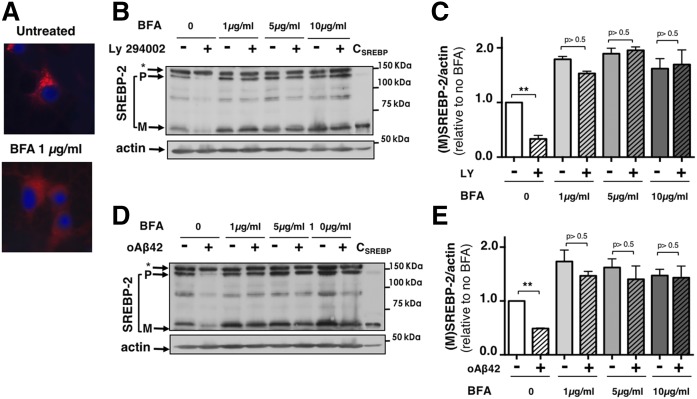
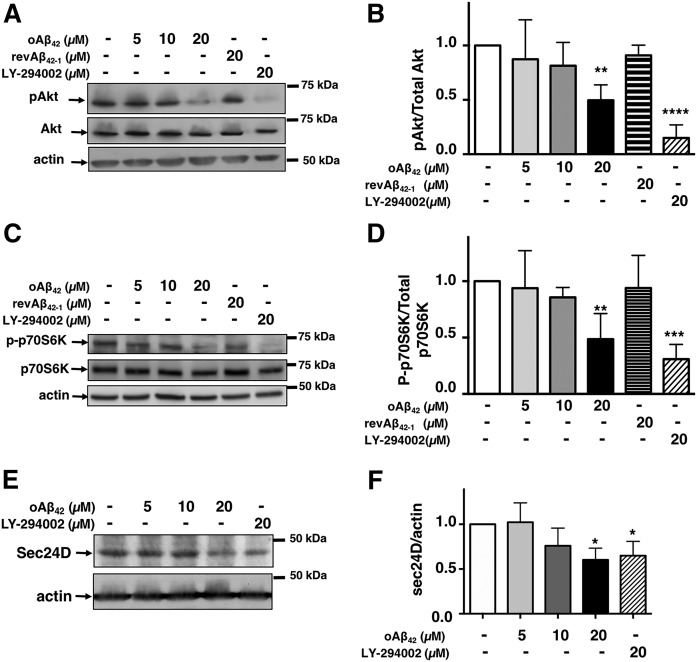
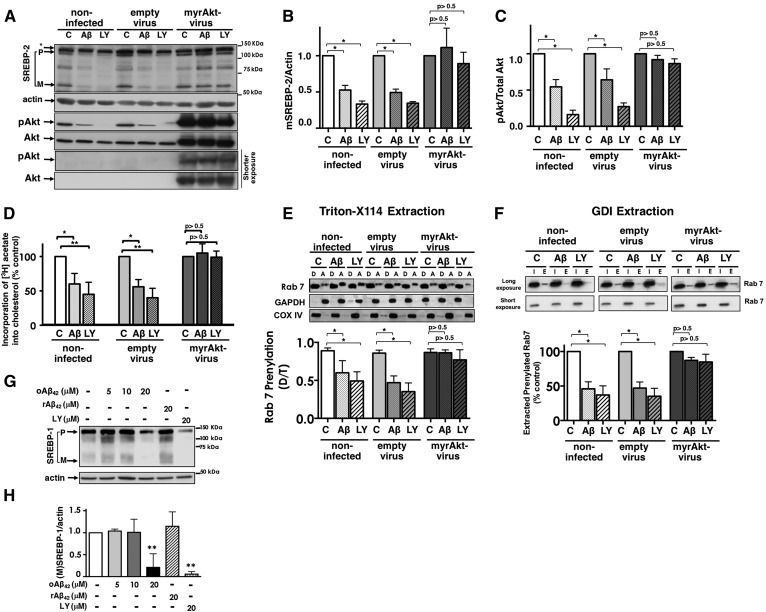
We previously demonstrated that oligomeric amyloid β42 (oAβ42) inhibits the mevalonate pathway impairing cholesterol synthesis and protein prenylation. Enzymes of the mevalonate pathway are regulated by the transcription factor SREBP-2. Here, we show that in several neuronal types challenged with oAβ42, SREBP-2 activation is reduced. Moreover, SREBP-2 activation is also decreased in the brain cortex of the Alzheimer's disease (AD) mouse model, TgCRND8, suggesting that SREBP-2 may be affected in vivo early in the disease. We demonstrate that oAβ42 does not affect enzymatic cleavage of SREBP-2 per se, but may impair SREBP-2 transport from the endoplasmic reticulum (ER) to the Golgi. Trafficking of SREBP-2 from the ER to the Golgi requires protein kinase B (Akt) activation. oAβ42 significantly reduces Akt phosphorylation and this decrease is responsible for the decline in SREBP-2 activation. Overexpression of constitutively active Akt prevents the effect of oAβ42 on SREBP-2 and the downstream inhibition of cholesterol synthesis and protein prenylation. Our work provides a novel mechanistic link between Aβ and the mevalonate pathway, which will impact the views on issues related to cholesterol, isoprenoids, and statins in AD. We also identify SREBP-2 as an indirect target of Akt in neurons, which may play a role in the cross-talk between AD and diabetes.
Keywords: Alzheimer’s disease; amyloid β; cholesterol/biosynthesis; cholesterol/trafficking; isoprenoids; neurons; nuclear receptors/sterol regulatory element-binding protein; oligomeric amyloid β42; prenylation; protein kinase B; sterol regulatory element-binding protein-2.
Copyright © 2018 by the American Society for Biochemistry and Molecular Biology, Inc.
Conflict of interest statement
The authors declare that they have no conflicts of interest.
Figures
Similar articles
-
β-amyloid inhibits protein prenylation and induces cholesterol sequestration by impairing SREBP-2 cleavage.J Neurosci. 2012 May 9;32(19):6490-500. doi: 10.1523/JNEUROSCI.0630-12.2012. J Neurosci. 2012. PMID: 22573671 Free PMC article.
-
Lovastatin Differentially Affects Neuronal Cholesterol and Amyloid-β Production in vivo and in vitro.CNS Neurosci Ther. 2015 Aug;21(8):631-41. doi: 10.1111/cns.12420. Epub 2015 Jun 20. CNS Neurosci Ther. 2015. PMID: 26096465 Free PMC article.
-
Involvement of Akt in ER-to-Golgi transport of SCAP/SREBP: a link between a key cell proliferative pathway and membrane synthesis.Mol Biol Cell. 2006 Jun;17(6):2735-45. doi: 10.1091/mbc.e05-11-1094. Epub 2006 Mar 29. Mol Biol Cell. 2006. PMID: 16571675 Free PMC article.
-
The potential role of transcription factor sterol regulatory element binding proteins (SREBPs) in Alzheimer's disease.Biomed Pharmacother. 2024 Nov;180:117575. doi: 10.1016/j.biopha.2024.117575. Epub 2024 Oct 22. Biomed Pharmacother. 2024. PMID: 39442239 Review.
-
Maintaining cholesterol homeostasis: sterol regulatory element-binding proteins.World J Gastroenterol. 2004 Nov 1;10(21):3081-7. doi: 10.3748/wjg.v10.i21.3081. World J Gastroenterol. 2004. PMID: 15457548 Free PMC article. Review.
Cited by
-
Proinflammatory transcriptomic and kinomic alterations in astrocytes derived from patients with familial Alzheimer's disease.Brain Behav Immun Health. 2025 Jun 21;47:101044. doi: 10.1016/j.bbih.2025.101044. eCollection 2025 Aug. Brain Behav Immun Health. 2025. PMID: 40656638 Free PMC article.
-
Mechanisms of 3-Hydroxyl 3-Methylglutaryl CoA Reductase in Alzheimer's Disease.Int J Mol Sci. 2023 Dec 22;25(1):170. doi: 10.3390/ijms25010170. Int J Mol Sci. 2023. PMID: 38203341 Free PMC article. Review.
-
Qki regulates myelinogenesis through Srebp2-dependent cholesterol biosynthesis.Elife. 2021 May 4;10:e60467. doi: 10.7554/eLife.60467. Elife. 2021. PMID: 33942715 Free PMC article.
-
The Role of APOE4 in Disrupting the Homeostatic Functions of Astrocytes and Microglia in Aging and Alzheimer's Disease.Front Aging Neurosci. 2019 Feb 11;11:14. doi: 10.3389/fnagi.2019.00014. eCollection 2019. Front Aging Neurosci. 2019. PMID: 30804776 Free PMC article. Review.
-
Impact of non-neuronal cells in Alzheimer's disease from a single-nucleus profiling perspective.Front Cell Neurosci. 2023 Jun 14;17:1208122. doi: 10.3389/fncel.2023.1208122. eCollection 2023. Front Cell Neurosci. 2023. PMID: 37388411 Free PMC article. Review.
References
-
- O’Brien J. S., and Sampson E. L.. 1965. Lipid composition of the normal human brain: gray matter, white matter, and myelin. J. Lipid Res. 6: 537–544. - PubMed
-
- Dietschy J. M., and Turley S. D.. 2004. Cholesterol metabolism in the central nervous system during early development and in the mature animal. J. Lipid Res. 45: 1375–1397. - PubMed
-
- Posse de Chaves E. 2012. Reciprocal regulation of cholesterol and beta amyloid at the subcellular level in Alzheimer’s disease. Can. J. Physiol. Pharmacol. 90: 753–764. - PubMed
Publication types
MeSH terms
Substances
Grants and funding
LinkOut - more resources
Full Text Sources
Other Literature Sources
Molecular Biology Databases
