

TsNAC1 Is a Key Transcription Factor in Abiotic Stress Resistance and Growth
- PMID: 29122985
- PMCID: PMC5761785
- DOI: 10.1104/pp.17.01089
TsNAC1 Is a Key Transcription Factor in Abiotic Stress Resistance and Growth
Abstract
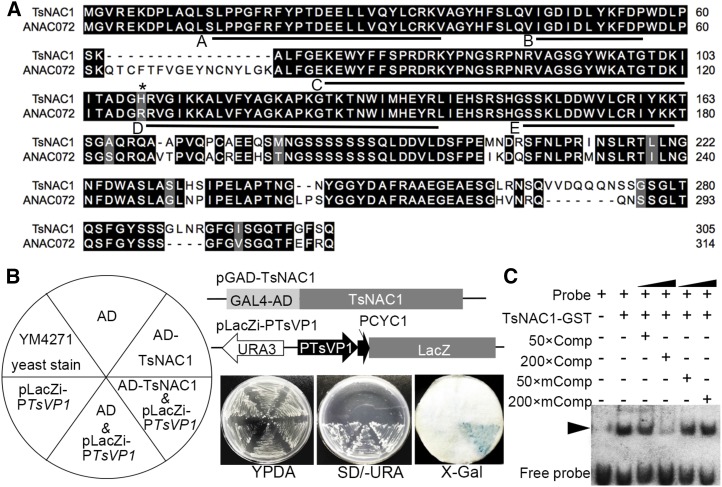
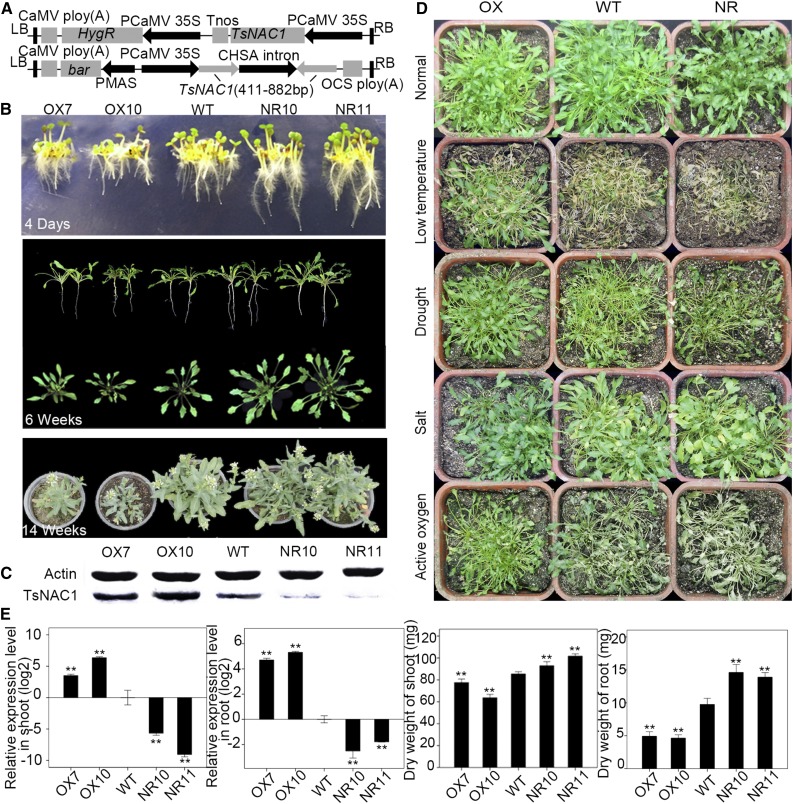
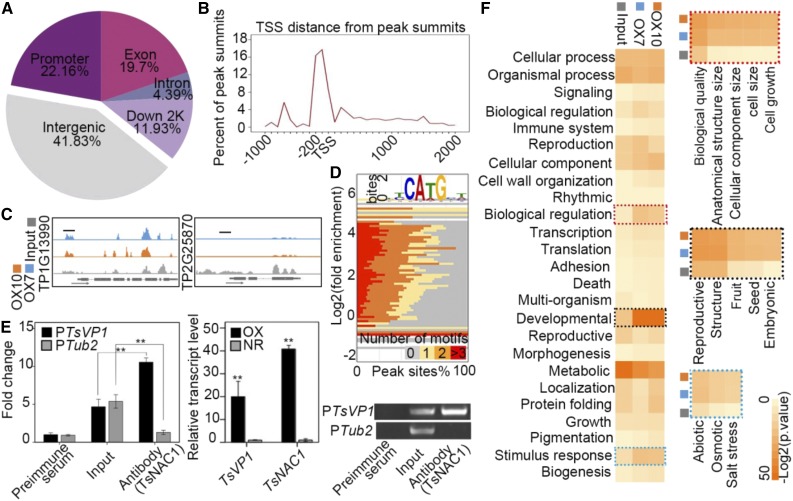
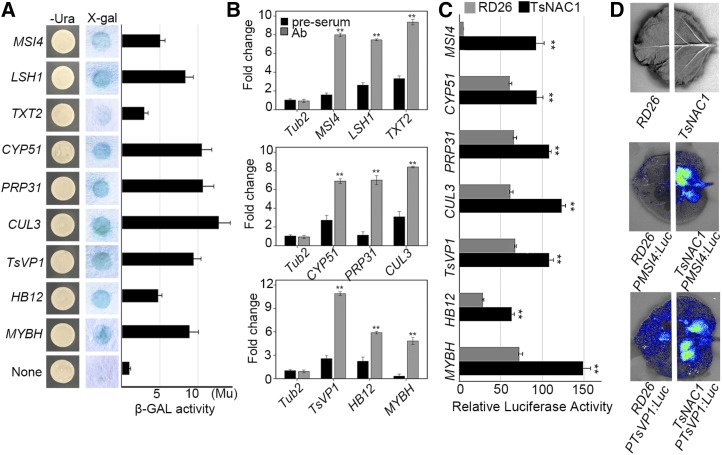
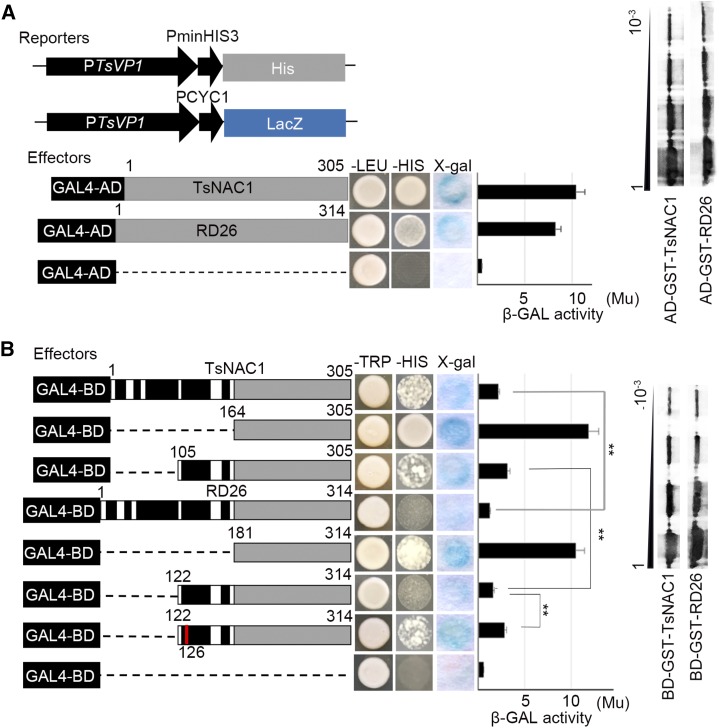
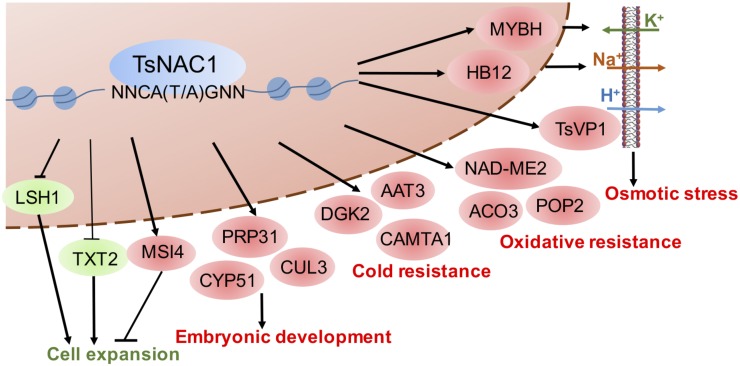
NAC proteins constitute one of the largest families of plant-specific transcription factors, and a number of these proteins participate in the regulation of plant development and responses to abiotic stress. T. HALOPHILA STRESS RELATED NAC1 (TsNAC1), cloned from the halophyte Thellungiella halophila, is a NAC transcription factor gene, and its overexpression can improve abiotic stress resistance, especially in salt stress tolerance, in both T. halophila and Arabidopsis (Arabidopsis thaliana) and retard the growth of these plants. In this study, the transcriptional activation activity of TsNAC1 and RD26 from Arabidopsis was compared with the target genes' promoter regions of TsNAC1 from T. halophila, and the results showed that the transcriptional activation activity of TsNAC1 was higher in tobacco (Nicotiana tabacum) and yeast. The target sequence of the promoter from the target genes also was identified, and TsNAC1 was shown to target the positive regulators of ion transportation, such as T. HALOPHILA H+-PPASE1, and the transcription factors MYB HYPOCOTYL ELONGATION-RELATED and HOMEOBOX12 In addition, TsNAC1 negatively regulates the expansion of cells, inhibits LIGHT-DEPENDENT SHORT HYPOCOTYLS1 and UDP-XYLOSYLTRANSFERASE2, and directly controls the expression of MULTICOPY SUPPRESSOR OF IRA14 Based on these results, we propose that TsNAC1 functions as an important upstream regulator of plant abiotic stress responses and vegetative growth.
© 2018 American Society of Plant Biologists. All Rights Reserved.
Figures
Similar articles
-
TsHD1 and TsNAC1 cooperatively play roles in plant growth and abiotic stress resistance of Thellungiella halophile.Plant J. 2019 Jul;99(1):81-97. doi: 10.1111/tpj.14310. Epub 2019 Apr 14. Plant J. 2019. PMID: 30851211
-
Drought Tolerance Conferred in Soybean (Glycine max. L) by GmMYB84, a Novel R2R3-MYB Transcription Factor.Plant Cell Physiol. 2017 Oct 1;58(10):1764-1776. doi: 10.1093/pcp/pcx111. Plant Cell Physiol. 2017. PMID: 29016915
-
Molecular characterization of ThIPK2, an inositol polyphosphate kinase gene homolog from Thellungiella halophila, and its heterologous expression to improve abiotic stress tolerance in Brassica napus.Physiol Plant. 2009 Aug;136(4):407-25. doi: 10.1111/j.1399-3054.2009.01235.x. Epub 2009 May 19. Physiol Plant. 2009. PMID: 19470090
-
Learning from evolution: Thellungiella generates new knowledge on essential and critical components of abiotic stress tolerance in plants.Mol Plant. 2009 Jan;2(1):3-12. doi: 10.1093/mp/ssn094. Mol Plant. 2009. PMID: 19529830 Free PMC article. Review.
-
Function of MYB domain transcription factors in abiotic stress and epigenetic control of stress response in plant genome.Plant Signal Behav. 2016;11(1):e1117723. doi: 10.1080/15592324.2015.1117723. Plant Signal Behav. 2016. PMID: 26636625 Free PMC article. Review.
Cited by
-
Global analysis of switchgrass (Panicum virgatum L.) transcriptomes in response to interactive effects of drought and heat stresses.BMC Plant Biol. 2022 Mar 8;22(1):107. doi: 10.1186/s12870-022-03477-0. BMC Plant Biol. 2022. PMID: 35260072 Free PMC article.
-
HaNAC146 from sunflower overexpression enhances plant growth and stress tolerance.Plant Cell Rep. 2025 Feb 19;44(3):59. doi: 10.1007/s00299-024-03391-9. Plant Cell Rep. 2025. PMID: 39969670
-
AlNAC4 Transcription Factor From Halophyte Aeluropus lagopoides Mitigates Oxidative Stress by Maintaining ROS Homeostasis in Transgenic Tobacco.Front Plant Sci. 2018 Oct 29;9:1522. doi: 10.3389/fpls.2018.01522. eCollection 2018. Front Plant Sci. 2018. PMID: 30420862 Free PMC article.
-
Transcription Factors Interact with ABA through Gene Expression and Signaling Pathways to Mitigate Drought and Salinity Stress.Biomolecules. 2021 Aug 5;11(8):1159. doi: 10.3390/biom11081159. Biomolecules. 2021. PMID: 34439825 Free PMC article. Review.
-
The unique sweet potato NAC transcription factor IbNAC3 modulates combined salt and drought stresses.Plant Physiol. 2023 Jan 2;191(1):747-771. doi: 10.1093/plphys/kiac508. Plant Physiol. 2023. PMID: 36315103 Free PMC article.
References
-
- Ausín I, Alonso-Blanco C, Jarillo JA, Ruiz-García L, Martínez-Zapater JM (2004) Regulation of flowering time by FVE, a retinoblastoma-associated protein. Nat Genet 36: 162–166 - PubMed
-
- Bao AK, Wang SM, Wu GQ, Xi JJ, Zhang JL, Wang CM (2009) Overexpression of the Arabidopsis H+-PPase enhanced resistance to salt and drought stress in transgenic alfalfa (Medicago sativa L.). Plant Sci 176: 232–240
Publication types
MeSH terms
Substances
LinkOut - more resources
Full Text Sources
Other Literature Sources
Molecular Biology Databases
Research Materials
