. 2018 Feb;103(2):313-324.
doi: 10.3324/haematol.2017.178699. Epub 2017 Nov 9.

Expression of COBLL1 encoding novel ROR1 binding partner is robust predictor of survival in chronic lymphocytic leukemia

Affiliations

Expression of COBLL1 encoding novel ROR1 binding partner is robust predictor of survival in chronic lymphocytic leukemia

Hana Plešingerová et al. Haematologica. 2018 Feb.

Abstract

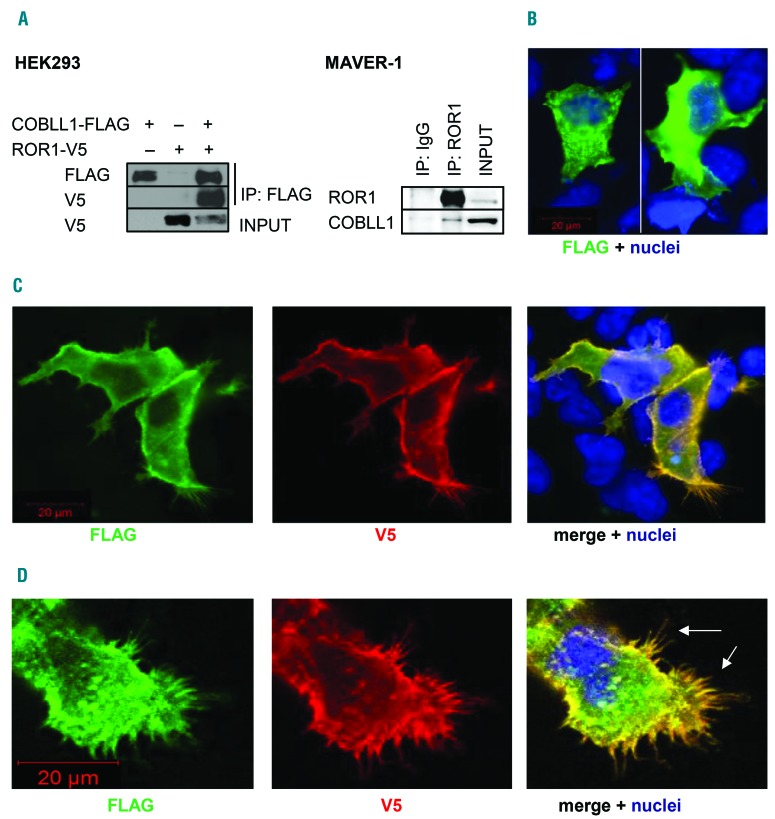
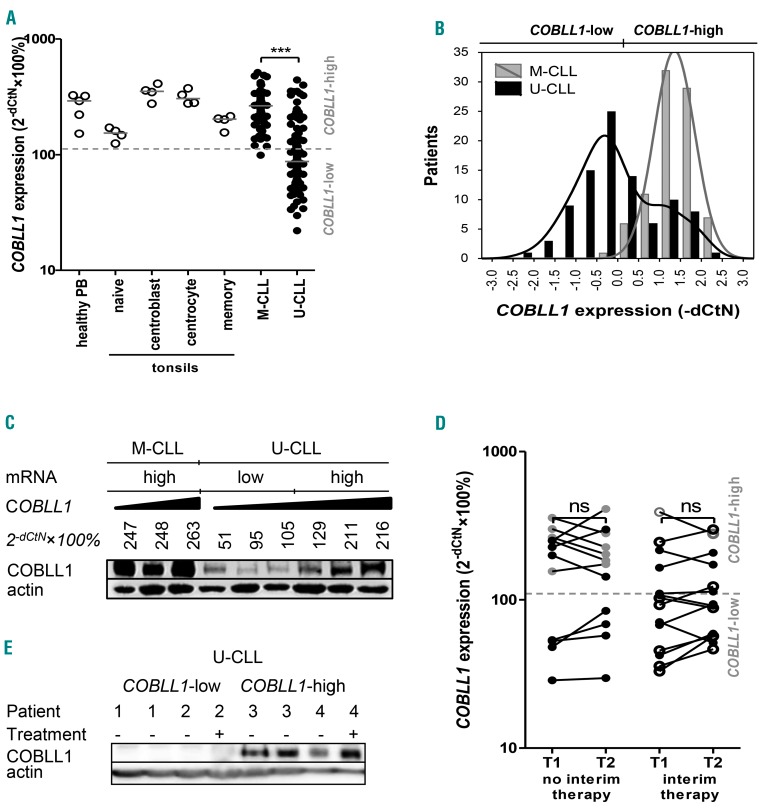
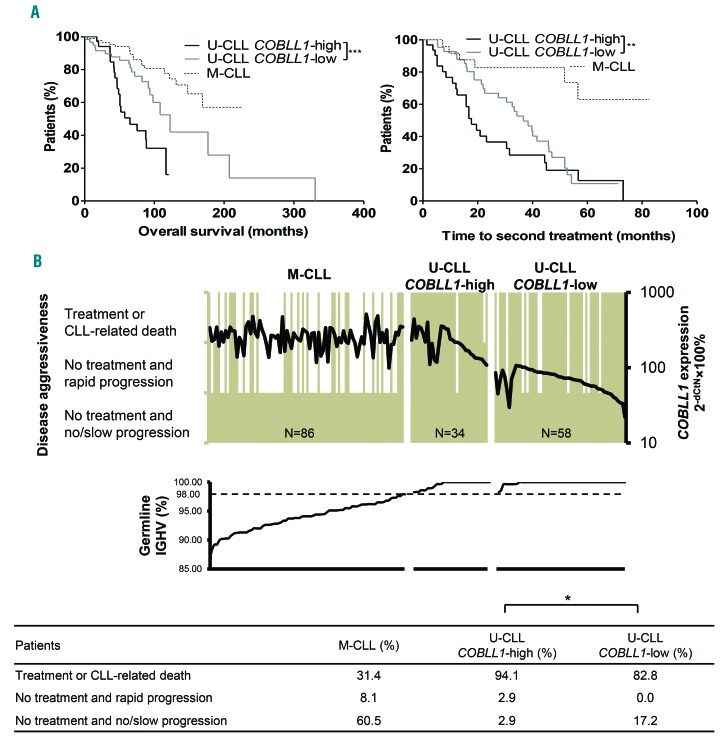
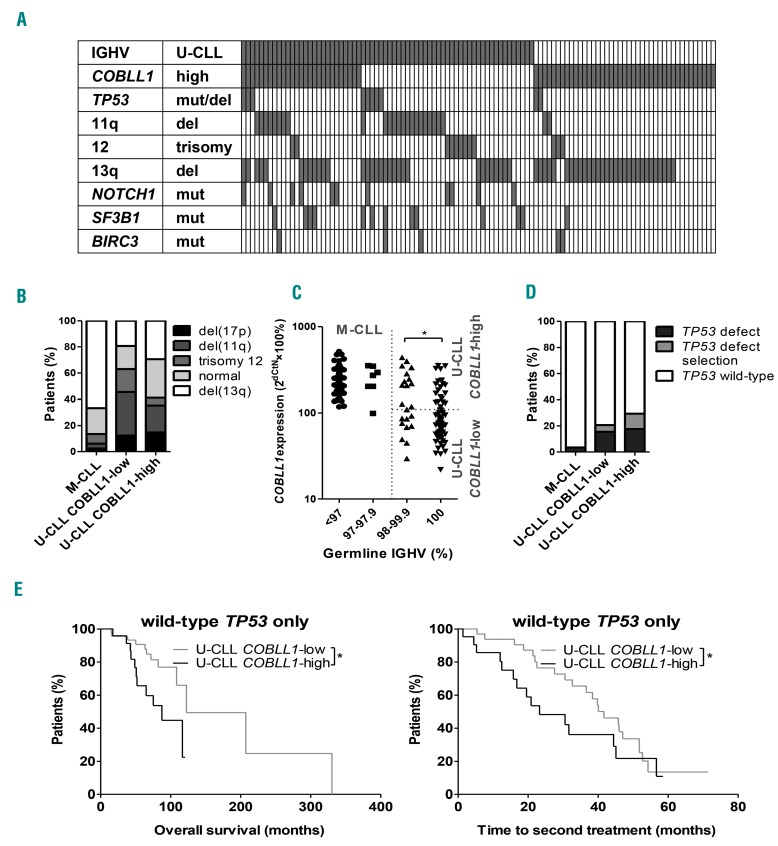
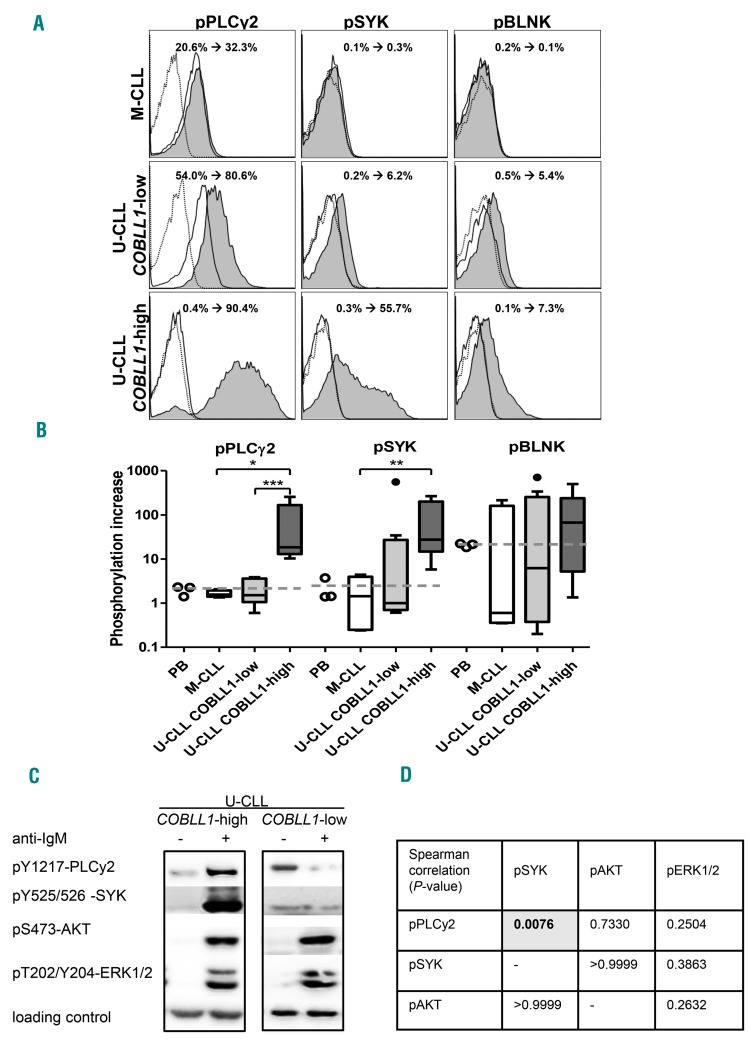
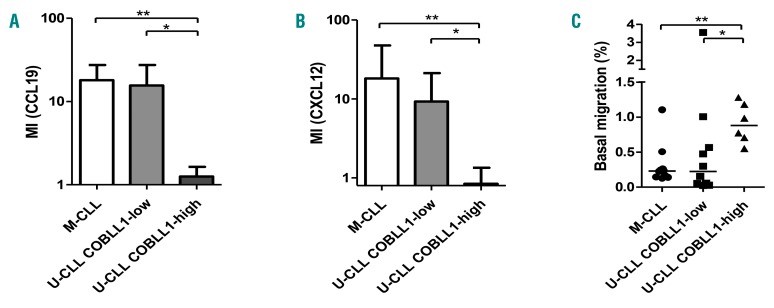
Chronic lymphocytic leukemia is a disease with up-regulated expression of the transmembrane tyrosine-protein kinase ROR1, a member of the Wnt/planar cell polarity pathway. In this study, we identified COBLL1 as a novel interaction partner of ROR1. COBLL1 shows clear bimodal expression with high levels in chronic lymphocytic leukemia patients with mutated IGHV and approximately 30% of chronic lymphocytic leukemia patients with unmutated IGHV. In the remaining 70% of chronic lymphocytic leukemia patients with unmutated IGHV, COBLL1 expression is low. Importantly, chronic lymphocytic leukemia patients with unmutated IGHV and high COBLL1 have an unfavorable disease course with short overall survival and time to second treatment. COBLL1 serves as an independent molecular marker for overall survival in chronic lymphocytic leukemia patients with unmutated IGHV. In addition, chronic lymphocytic leukemia patients with unmutated IGHV and high COBLL1 show impaired motility and chemotaxis towards CCL19 and CXCL12 as well as enhanced B-cell receptor signaling pathway activation demonstrated by increased PLCγ2 and SYK phosphorylation after IgM stimulation. COBLL1 expression also changes during B-cell maturation in non-malignant secondary lymphoid tissue with a higher expression in germinal center B cells than naïve and memory B cells. Our data thus suggest COBLL1 involvement not only in chronic lymphocytic leukemia but also in B-cell development. In summary, we show that expression of COBLL1, encoding novel ROR1-binding partner, defines chronic lymphocytic leukemia subgroups with a distinct response to microenvironmental stimuli, and independently predicts survival of chronic lymphocytic leukemia with unmutated IGHV.


Figures

Figure 1.
Figure 1.
COBLL1 is an ROR1-interaction partner. (A) (Left) COBLL1-ROR1 complex was efficiently immunoprecipitated in HEK293 cells transfected with plasmids encoding FLAG-tagged COBLL1 and V5-tagged ROR1. (Right). Endogenous COBLL1 was pulled down with endogenous ROR1 in MAVER-1 cells; unspecific IgG was used as a negative control. Immunoprecipitation input is loaded on the right. Protein levels were determined using western blotting and anti-FLAG, anti-V5, anti-ROR1 and anti-COBLL1 antibodies. IP: immunoprecipitation. (B–D) Immunofluorescence of HEK293 cells transfected with plasmids encoding FLAG-COBLL1 (B–D) and V5-ROR1 (C and D). COBLL1 over-expressed in HEK293 cells shows mostly cytoplasmic localization (B), but co-localizes with ROR1 in the membrane when ROR1 is co-expressed (C). The most efficient ROR1 and COBLL1 co-localization is observed in filopodia formed as a consequence of ROR1 overexpression (D, indicated by arrows). Protein expression was visualized using anti-FLAG, anti-V5 and corresponding secondary fluorescein-conjugated antibodies. Nuclei were visualized using DAPI staining.
Figure 2.
Figure 2.
COBLL1 expression in chronic lymphocytic leukemia (CLL) and non-malignant B cells. (A) COBLL1 mRNA expression in 86 mutated CLL (M-CLL), 92 unmutated CLL (U-CLL), and healthy B cells isolated from 4 tonsils and 5 peripheral blood (PB) samples. Individual dots represent individual patients. Full lines indicate median. dCtN - dCt value normalized for three independent datasets (see Methods); ***P<0.0001, Mann-Whitney test. (B) COBLL1 expression histogram follows a bimodal distribution pattern in U-CLL. (C) COBLL1 protein levels correspond very well with COBLL1 mRNA both in M-CLL and U-CLL cells. COBLL1 protein levels in CLL cells were determined using western blotting and anti-COBLL1 antibody. Actin was used as a loading control. Patient samples are ordered according to their IGHV mutation status and COBLL1 mRNA expression [in the ascending order; numbers indicate patients’ relative COBLL1 expression determined by qRT-PCR (see A)]. (D) COBLL1 mRNA expression does not change with time or treatment. COBLL1 expression was analyzed in each patient at two time points (T1 and T2, connected by line) with (left; 6 M-CLL, 6 U-CLL) or without (right; 1 M-CLL, 13 U-CLL) therapy in the interim. Patients were administrated mainly fludarabine-cyclophosphamide-rituximab (FCR) regimen. ○ M-CLL, ● U-CLL: open circle; FCR; full circle: other therapy. Wilcoxon signed rank test. ns: not significant. (E) COBLL1 expression does not change with time or treatment. Protein expression was detected in 2 U-CLL COBLL1-low patients (1 and 2) and 2 U-CLL COBLL1-high patients (3 and 4) at two time points with or without therapy in the interim. Western blotting and anti-COBLL1 and anti-actin (as a loading control) antibody was used.
Figure 3.
Figure 3.
Unmutated chronic lymphocytic leukemia (U-CLL) COBLL1-high patients show significantly shorter survival and progress more often compared to U-CLL COBLL1-low patients. (A) U-CLL COBLL1-high patients show shorter overall survival (left) and time to second treatment (right). Survival data are presented using Kaplan-Meier plots and tested by Gehan-Breslow-Wilcoxon test. (B) U-CLL COBLL1-high patients progress more often than patients in other groups. Progression (left y-axis, gray columns) categorized as 1 - no treatment and no/slow progression (clinical stage Rai 0/I at both diagnosis and sampling); 2 - no treatment but rapid progression (clinical stage Rai 0/I at diagnosis and II/III/IV at sampling); 3 - treatment or CLL-related death (various clinical stages at diagnosis and sampling). Patients are grouped based on their IGHV mutation/COBLL1 expression status, and ordered according to germline IGHV (in the ascending order, x-axis) and COBLL1 expression (descending order, full line, right y-axis). (A left and B). N: 86 mutated CLL (M-CLL), 58 U-CLL COBLL1-low, 34 U-CLL COBLL1-high. (A right). N: 28 M-CLL, 48 U-CLL COBLL1-low, 32 U-CLL COBLL1-high. *P≤0.05, **P≤0.01, ***P≤0.001. CLL progression was tested by Fisher’s exact test (U-CLL COBLL1-high vs. U-CLL COBLL1-low).
Figure 4.
Figure 4.
The survival difference between unmutated chronic lymphocytic leukemia (U-CLL) COBLL1-high and U-CLL COBLL1-low is not caused by recurrent mutations and chromosomal abnormalities. (A-D) Samples were analyzed by I-FISH [del(17p), del(11q), trisomy 12, del(11q)] and sequencing (mutations in IGHV, TP53, BIRC3, NOTCH1, SF3B1). TP53 defect - TP53 mutation, deletion or both. (A) U-CLL COBLL1-low and U-CLL COBLL1-high patients do not exhibit any differences in the occurrence of recurrent defects [TP53 defect, BIRC3, NOTCH1 and SF3B1 mutations, del(11q), trisomy 12, del(13q)] or (B) in cytogenetic aberrations evaluated according to the hierarchical model. (C) Expression of COBLL1 categorized according to the IGHV mutation load. (D) U-CLL COBLL1-high patients exhibit non-significantly higher incidence of TP53 defect at diagnosis or its later selection. (A) 41 mutated CLL (M-CLL), 37 U-CLL COBLL1-low, 29 U-CLL COBLL1-high. (B-D) 86 M-CLL, 58 U-CLL COBLL1-low, 34 U-CLL COBLL1-high. (D) Adverse survival of U-CLL COBLL1-high patients is retained even in TP53 wild-type patients. (D) (Left) Overall survival: 46 U-CLL COBLL1-low, 24 U-CLL COBLL1-high. (D) (Right) Time to second treatment: 37 U-CLL COBLL1-low, 22 U-CLL COBLL1-high. *P≤0.05, **P≤0.01, ***P≤0.001. Aberrations frequency tested by Fisher’s exact test, survival data tested by Gehan-Breslow-Wilcoxon test, germline IGHV tested by Mann-Whitney test.
Figure 5.
Figure 5.
U-CLL COBLL1-high cells show higher response upon BCR stimulation. (A and B). Chronic lymphocytic leukemia (CLL) cells (4 mutated CLL (M-CLL), 8 U-CLL COBLL1-low, 6 U-CLL COBLL1-high) were stimulated for 4 minutes with anti-IgM and response to BCR stimulation was analyzed using phospho-specific antibodies targeted against pPLCγ2, pSYK and pBLNK. (A) Representative examples of M-CLL, U-CLL COBLL1-low and U-CLL COBLL1-high patients. Histograms show a negative control (unstimulated non-stained sample, dotted line), unstimulated sample (full line) and IgM-stimulated sample (full line, gray area). Percentage of positive cells is indicated (unstimulated sample → stimulated sample). (B) Quantification of changes in the pPLCγ2, pSYK and pBLNK. Phosphorylation increase (y-axis) was calculated as a ratio of positive cells in IgM-stimulated versus unstimulated samples. Box-and-Whisker plots show quartiles and median. Dashed line indicates phosphorylation increase in non-malignant peripheral blood (PB) B cells (mean), • outliers, *P≤0.05, **P≤0.01, ***P≤0.001. Mann-Whitney test. (C) Western blot analysis of representative U-CLL samples treated with anti-IgM and analyzed for activation of BCR components using phospho-specific antibodies - PLCγ2 (pY1217), pSYK (pY525/526), pAKT (pS473) and pERK1/2 (pT202/Y204). Loading control: β-actin (left), total PLCγ2 (right). (D) Correlation of the response at the level of individual kinases (Spearman correlation). Statistically significant P-values are highlighted in bold with gray background. See Online Supplementary Figure S7 for details and raw data.
Figure 6.
Figure 6.
Unmutated chronic lymphocytic leukemia (U-CLL) COBLL1-high cells show deregulated chemotaxis and motility. Migratory properties of 10 mutated CLL (M-CLL), 10 U-CLL COBLL1-low, and 6 U-CLL COBLL1-high samples were assessed using transwell plates. (A) Chemotaxis towards chemokine CCL19 expressed as migration index (MI). (B) Chemotaxis towards chemokine CXCL12 expressed as MI. (C) Basal migration. MI was calculated as the number of cells migrated towards chemokine divided by the number of cells migrated in chemokine-free media. Basal migration was calculated as the percentage of migrated cells from all seeded cells. Each measurement was performed in a technical triplicate. Bars represent mean+Standard Deviation (S.D.) (A and B) Individual dots represent individual patients (C). *P≤0.05, **P≤0.01. (Mann-Whitney test).

Similar articles

Cited by

References

    1. Klein U, Tu Y, Stolovitzky GA, et al. Gene expression profiling of B cell chronic lymphocytic leukemia reveals a homogeneous phenotype related to memory B cells. J Exp Med. 2001;194(11):1625–1638. - PMC - PubMed
    1. Rosenwald A, Alizadeh AA, Widhopf G, et al. Relation of gene expression phenotype to immunoglobulin mutation genotype in B cell chronic lymphocytic leukemia. J Exp Med. 2001;194(11):1639–1647. - PMC - PubMed
    1. Masiakowski P, Carroll RD. A novel family of cell surface receptors with tyrosine kinase-like domain. J Biol Chem. 1992; 267(36):26181–26190. - PubMed
    1. Fukuda T, Chen L, Endo T, et al. Antisera induced by infusions of autologous Ad-CD154-leukemia B cells identify ROR1 as an oncofetal antigen and receptor for Wnt5a. Proc Natl Acad Sci USA. 2008; 105(8):3047–3052. - PMC - PubMed
    1. Baskar S, Kwong KY, Hofer T, et al. Unique cell surface expression of receptor tyrosine kinase ROR1 in human B-cell chronic lymphocytic leukemia. Clin Cancer Res. 2008; 14(2):396–404. - PubMed

Publication types

MeSH terms

Substances