Mitogen-activated protein kinase (MAPK) dynamics determine cell fate in the yeast mating response
- PMID: 29123025
- PMCID: PMC5733576
- DOI: 10.1074/jbc.AC117.000548
Mitogen-activated protein kinase (MAPK) dynamics determine cell fate in the yeast mating response
Abstract
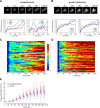
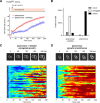
In the yeast Saccharomyces cerevisiae, the exposure to mating pheromone activates a prototypic mitogen-activated protein kinase (MAPK) cascade and triggers a dose-dependent differentiation response. Whereas a high pheromone dose induces growth arrest and formation of a shmoo-like morphology in yeast cells, lower pheromone doses elicit elongated cell growth. Previous population-level analysis has revealed that the MAPK Fus3 plays an important role in mediating this differentiation switch. To further investigate how Fus3 controls the fate decision process at the single-cell level, we developed a specific translocation-based reporter for monitoring Fus3 activity in individual live cells. Using this reporter, we observed strikingly different dynamic patterns of Fus3 activation in single cells differentiated into distinct fates. Cells committed to growth arrest and shmoo formation exhibited sustained Fus3 activation. In contrast, most cells undergoing elongated growth showed either a delayed gradual increase or pulsatile dynamics of Fus3 activity. Furthermore, we found that chemically perturbing Fus3 dynamics with a specific inhibitor could effectively redirect the mating differentiation, confirming the causative role of Fus3 dynamics in driving cell fate decisions. MAPKs mediate proliferation and differentiation signals in mammals and are therapeutic targets in many cancers. Our results highlight the importance of MAPK dynamics in regulating single-cell responses and open up the possibility that MAPK signaling dynamics could be a pharmacological target in therapeutic interventions.
Keywords: cell fate decision; cell signaling; differentiation; imaging; mitogen-activated protein kinase (MAPK); pheromone; single-cell analysis; yeast mating response.
© 2017 by The American Society for Biochemistry and Molecular Biology, Inc.
Conflict of interest statement
The authors declare that they have no conflicts of interest with the contents of this article
Figures


Similar articles
-
Quantitative proteomics reveals a Gα/MAPK signaling hub that controls pheromone-induced cellular polarization in yeast.J Proteomics. 2019 Sep 15;207:103467. doi: 10.1016/j.jprot.2019.103467. Epub 2019 Jul 24. J Proteomics. 2019. PMID: 31351147
-
Single-cell dynamics and variability of MAPK activity in a yeast differentiation pathway.Proc Natl Acad Sci U S A. 2016 Oct 4;113(40):E5896-E5905. doi: 10.1073/pnas.1610081113. Epub 2016 Sep 20. Proc Natl Acad Sci U S A. 2016. PMID: 27651485 Free PMC article.
-
MAPK specificity in the yeast pheromone response independent of transcriptional activation.Curr Biol. 2001 Aug 21;11(16):1266-71. doi: 10.1016/s0960-9822(01)00370-0. Curr Biol. 2001. PMID: 11525741
-
Dynamics and organization of MAP kinase signal pathways.Mol Reprod Dev. 1995 Dec;42(4):477-85. doi: 10.1002/mrd.1080420416. Mol Reprod Dev. 1995. PMID: 8607979 Review.
-
Heterotrimeric G Protein-coupled Receptor Signaling in Yeast Mating Pheromone Response.J Biol Chem. 2016 Apr 8;291(15):7788-95. doi: 10.1074/jbc.R116.714980. Epub 2016 Feb 23. J Biol Chem. 2016. PMID: 26907689 Free PMC article. Review.
Cited by
-
Spatio-temporal MAPK dynamics mediate cell behavior coordination during fungal somatic cell fusion.J Cell Sci. 2018 May 4;131(9):jcs213462. doi: 10.1242/jcs.213462. J Cell Sci. 2018. PMID: 29592970 Free PMC article.
-
Chaperone-Dependent Degradation of Cdc42 Promotes Cell Polarity and Shields the Protein from Aggregation.Mol Cell Biol. 2023;43(5):200-222. doi: 10.1080/10985549.2023.2198171. Epub 2023 Apr 28. Mol Cell Biol. 2023. PMID: 37114947 Free PMC article.
-
Quantitative analysis of the yeast pheromone pathway.Yeast. 2019 Aug;36(8):495-518. doi: 10.1002/yea.3395. Epub 2019 Jun 27. Yeast. 2019. PMID: 31022772 Free PMC article.
-
Yeast cell fate control by temporal redundancy modulation of transcription factor paralogs.Nat Commun. 2021 May 25;12(1):3145. doi: 10.1038/s41467-021-23425-0. Nat Commun. 2021. PMID: 34035307 Free PMC article.
-
Constructing network topologies for multiple signal-encoding functions.BMC Syst Biol. 2019 Jan 11;13(1):6. doi: 10.1186/s12918-018-0676-5. BMC Syst Biol. 2019. PMID: 30634968 Free PMC article.
References
-
- Santos S. D., Verveer P. J., and Bastiaens P. I. (2007) Growth factor-induced MAPK network topology shapes Erk response determining PC-12 cell fate. Nat. Cell Biol. 9, 324–330 - PubMed
-
- Marshall C. J. (1995) Specificity of receptor tyrosine kinase signaling: transient versus sustained extracellular signal-regulated kinase activation. Cell 80, 179–185 - PubMed
MeSH terms
Substances
Grants and funding
LinkOut - more resources
Full Text Sources
Other Literature Sources
Molecular Biology Databases

