

Dynamic energy dependency of Chlamydia trachomatis on host cell metabolism during intracellular growth: Role of sodium-based energetics in chlamydial ATP generation
- PMID: 29123027
- PMCID: PMC5767857
- DOI: 10.1074/jbc.M117.797209
Dynamic energy dependency of Chlamydia trachomatis on host cell metabolism during intracellular growth: Role of sodium-based energetics in chlamydial ATP generation
Abstract
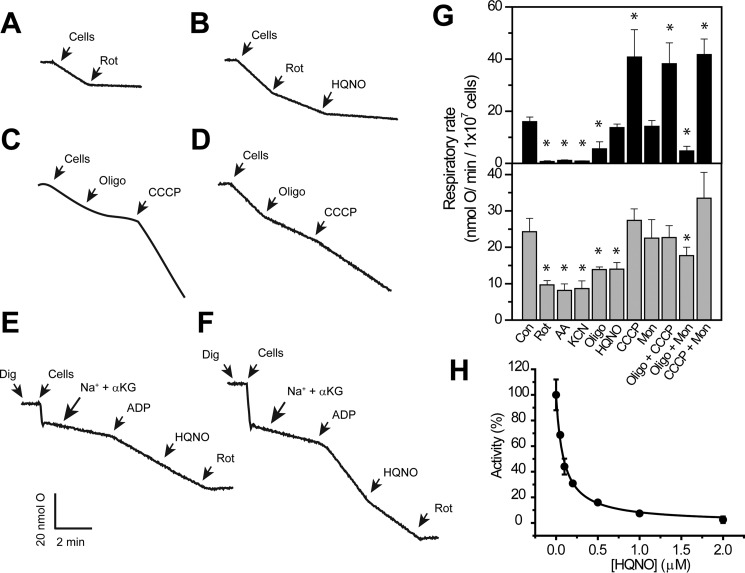
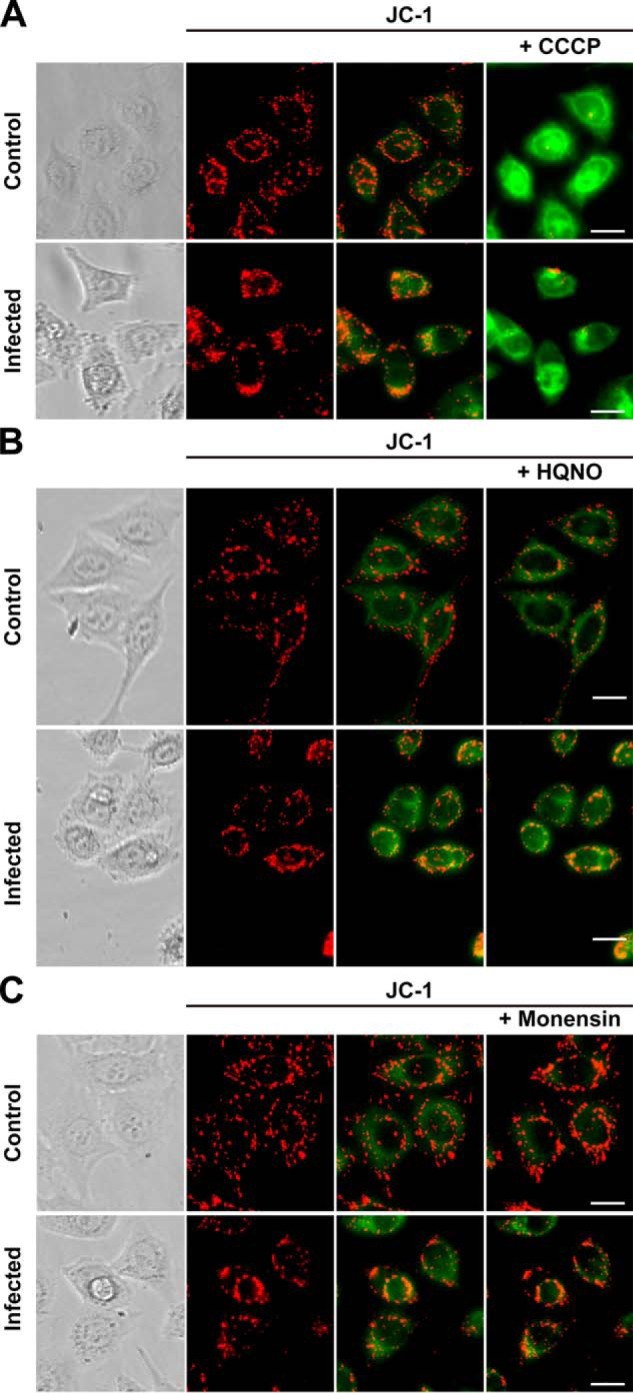
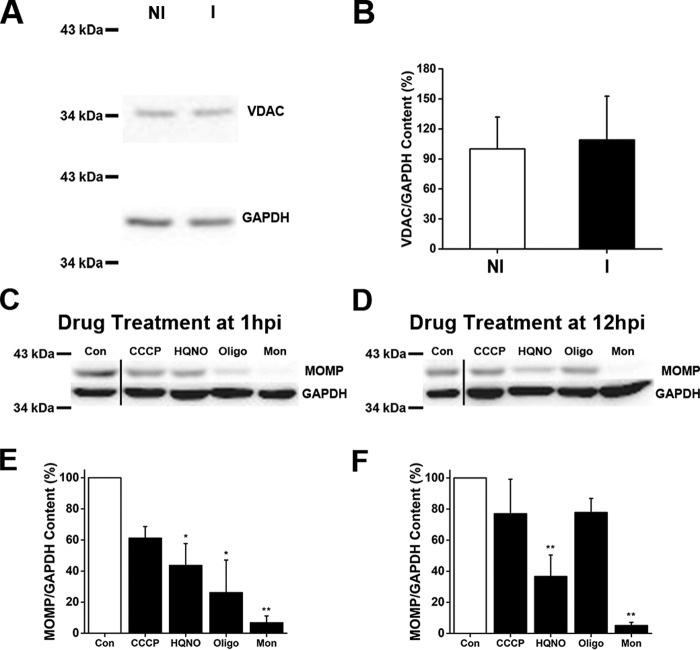
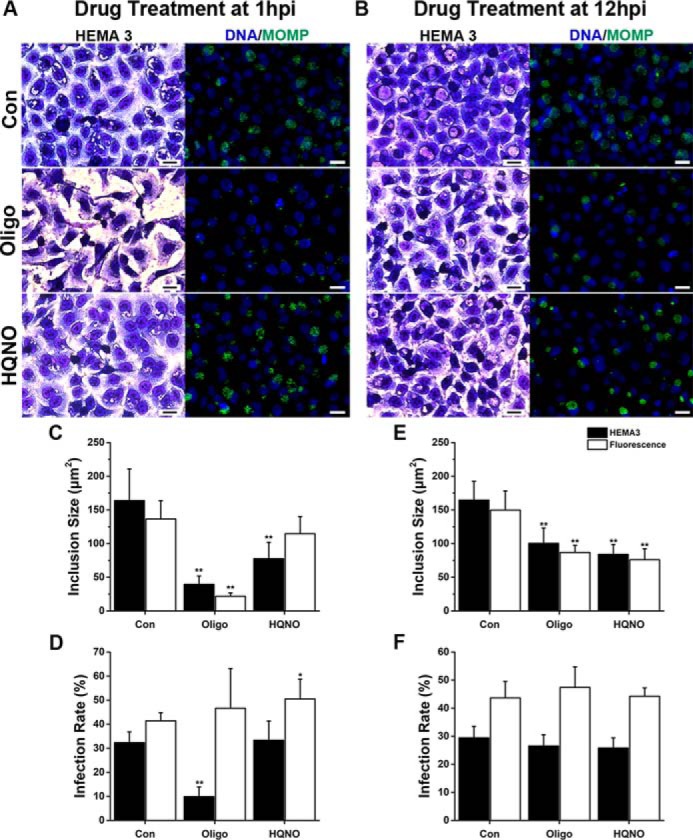
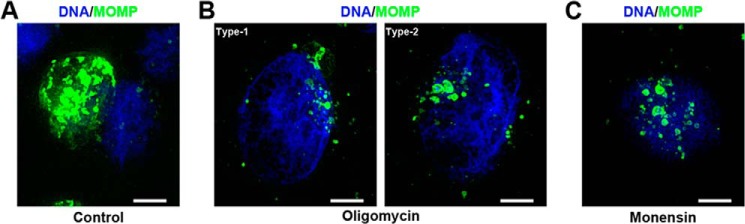
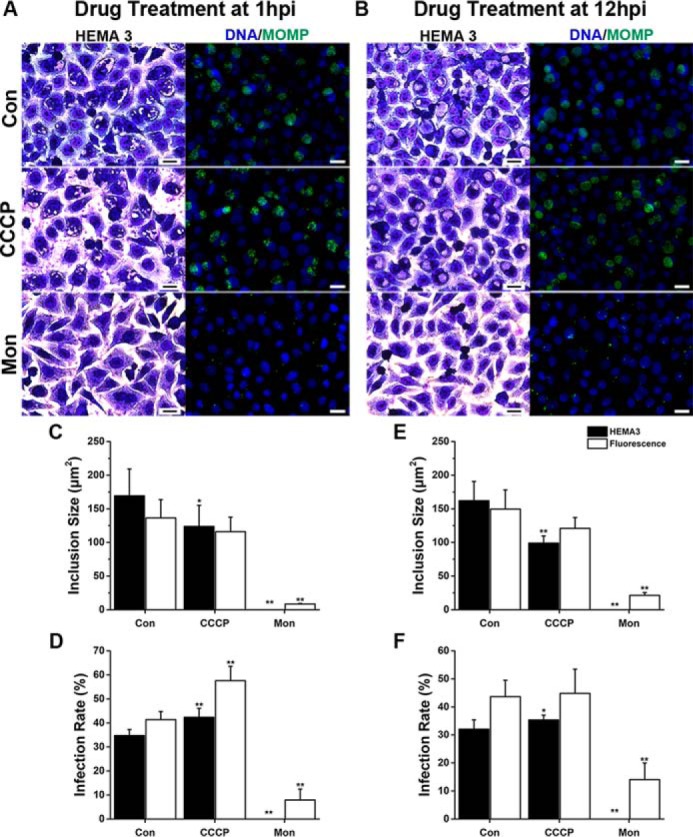
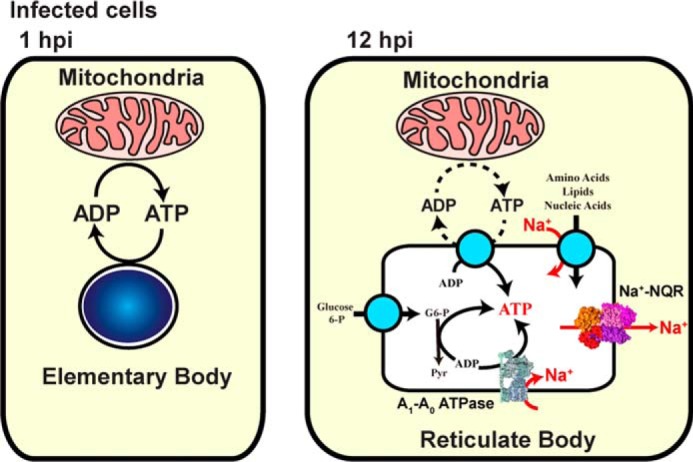
Chlamydia trachomatis is an obligate intracellular human pathogen responsible for the most prevalent sexually-transmitted infection in the world. For decades C. trachomatis has been considered an "energy parasite" that relies entirely on the uptake of ATP from the host cell. The genomic data suggest that C. trachomatis respiratory chain could produce a sodium gradient that may sustain the energetic demands required for its rapid multiplication. However, this mechanism awaits experimental confirmation. Moreover, the relationship of chlamydiae with the host cell, in particular its energy dependence, is not well understood. In this work, we are showing that C. trachomatis has an active respiratory metabolism that seems to be coupled to the sodium-dependent synthesis of ATP. Moreover, our results show that the inhibition of mitochondrial ATP synthesis at an early stage decreases the rate of infection and the chlamydial inclusion size. In contrast, the inhibition of the chlamydial respiratory chain at mid-stage of the infection cycle decreases the inclusion size but has no effect on infection rate. Remarkably, the addition of monensin, a Na+/H+ exchanger, completely halts the infection. Altogether, our data indicate that chlamydial development has a dynamic relationship with the mitochondrial metabolism of the host, in which the bacterium mostly depends on host ATP synthesis at an early stage, and at later stages it can sustain its own energy needs through the formation of a sodium gradient.
Keywords: ATP synthase; Chlamydia trachomatis; energy metabolism; host-pathogen interaction; mitochondrial metabolism; respiratory chain.
© 2018 by The American Society for Biochemistry and Molecular Biology, Inc.
Conflict of interest statement
The authors declare that they have no conflicts of interest with the contents of this article
Figures
Similar articles
-
Regulation of the Mitochondrion-Fatty Acid Axis for the Metabolic Reprogramming of Chlamydia trachomatis during Treatment with β-Lactam Antimicrobials.mBio. 2021 Mar 30;12(2):e00023-21. doi: 10.1128/mBio.00023-21. mBio. 2021. PMID: 33785629 Free PMC article.
-
Chlamydia trachomatis targets mitochondrial dynamics to promote intracellular survival and proliferation.Cell Microbiol. 2019 Jan;21(1):e12962. doi: 10.1111/cmi.12962. Epub 2018 Oct 30. Cell Microbiol. 2019. PMID: 30311994
-
Chlamydia trachomatis genes whose products are related to energy metabolism are expressed differentially in active vs. persistent infection.Microbes Infect. 2002 Jan;4(1):13-22. doi: 10.1016/s1286-4579(01)01504-0. Microbes Infect. 2002. PMID: 11825770
-
Pathogenic Puppetry: Manipulation of the Host Actin Cytoskeleton by Chlamydia trachomatis.Int J Mol Sci. 2019 Dec 21;21(1):90. doi: 10.3390/ijms21010090. Int J Mol Sci. 2019. PMID: 31877733 Free PMC article. Review.
-
Chlamydia trachomatis: the Persistent Pathogen.Clin Vaccine Immunol. 2017 Oct 5;24(10):e00203-17. doi: 10.1128/CVI.00203-17. Print 2017 Oct. Clin Vaccine Immunol. 2017. PMID: 28835360 Free PMC article. Review.
Cited by
-
Mitochondrial dynamics regulate genome stability via control of caspase-dependent DNA damage.Dev Cell. 2022 May 23;57(10):1211-1225.e6. doi: 10.1016/j.devcel.2022.03.019. Epub 2022 Apr 20. Dev Cell. 2022. PMID: 35447090 Free PMC article.
-
The aerobic respiratory chain of Pseudomonas aeruginosa cultured in artificial urine media: Role of NQR and terminal oxidases.PLoS One. 2020 Apr 23;15(4):e0231965. doi: 10.1371/journal.pone.0231965. eCollection 2020. PLoS One. 2020. PMID: 32324772 Free PMC article.
-
Amino acids as wetting agents: surface translocation by Porphyromonas gingivalis.ISME J. 2019 Jun;13(6):1560-1574. doi: 10.1038/s41396-019-0360-9. Epub 2019 Feb 19. ISME J. 2019. PMID: 30783212 Free PMC article.
-
Tracking Chlamydia and Syphilis in the Detroit Metro Area by Molecular Analysis of Environmental Samples.Environ Sci Technol. 2024 Oct 8;58(40):17606-17616. doi: 10.1021/acs.est.4c05869. Epub 2024 Sep 30. Environ Sci Technol. 2024. PMID: 39344309 Free PMC article.
-
Metabolism and physiology of pathogenic bacterial obligate intracellular parasites.Front Cell Infect Microbiol. 2024 Mar 22;14:1284701. doi: 10.3389/fcimb.2024.1284701. eCollection 2024. Front Cell Infect Microbiol. 2024. PMID: 38585652 Free PMC article. Review.
References
-
- World Health Organization. (2012) Global incidence and prevalence of selected curable sexually transmitted infections–2008, World Health Organization, Geneva, Switzerland
-
- Newman L., Rowley J., Vander Hoorn S., Wijesooriya N. S., Unemo M., Low N., Stevens G., Gottlieb S., Kiarie J., and Temmerman M. (2015) Global estimates of the prevalence and incidence of four curable sexually transmitted infections in 2012 based on Systematic Review and Global Reporting. PLoS ONE 10, e0143304 10.1371/journal.pone.0143304 - DOI - PMC - PubMed
Publication types
MeSH terms
Substances
LinkOut - more resources
Full Text Sources
Other Literature Sources
Molecular Biology Databases
