. 2017 Nov 10;8(1):1404.
doi: 10.1038/s41467-017-00784-1.

Resistance to cancer immunotherapy mediated by apoptosis of tumor-infiltrating lymphocytes

Affiliations

Resistance to cancer immunotherapy mediated by apoptosis of tumor-infiltrating lymphocytes

Jingjing Zhu et al. Nat Commun. .

Abstract

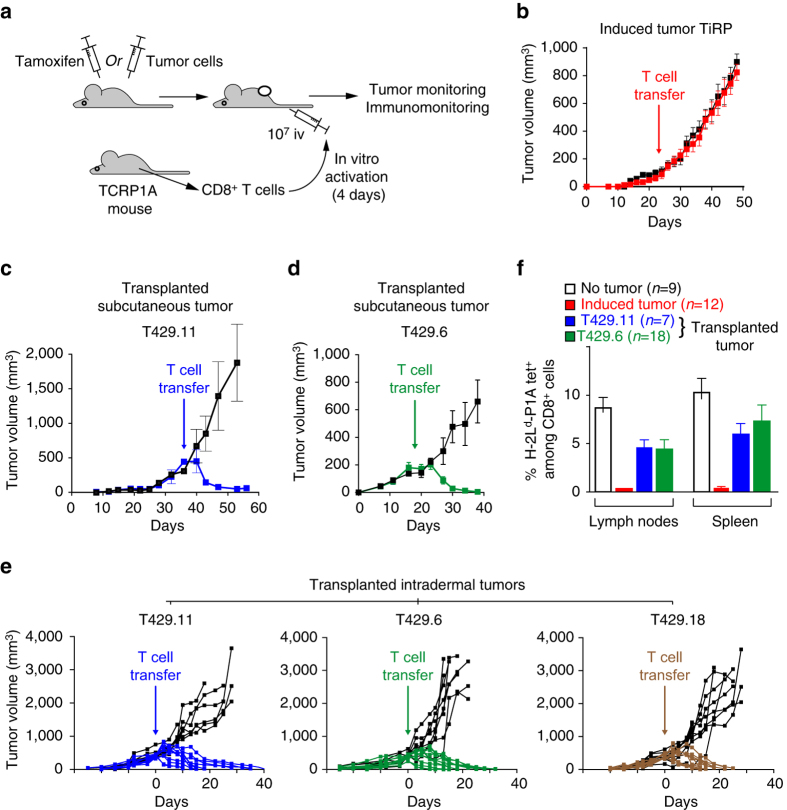
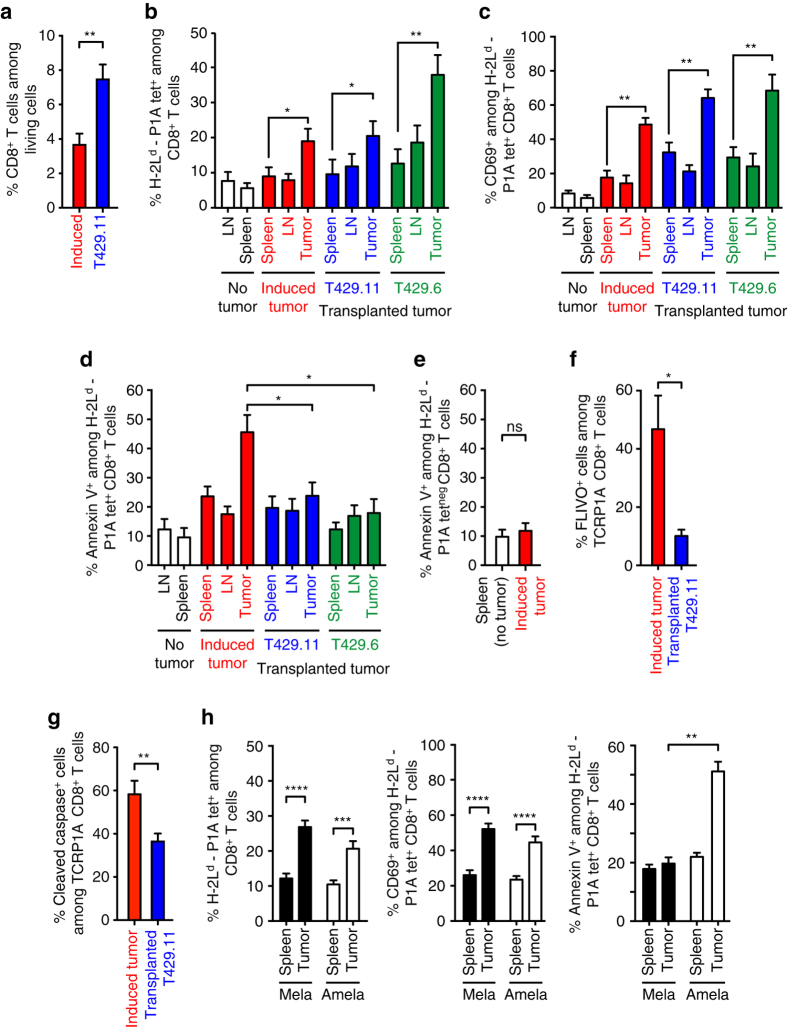
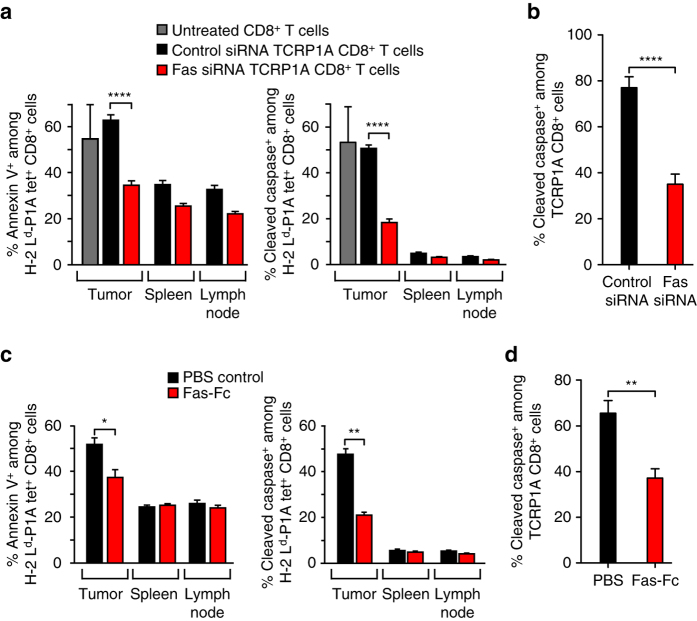
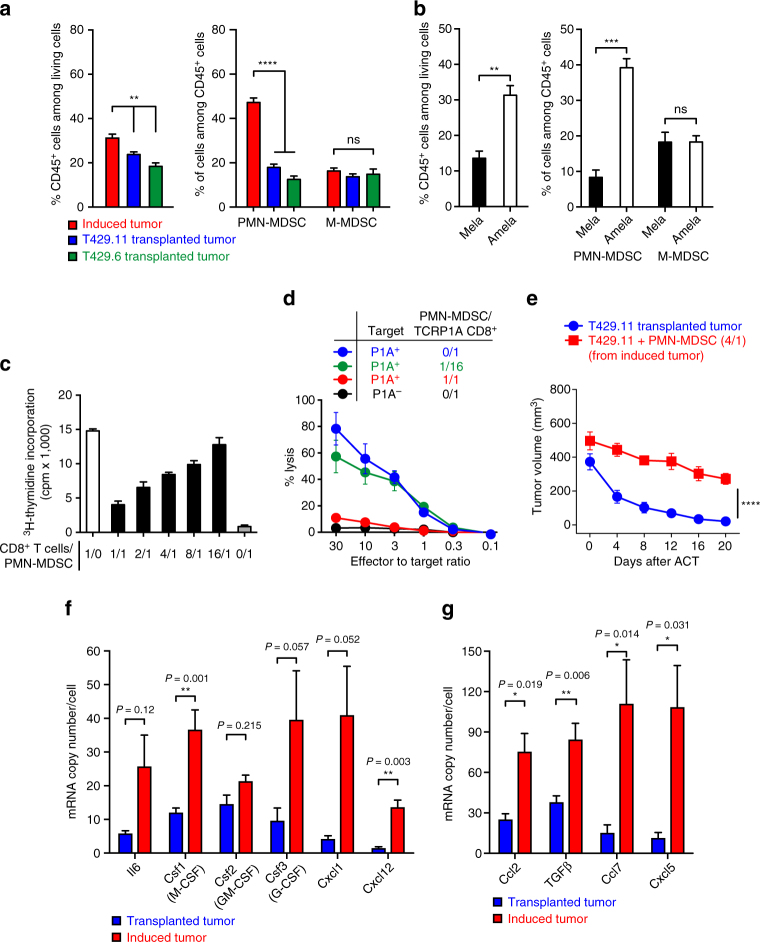
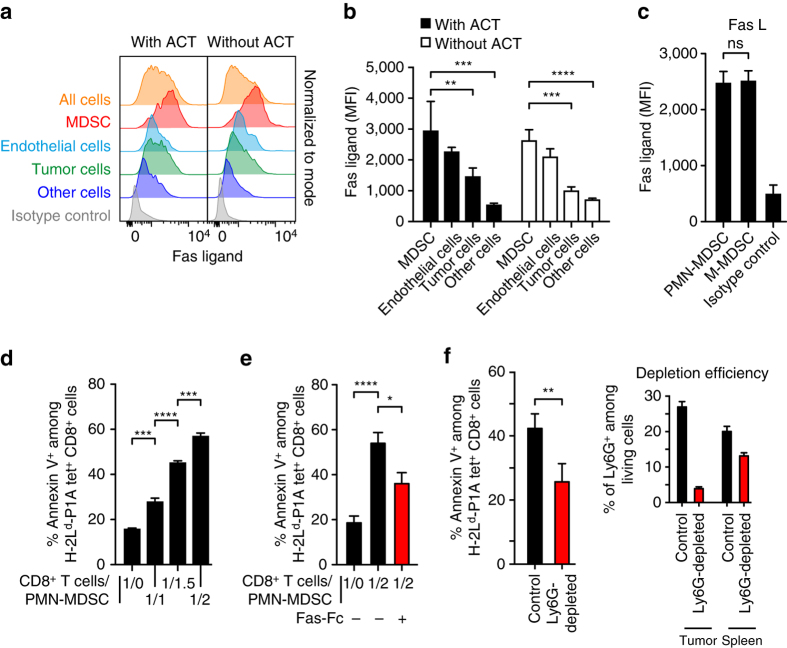
Despite impressive clinical success, cancer immunotherapy based on immune checkpoint blockade remains ineffective in many patients due to tumoral resistance. Here we use the autochthonous TiRP melanoma model, which recapitulates the tumoral resistance signature observed in human melanomas. TiRP tumors resist immunotherapy based on checkpoint blockade, cancer vaccines or adoptive T-cell therapy. TiRP tumors recruit and activate tumor-specific CD8+ T cells, but these cells then undergo apoptosis. This does not occur with isogenic transplanted tumors, which are rejected after adoptive T-cell therapy. Apoptosis of tumor-infiltrating lymphocytes can be prevented by interrupting the Fas/Fas-ligand axis, and is triggered by polymorphonuclear-myeloid-derived suppressor cells, which express high levels of Fas-ligand and are enriched in TiRP tumors. Blocking Fas-ligand increases the anti-tumor efficacy of adoptive T-cell therapy in TiRP tumors, and increases the efficacy of checkpoint blockade in transplanted tumors. Therefore, tumor-infiltrating lymphocytes apoptosis is a relevant mechanism of immunotherapy resistance, which could be blocked by interfering with the Fas/Fas-ligand pathway.


Conflict of interest statement

The authors declare no competing financial interests.

Figures

Fig. 1
Fig. 1
Induced TiRP tumors resist immunotherapy. a Schedule for tumor induction and immunotherapy. TiRP mice (B10.D2;Ink4a/Arfflox/flox;TiRP+/+) injected twice with 4 mg 4OH-tamoxifen on day 0 and 15, were also injected as indicated with anti-CTLA4 (4 × 40 µg) and/or anti-PD1 (4 × 200 µg) and/or a prime/boost vaccine regimen of recombinant adenovirus (Adeno.Ii.P1At) and Semliki Forest virus (SFV.P1A) encoding the MAGE-type tumor antigen P1A. Tumor appearance and mice survival were monitored. The figure represents the cumulative data of three experiments. b Tumor-bearing TiRP mice and control mice (B10.D2;Ink4a/Arfflox/flox mice, which have the same genetic background as TiRP mice but lack the TiRP transgene) were immunized with the P1A vaccine as above, and the P1A-specific CD8+ T-cell response was monitored by FACS in spleen cells stimulated one week with P1A-peptide pulsed spleen cells, using antibodies to CD3ε and CD8α, and H-2Ld-P1A tetramers. Five mice were analyzed at each time point for each group. c TiRP mice were immunized simultaneously against P1A as above and against the irrelevant H-2Ld-restricted antigen P91A (mutated peptide) by intramuscular injections of P91A peptide in AS15 adjuvant one week apart during 1 month. Mice were then treated with 4OH-tamoxifen. At the time of tumor appearance, spleen cells were stimulated one week with P1A or P91A peptide-pulsed spleen cells, and P1A- or P91A-specific CD8+ T cells were quantified by FACS analysis using the relevant H-2Ld tetramers. Results are expressed as mean + s.e.m. Unpaired t-test, two-tailed c, *P < 0.05, **P < 0.01
Fig. 2
Fig. 2
Rejection of transplanted but not induced autochthonous tumors after adoptive transfer of tumor-specific CD8+ T cells. a Adoptive transfer protocol. Mice bearing induced autochthonous Amela TiRP tumors or transplanted isogenic tumors received intravenously 107 CD8+ T cells that were isolated from TCRP1A B10.D2 mice and activated 4 days in vitro by co-incubation with lethally irradiated cells expressing P1A and B7-1 (L1210.P1A.B7-1). b TiRP mice bearing induced Amela tumors 22–24 days after 4OH-tamoxifen injection received adoptive transfer (n = 32) of 107 TCRP1A CD8+ T cells activated in vitro for 4 days (red symbols). Black symbols show control mice (n = 30) receiving no T cells. Tumor volume is shown. (Data accumulated from two identical experiments). c Mice (B10.D2;Ink4a/Arfflox/flox) were injected subcutaneously with 2 × 106 cells from clone 11 of isogenic tumor line T429, which had previously been adapted to culture from an induced Amela TiRP tumor. After 36 days, mice received an intravenous injection of 107 activated TCRP1A CD8+ T cells (blue symbols). Control mice received no T cells (black symbols). Tumor volume was monitored. Results are shown from one representative experiment (n = 6/group) out of at least three performed. d Same as in panel c but using another clone (T429.6) from tumor line T429. Mice received 107 activated TCRP1A CD8+ T cells (green symbols) or not (black symbols) 18 days after tumor injection. Results are shown from one representative experiment (n = 6−7/group) out of at least three performed. e B10.D2;Ink4a/Arfflox/flox mice were injected intradermally (2 × 106 cells) with three distinct clones of tumor line T429. When tumors reached a size of about 400 mm3, mice received an intravenous injection of 107 activated TCRP1A CD8+ T cells (colored curves). Black symbols indicate control mice that received no T cells. Tumor growth was monitored. Individual growth curves are shown (8–10 mice/group). f Mice treated as in panels bd were killed 22 days after T-cell transfer, and cells from the spleen and the draining lymph nodes were tested ex vivo (i.e. without in vitro stimulation) for the presence of P1A-specific T cells by FACS using H-2Ld-P1A tetramer. The number of mice analyzed is indicated for each group. Results are expressed as mean ± s.e.m
Fig. 3
Fig. 3
In vivo apoptosis of tumor-infiltrating CD8+ T cells 4 days after transfer. a Mice bearing induced (n = 14) or transplanted (n = 13) tumors (500 mm3) received adoptive transfer of TCRP1A CD8+ T cells as in Fig. 2. Four days later, tumors were analyzed by FACS ex vivo for CD8+ T cells among living cells. bd Draining lymph nodes (LN), spleens and tumors from tumor-bearing mice were analyzed 4 days after adoptive transfer of TCRP1A CD8+ T cells by ex vivo FACS staining for CD8 and H-2Ld-P1A tetramers b, CD69 c, and with Annexin V d (for bd: n = 75 mice for induced tumors, n = 75 mice for T429.11, n = 32 mice for T429.6, n = 12 for tumor-free mice). e H-2Ld-P1A tetramer-negative CD8+ T cells infiltrating induced tumors or spleens from tumor-free mice were stained for Annexin V. Mice were identical to bd (induced tumors: n = 75, spleens from tumor-free mice: n = 12). f Mice bearing induced (n = 4) or transplanted (n = 3) tumors (500 mm3) were transferred with activated TCRP1A CD8+ T cells. Four days after transfer, they received an i.v. injection of FLIVO (inhibitor-based pan-caspase probe) 4 h before killing. Apoptosis of TCRP1A CD8+ T cells was evaluated ex vivo by FACS staining for FLIVO. Mice receiving a non-targeting FLIVO control dye showed no staining of TCRP1A CD8+ T cells. g Slices (300 µm) of fresh tumor tissues were incubated with CMAC-stained TCRP1A CD8+ T cells for 24 h. Cryosections (7 μm) were stained for apoptosis using inhibitor-based active pan-caspase marker FLICA, and scanned with a MIRAX digital microscope. Data were quantified using Biopix software (n = 5 mice/group; three sections analyzed per mouse). h TiRP mice bearing either pigmented (Mela) or unpigmented (Amela) induced tumors were treated and analyzed as in bd (n = 20 mice/group). Results are expressed as mean + s.e.m. Unpaired t-test, two-tailed ah, *P < 0.05, **P < 0.01, ***P < 0.001. ****P < 0.0001
Fig. 4
Fig. 4
Role of IFNγ in triggering apoptosis of tumor-specific CD8+ T cells. a Quantitative RT-PCR analysis of IFNγ mRNA expression in induced TiRP tumor tissues collected 4 days after ACT. Results normalized to β-actin are expressed relative to the level measured in control tumors that did not receive ACT (controls: n = 20; ACT: n = 24). b Fresh homogenates from induced tumors collected 4 days after ACT were cultured in vitro for 24 h and supernatants were tested by ELISA for the presence of IFNγ (controls: n = 22; ACT: n = 34). c Tumor-bearing mice received 0.5 mg neutralizing anti-IFNγ antibody i.p. 1 day before transfer of activated TCRP1A CD8+ T cells. Four days after transfer, dissociated tumor tissues were analyzed ex vivo by FACS for apoptosis of TCRP1A CD8+ T cells (controls: n = 23; anti-IFNγ: n = 9). d Quantitative RT-PCR analysis of FasL mRNA expression in induced TiRP tumor tissues collected 4 days after transfer of activated TCRP1A CD8+ T cells preceded or not by injection of neutralizing anti-IFNγ antibody as in ac. Results normalized to β-actin mRNA level are expressed relative to the level measured in control tumors that did not receive TCRP1A CD8+ T-cell transfer (controls: n = 12; T-cell transfer: n = 11; T-cell transfer + anti-IFNγ: n = 8). e Quantitative RT-PCR analysis of FasL mRNA expression in induced TiRP tumor tissues (n = 19) as compared with T429.11 transplanted tumor tissues (n = 14). Results normalized to Gapdh are expressed relative to the level measured in transplanted tumors. Results are expressed as mean ± s.e.m. Unpaired t-test, two-tailed, *P < 0.05, **P < 0.01, ***P < 0.001. ****P < 0.0001
Fig. 5
Fig. 5
TIL apoptosis is triggered by FasL. a Tumor-bearing TiRP mice were transferred with 107 activated TCRP1A CD8+ T cells treated with either control siRNA or Fas siRNA. Four days later, tumor tissues, draining lymph nodes and spleen were analyzed ex vivo by FACS for apoptosis of TCRP1A CD8+ T cells, using Annexin V (left) or pan-caspase marker FLICA (right) (n = 13 per group). b Fresh slices of induced TiRP tumors were incubated 24 h in vitro with TCRP1A CD8+ T cells treated with control or Fas siRNA. Apoptosis of TCRP1A CD8+ T cells was evaluated as in Fig. 3g (n = 5 mice/group; three sections analyzed per mouse). c Tumor-bearing TiRP mice transferred with 107 activated TCRP1A CD8+ T cells received daily injections of 150 µg soluble Fas-Fc starting 1 day before T-cell transfer. Four days later, tumor tissues, lymph nodes and spleen were analyzed ex vivo by FACS for apoptosis of P1A-specific CD8+ T cells, using Annexin V (left) or active pan-caspase marker FLICA (right). (n = 13 per group). d Fresh slices of induced TiRP tumors pre-incubated 4 h with soluble Fas-Fc (10 µg/ml) were incubated in vitro with TCRP1A CD8+ T cells and soluble Fas-Fc (10 µg/ml). Apoptosis was measured as in Fig. 3g (n = 5 mice/group; three sections analyzed per mouse). Unpaired t-test, two-tailed (a-d). Results are expressed as mean + s.e.m., *P < 0.05, **P < 0.01, ***P < 0.001. ****P < 0.0001In figure 5 the panel (i) is explained in the legend but not mentioned in the figure. Please check.We changed (a-i) to (a-d)
Fig. 6
Fig. 6
PMN-MDSC are enriched in induced Amela TiRP tumors. a Cellular analysis of the tumor tissue. Induced Amela tumors (n = 27) and transplanted T429.11 (n = 25) or T429.6 (n = 18) tumors (500 mm3) were homogenized and analyzed by FACS for the proportion of CD45+ cells (left panel) and MDSC of the polymorphonuclear type (PMN-MDSC: Gr-1h, CD11b+, Ly6C−/lo Ly6G+) or the monocytic type (M-MDSC: Gr-1lo/int, CD11b+, Ly6Ch and Ly6G-). b Same analysis as in Fig. 5a comparing pigmented (Mela, n = 16) and unpigmented (Amela, n = 16) induced TiRP tumors. c PMN-MDSC isolated from induced Amela TiRP tumors were co-cultured with activated TCRP1A CD8+ T cells for 3 days. CD8+ T-cell proliferation was evaluated by measuring 3H-thymidine incorporation. Two independent experiments, in triplicates. d PMN-MDSCs isolated from induced Amela TiRP tumors were co-cultured for 3 days with activated TCRP1A CD8+ T cells. CD8+ T cells were then isolated and their ability to kill P1A-positive P815 cells (clone P511) was evaluated in a standard chromium release assay. Two independent experiments, in triplicates. e Melanoma cells T429.11 were mixed with PMN-MDSC isolated from induced Amela TiRP tumors at a 4/1 ratio and injected into the left flank of B10.D2;Ink4a/Arfflox/flox mice. The right flank of the mice received the tumor cells without MDSC. ACT was performed when the left tumor size reached around 500 mm3 (n = 8). f and g Expression of cytokines and chemokines potentially involved in MDSC recruitment was analyzed by quantitative RT-PCR analysis in tumor tissues from induced Amela TiRP tumors (n = 19) and from transplanted T429.11 tumors (n = 14). Gapdh was used as an endogenous control to normalize each sample. Results are expressed as mean ± s.e.m. Unpaired t-test, two-tailed a, b, f, g. Two-way ANOVA e. *P < 0.05, **P < 0.01, ***P < 0.001. ****P < 0.0001
Fig. 7
Fig. 7
PMN-MDSC induce CD8+ T-cell apoptosis through Fas-ligand. a FasL expression was analyzed by FACS on cell homogenates from two representative induced Amela TiRP tumors, having received ACT or not 4 days earlier. Top panel: whole cell population. Second panel: MDSC (Gr1+ CD11b+). Third panel: Endothelial cells (CD31+). Fourth panel: Tumor cells (P1A+, CD45-). Fifth panel: Other cells (Gr1, CD11b, CD31, P1A). Sixth panel: isotype control. b Mean fluorescence intensity (MFI) of FasL expression of indicated cells obtained as in Fig. 6a (induced tumor with ACT: n = 12; induced tumor without ACT: n = 12). c Comparison of mean fluorescence intensity (MFI) of FasL expression by M-MDSC and PMN-MDSC (induced tumors without ACT: n = 8). d Apoptosis of activated TCRP1A CD8+ T cells upon co-incubation for 24 h at the indicated ratio with PMN-MDSC isolated from induced Amela TiRP tumors. Purity of PMN-MDSC cells: 80–90%. Five independent experiments, each in duplicate. e Apoptosis of activated TCRP1A CD8+ T cells was prevented by adding soluble Fas-Fc (10 µg/ml) to PMN-MDSC 1 h before and during the 24 h co-incubation with activated TCRP1A CD8+ T cells. Three independent experiments, each in duplicate. f Ex vivo analysis of apoptosis of TCRP1A CD8+ T cells in induced Amela TiRP tumors 4 days after adoptive transfer, in mice that were depleted of Ly6Gh cells by intra-tumoral injection of anti-Ly6G antibody (n = 42) or isotype control (n = 33) (3 injections of 200 µg every 3 days, starting 4 days before adoptive transfer). The right panel shows the efficiency of depletion in the same mice. Results are expressed as mean + s.e.m. Unpaired t-test, two-tailed be. *P < 0.05, **P < 0.01, ***P < 0.001. ****P < 0.0001
Fig. 8
Fig. 8
FasL neutralization increases the efficacy of immunotherapy. a, b Mice bearing Amela TiRP tumors received i.p. injections of soluble Fas-Fc and/or anti-Ly6G antibody, starting when tumor size reached 500 mm3, and repeated twice a week. ACT was applied 3 days after the first injection, and tumor volume was monitored (Mean ± s.e.m, n = 10 mice/group). c Mice treated as in (a, b) received anti-CTLA4 and anti-PD1 antibodies i.p. 1 day after the first injection of Fas-Fc/anti-Ly6G, and then twice a week for a total of four injections (Mean ± s.e.m; isotype: n = 10; CTLA4/PD1: n = 9; CTLA4/PD1/Ly6G/Fas-Fc: n = 10; this experiment was run together with the one described in (a, b) and the isotype control group is identical). d Mice bearing transplanted melanomas T429.11 received i.p. injections of anti-Ly6G and/or Fas-Fc starting when tumors became palpable, and repeated twice a week. 1 day later they received i.p. injections of anti-CTLA4 and anti-PD1, repeated twice a week for a total of four injections (Mean ± s.e.m; isotype: n = 7; CTLA4/PD1: n = 7; CTLA4/PD1/Fas-Fc: n = 10, CTLA4/PD1/Ly6G/Fas-Fc: n = 10; data pooled from two independent experiments). Depletion of Ly6G+ cells in tumors was checked after killing ad. Two-way ANOVA ad, *P < 0.05, **P < 0.01, ***P < 0.001, ****P < 0.0001
Fig. 9
Fig. 9
Correlation between Fas-ligand expression in human tumors and patient survival. Survival curves of patients with: a cutaneous melanoma, b head-and-neck squamous cell carcinoma, breast carcinoma, renal cell carcinoma and e uveal melanoma, according to high (red line) and low (blue line) tumoral expression of the FASLG gene. Leaning bars indicate censored cases. The survival curves of the two groups were compared using Cox proportional hazard regression. Only the tumor types with significant survival difference are shown. f Correlation between FASLG and IFNG transcript levels in the TCGA melanoma samples (n = 469). Each dot represents a tumor sample. X and Y values indicate RPKM-normalized transcript numbers. Pearson’s coefficient of correlation (R) is shown

Comment in

Similar articles

Cited by

References

    1. Coulie PG, Van den Eynde BJ, van der Bruggen P, Boon T. Tumour antigens recognized by T lymphocytes: at the core of cancer immunotherapy. Nat. Rev. Cancer. 2014;14:135–146. doi: 10.1038/nrc3670. - DOI - PubMed
    1. Huijbers IJ, et al. An inducible mouse model of melanoma expressing a defined tumor antigen. Cancer Res. 2006;66:3278–3286. doi: 10.1158/0008-5472.CAN-05-3216. - DOI - PubMed
    1. Wehbe M, et al. Epithelial-mesenchymal-transition-like and TGFbeta pathways associated with autochthonous inflammatory melanoma development in mice. PLoS ONE. 2012;7:e49419. doi: 10.1371/journal.pone.0049419. - DOI - PMC - PubMed
    1. Soudja SM, et al. Tumor-initiated inflammation overrides protective adaptive immunity in an induced melanoma model in mice. Cancer Res. 2010;70:3515–3525. doi: 10.1158/0008-5472.CAN-09-4354. - DOI - PubMed
    1. Hugo W, et al. Genomic and transcriptomic features of response to anti-PD-1 therapy in metastatic melanoma. Cell. 2016;165:35–44. doi: 10.1016/j.cell.2016.02.065. - DOI - PMC - PubMed

Publication types

MeSH terms