. 2017 Nov 10;8(1):1405.
doi: 10.1038/s41467-017-01004-6.

Supramammillary glutamate neurons are a key node of the arousal system

Affiliations

Supramammillary glutamate neurons are a key node of the arousal system

Nigel P Pedersen et al. Nat Commun. .

Abstract

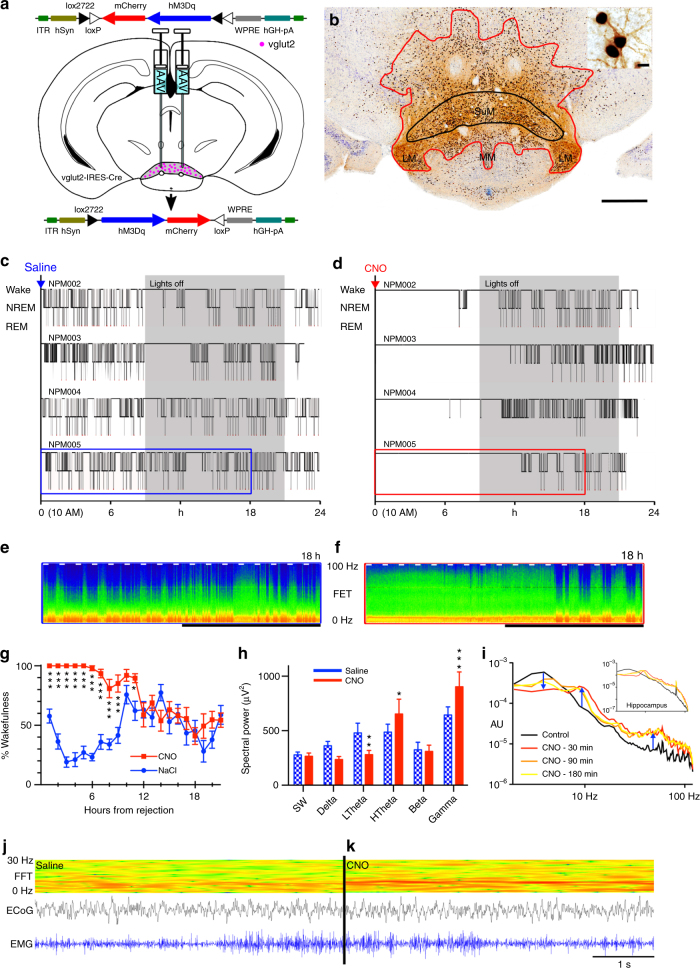
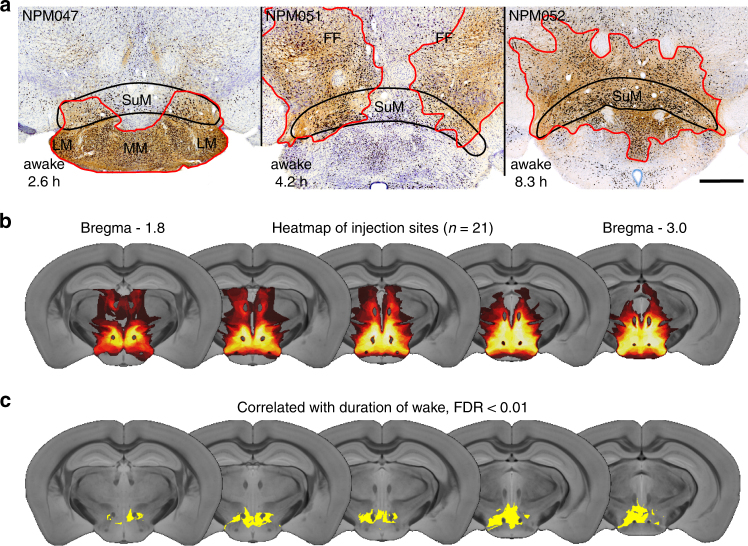
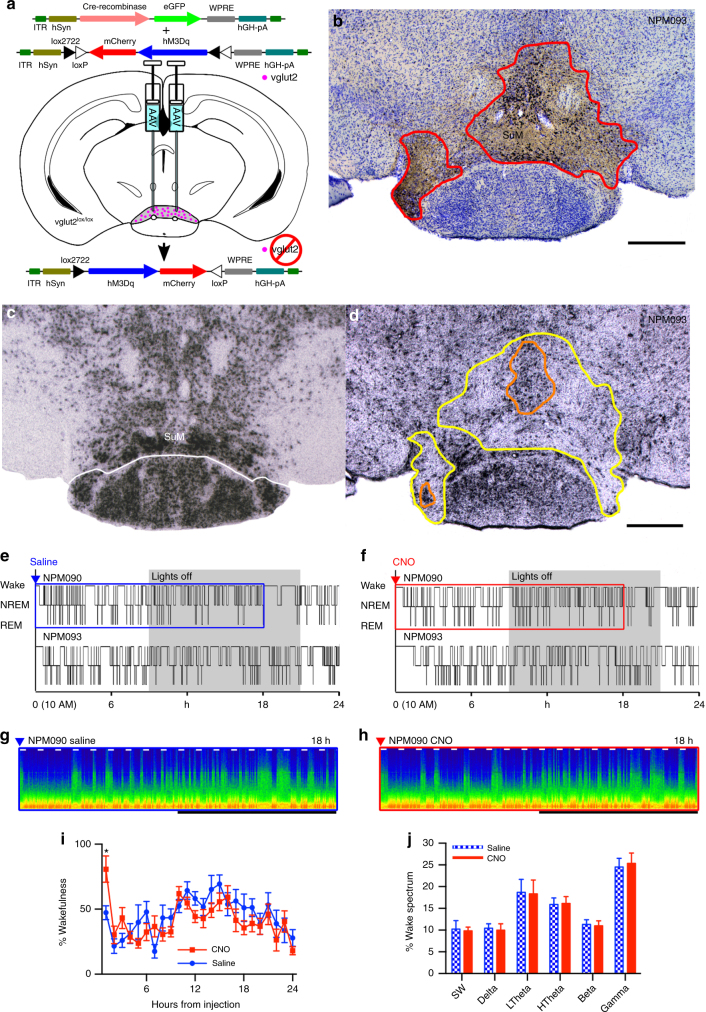
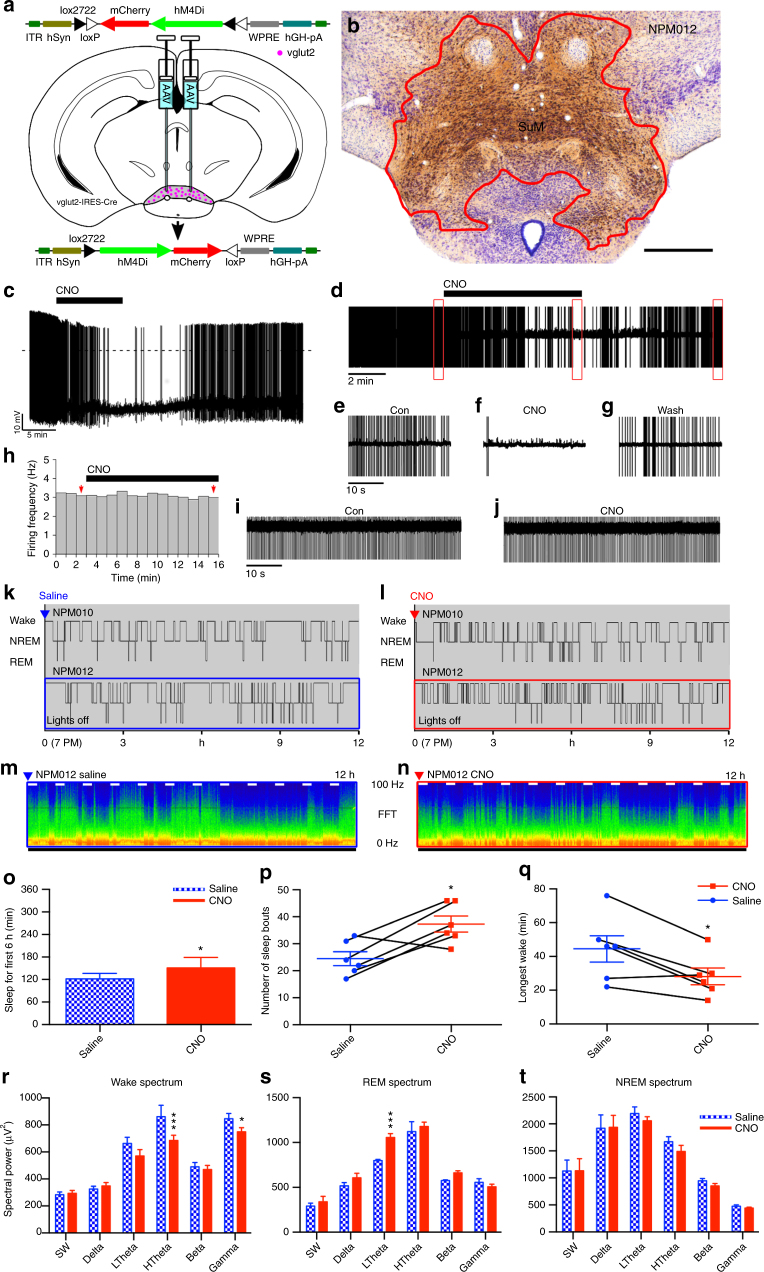
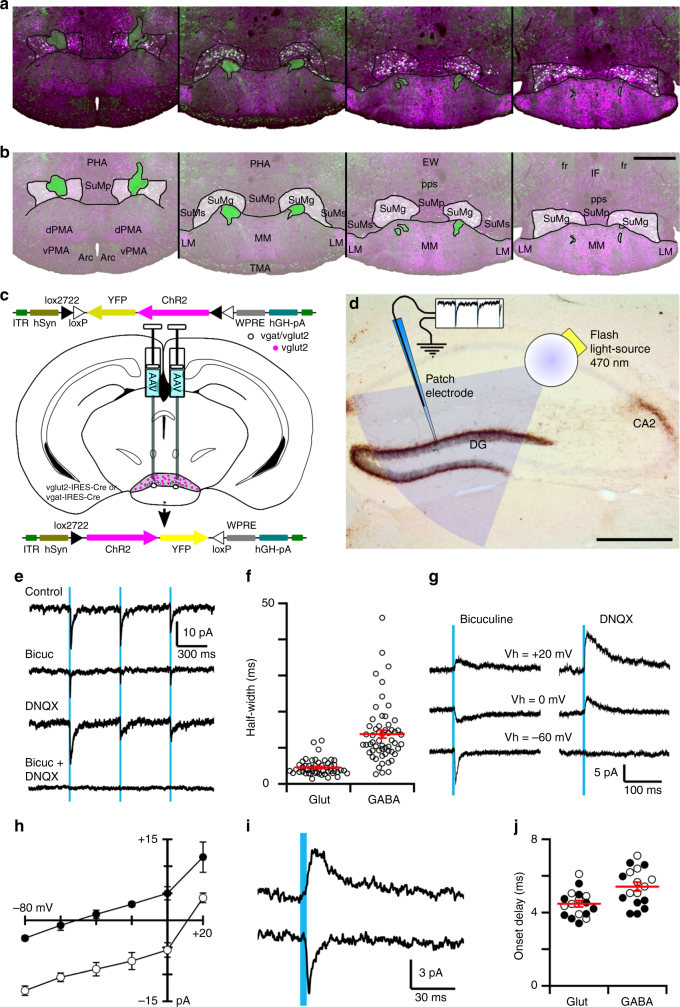
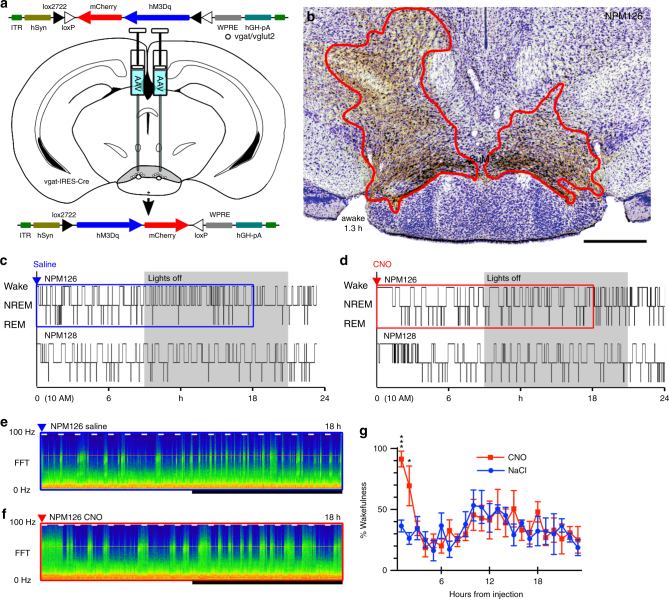
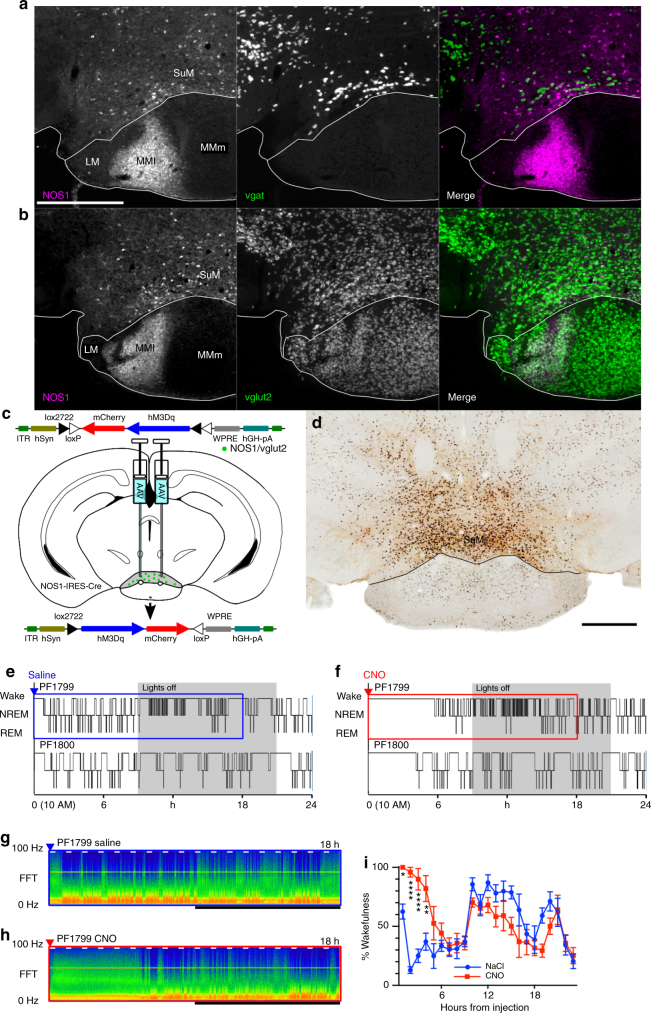
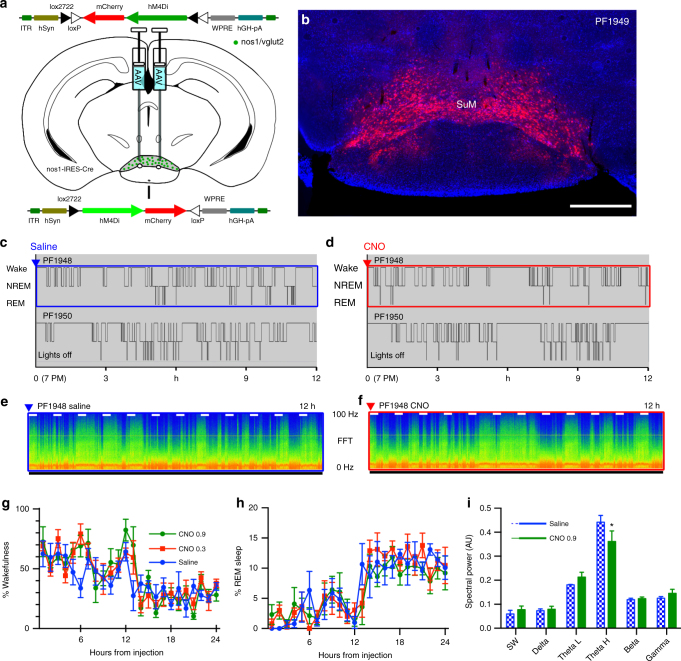
Basic and clinical observations suggest that the caudal hypothalamus comprises a key node of the ascending arousal system, but the cell types underlying this are not fully understood. Here we report that glutamate-releasing neurons of the supramammillary region (SuMvglut2) produce sustained behavioral and EEG arousal when chemogenetically activated. This effect is nearly abolished following selective genetic disruption of glutamate release from SuMvglut2 neurons. Inhibition of SuMvglut2 neurons decreases and fragments wake, also suppressing theta and gamma frequency EEG activity. SuMvglut2 neurons include a subpopulation containing both glutamate and GABA (SuMvgat/vglut2) and another also expressing nitric oxide synthase (SuMNos1/Vglut2). Activation of SuMvgat/vglut2 neurons produces minimal wake and optogenetic stimulation of SuMvgat/vglut2 terminals elicits monosynaptic release of both glutamate and GABA onto dentate granule cells. Activation of SuMNos1/Vglut2 neurons potently drives wakefulness, whereas inhibition reduces REM sleep theta activity. These results identify SuMvglut2 neurons as a key node of the wake-sleep regulatory system.


Conflict of interest statement

The authors declare no competing financial interests.

Figures

Fig. 1
Fig. 1
Caudal hypothalamic activation potently drives wakefulness. a Cartoon showing AAV-FLEX-hM3Dq-mCherry virus recombining in vglut2 neurons in the presence of Cre. b Example injection site showing diaminobenzadine (DAB) labeling of mCherry (red−brown staining, red outline) and nickel/cobalt enhanced DAB (black) labeling of cFos in nuclei (see also inset, scale bar 10 µm) of neurons activated by CNO (main panel scale bar 500 µm, SuM shown in black outline). c, d Hypnograms after vehicle and CNO showing prolonged wakefulness after activation of glutamate neurons (W–wake, N–NREM sleep, R–REM sleep; gray = dark period). e, f Compressed spectral array (CSA) based on fast Fourier transform (FFT) after vehicle and CNO (0–100 Hz, black bar shows the dark period, short white bars represent 20 min and are spaced 1 h apart; time periods in blue and red boxes for NPM005 in c and d are shown in e and f), with prominent theta activity after CNO. g Group data (mean ± SEM) showing significantly higher wakefulness for nine hours after CNO (2-way repeated measures ANOVA for treatment p < 0.0001, Bonferroni ***p < 0.001; *p < 0.05). h Waking EEG (mean ± SEM) shows increased high theta (HTheta, 7−13 Hz, p = 0.0148), gamma (30−120 Hz, p = 0.0005), and decreased low theta component of the FFT power spectrum (LTheta, 4−7 Hz, p = 0.0027). i Cortical and hippocampal (inset) EEG FFT spectra (log frequency, arbitrary units (AU)) showing prominent hippocampal  ~ 9 Hz activity. j Raw wake EEG and EMG data with CSA (0−30 Hz) over 5 s for vehicle, and k. CNO, with prominent 9−10 Hz activity visible in the CSA in the latter case
Fig. 2
Fig. 2
Wake-promoting neurons are within the SuM region. a Smaller injection sites (red outline) showing prolonged wakefulness (hours of wake after CNO at bottom left of each panel) was highest with involvement of the whole SuM (scale bar 500 µm). b Plot of all injection sites as a ‘heat map’ of injection overlap (n = 21, dark red minimal overlap (1 case), white maximal (18 cases)). c Non-parametric permutation analysis shows that the area of transduction correlated with the longest duration of wakefulness after CNO is the caudal hypothalamus, most notably the SuM (yellow area false discovery rate < 0.01). MM–medial mammillary, LM–lateral mammillary, and FF–fields of Forel
Fig. 3
Fig. 3
Wake-promotion after SuM activation depends on glutamate. a Cartoon showing that after co-injection of AAV-FLEX-hM3Dq-mCherry and AAV-Cre in a vglut2flox mouse, that vglut2 is disrupted in neurons expressing Cre, with Cre positive neurons also able to drive hM3Dq expression. Thus, the only neurons activated by CNO are neurons that lack glutamate release. b mCherry-like immunoreactivity and cFos expression after CNO administration (left) showing where hM3Dq was transduced, and cFos expression consistent with cellular activation after CNO. c Normal expression of vglut2, revealed by in situ hybridization, and d in situ hybridization showing the loss of vglut2-expression in the injection site in the same mouse shown in b (area with near-complete signal loss shown in yellow, area with deletion in some neurons is outlined in orange). e, f Hypnograms of two mice showing marked attenuation of wake-promoting effects of SuM activation, consistent with substantial dependence on glutamate release. g, h CSA showing the effect of vehicle and the near-absent effect of activation with CNO in the period shown by the blue and red boxes in c and d, respectively (0−100 Hz, black bar shows the dark period, short white bars represent 20 min and are spaced 1 h apart). i Pooled data (mean ± SEM in 1 h bins, n = 6) after saline and CNO administration, with post hoc comparisons showing that more of only the first hour is spent awake after CNO (Bonferroni corrected comparison for 1 h p = 0.0153, all other hours p > 0.99). j Spectral changes associated with SuM activation are also abolished (wake from 6 h after injection shown, mean ± SEM, n = 6)
Fig. 4
Fig. 4
Inhibition of the SuM results in somnolence and wake fragmentation. a Cartoon showing AAV-FLEX-hM4Di-mCherry recombining in vglut2 neurons that express Cre. b Conditional transduction of inhibitory hM4Di in vglut2-IRES-Cre mice (red−brown staining outlined in red; scale bar 500 µm). cg CNO (5 µM) inhibits the firing of SuMvglut2 neurons that express hM4Di-mCherry (c current-clamp recordings; d cell attached recordings; eg expanded traces of the outlined region from d, show firing in control, during CNO application and in washout). hj CNO (5 µM) has no effect on the firing of SuMvglut2 neurons that only express mCherry (h; firing frequency, 1-min bin, red arrows indicate the 1-min bins represented in i, j; i, j cell attached recordings of the neuron in h). k, l Hypnograms from two mice over 12 h after vehicle and CNO, showing increased sleep and fragmentation of sleep and wakefulness after inhibition of the SuM. m, n CSA after vehicle and CNO from the periods shown by the blue and red boxes, respectively, in c and d (0−100 Hz, black bar shows the dark period, short white bars represent 20 min and are spaced 1 h apart). o There is increased overall NREM sleep in the 6 h after CNO administration (~20%; 2-way ANOVA for 6-hourly bins between vehicle and CNO, graph with mean ± SEM, p = 0.0199), p wake-sleep fragmentation with an increase in sleep bouts over the 6 h after CNO when compared with vehicle (paired t-test, mean ± SEM, p = 0.0194). q The length of the longest episode of wakefulness in the same time period was also significantly reduced (paired t-test, mean ± SEM, p = 0.0152). r Power spectrum (band mean ± SEM) with a significant suppression of waking high theta activity (2-way repeated measures ANOVA, Bonferroni ***p < 0.0001) and gamma activity (*p = 0.0472), and s an unexpected increase in low theta power during REM sleep (***p < 0.0001), with t no change in the NREM spectrum
Fig. 5
Fig. 5
SuM GABA/glutamate co-releasing neurons. a In situ hybridization for vglut2 (magenta) in a vgat-IRES-Cre/L10 reporter mouse (green, see Methods section) reveals vglut2/vgat co-expression (white). b These neurons constitute a subpopulation of the larger neurons of the grandicellular SuM (partially opaque). c Cartoon showing AAVx-FLEX-ChR2-mCherry recombining in the presence of Cre in either vglut2-Cre or vgat-Cre mice. d Cartoon of optogenetically evoked stimulation of SuM terminals on dentate gyrus grandule cells, superimposed on a histological image showing dense anterograde labeling (AAV-FLEX-GFP in vgat-Cre mouse) of SuM terminals in the dentate gyrus supragranular layer and CA2 (dark brown) with a light Nissl counterstain (faint blue−purple; scale bar 500 µm). e Representative brain-slice voltage-clamp recording a dentate gyrus granule cell during photostimulation of SuMvgat terminals expressing ChR2-YFP in vgat-IRES-Cre mice (Vh = −70 mV; KCl-based pipette solution; three 5 ms light pulses: blue bars). Photo-evoked postsynaptic currents (average of 30 trials) recorded in control ACSF (Con), in bicuculline-methiodide (Bic, 10 µM), in DNQX (20 nM) and DNQX + Bic. f Half-width of GABA-A-mediated and AMPA-mediated photo-evoked postsynaptic currents (30 trials, 3 neurons; mean ± SEM in red; p < 0.001unpaired t-test). g Photo-evoked (SuMVgat → DG) GABA-A-mediated (left) and AMPA-mediated (right) postsynaptic currents recorded at different membrane potential (Cs-based pipette solutions) and h. IV curves of the GABAA- (black circle) and AMPA- (white circle) postsynaptic currents (mean ± SEM, n = 4). i GABAA- (top trace) and AMPA- (bottom trace) postsynaptic currents evoked by photostimulation of SuMVglut2 → DG input in vglut2-IRES-Cre mice. j Onset delay of GABAA- and AMPA-mediated postsynaptic currents (black circle: vgat-IRES-Cre mice and white circle: vglut2-IRES-Cre mice; mean ± SEM in red; p = 0.002 paired t-test)
Fig. 6
Fig. 6
Activation of SuMvgat neurons results in brief wakefulness. a Cartoon showing AAVx-FLEX-hM3Dq-mCherry recombining in vgat neurons that express Cre. b An example injection site showing hM3Dq transduction (red outline) in the region containing GABA-glutamate neurons in the SuMg (lower left—duration of wakefulness after CNO in this mouse, scale bar 500 µm). c, d Hypnograms showing sleep−wake in two mice with saline, then CNO, with a transient increase in wakefulness. e, f Example CSA’s corresponding to the periods shown by the blue and red boxes in c and d, respectively (0−100 Hz, black bar shows the dark period, short white bars represent 20 min and are spaced 1 h apart)
Fig. 7
Fig. 7
Activation of SuMNos1 neurons promotes wakefulness. a NOS1 immunohistochemisty (left, white scale bar 500 µm applies to all panels of a and b) reveals a subpoplulation of SuM neurons that only rarely contain vgat, shown as gray-white neurons on the merged image (right). b NOS1 immunohistochemistry (left) in a vglut-Cre L10 reported mouse (center) showing that NOS1 neurons are a subset of vglut2 neurons, with no examples of neurons with NOS immoreactivity that were not vglut2 positive (right, merge). c Cartoon showing AAVx-FLEX-hM3Dq-mCherry recombining in NOS1 Cre expressing neurons. d Injection site showing DAB reaction product in neurons positive for mCherry, with black nuclear reaction product in cFos positive neurons after CNO injection (black scale bar, bottom right, 500 µm). e, f Hypnograms from two mice after vehicle and CNO, shows a strong effect of NOS1 cellular activation on wakefulness, with g, h the CSA (0−100 Hz, black bar shows the dark period, short white bars represent 20 min and are spaced 1 h apart) from the areas shown in e and f by the blue and red boxes, respectively. i Pooled data from seven mice showing the percentage of wakefulness in 1 h bins after injection (****p < 0.0001, **p = 0.0023, *p = 0.0248)
Fig. 8
Fig. 8
Inhibition of SuMNos1 does not cause somnolence, but reduces REM theta activity. a Cartoon showing AAV-FLEX-hM4Di-mCherry recombining in Nos1 neurons that express Cre. b Conditional transduction of inhibitory hM4Di in Nos1-IRES-Cre mice (mCherry fluorescence with DAPI counterstain; scale bar 500 µm). c, d Hypnograms from two mice over 12 h after vehicle and CNO 0.9 mg/kg injected at ZT12 (7 PM, lights-off). Unlike inhibition of all glutamate neurons (Fig. 4), the hypnograms appeared similar regardless of treatment. e, f CSA after vehicle and CNO from the periods shown by the blue and red boxes, respectively, in c and d (0−100 Hz, black bar shows the dark period, short white bars represent 20 min and are spaced 1 h apart). g, h There is no change in the amount of wakefulness, NREM or REM sleep (separate two-way ANOVA, wake, REM, and NREM: F (2, 192) = 1.709, 0.8381, 2.04; p = 0.1837, 0.4341, 0.1329, respectively, n = 5). i Power spectra (band mean ± SEM) were only changed for REM sleep in post hoc comparisons, with a significant suppression of waking high theta activity (Bonferroni *p = 0.0332, all other bands p > 0.9999, n = 3, t = 3.048, df = 24)

Similar articles

Cited by

References

    1. Economo VonC. Sleep as a problem of localization. J. Nerv. Ment. Dis. 1930;71:249–259. doi: 10.1097/00005053-193003000-00001. - DOI
    1. Ranson SW. Somnolence after hypothalamic lesions in monkeys. Arch. Neurol. Psychiatry. 1939;41:1–23. doi: 10.1001/archneurpsyc.1939.02270130011001. - DOI
    1. Moruzzi G, Magoun HW. Brain stem reticular formation and activation of the EEG. Electroencephalogr. Clin. Neurophysiol. 1949;1:455–473. doi: 10.1016/0013-4694(49)90219-9. - DOI - PubMed
    1. Starzl TE, Taylor CW, Magoun HW. Ascending conduction in reticular activating system, with special reference to the diencephalon. J. Neurophysiol. 1951;14:461–477. - PMC - PubMed
    1. Nauta WJH. Hypothalamic regulation of sleep in rats; an experimental study. J. Neurophysiol. 1946;9:285–316. - PubMed

Publication types

MeSH terms

Substances