Observational Study
. 2017 Nov 10;8(1):1409.
doi: 10.1038/s41467-017-00532-5.

Airway surface liquid pH is not acidic in children with cystic fibrosis

Affiliations
Observational Study

Airway surface liquid pH is not acidic in children with cystic fibrosis

André Schultz et al. Nat Commun. .

Abstract

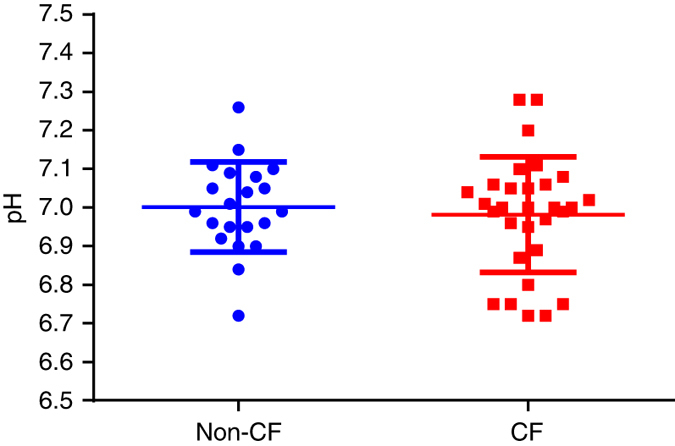
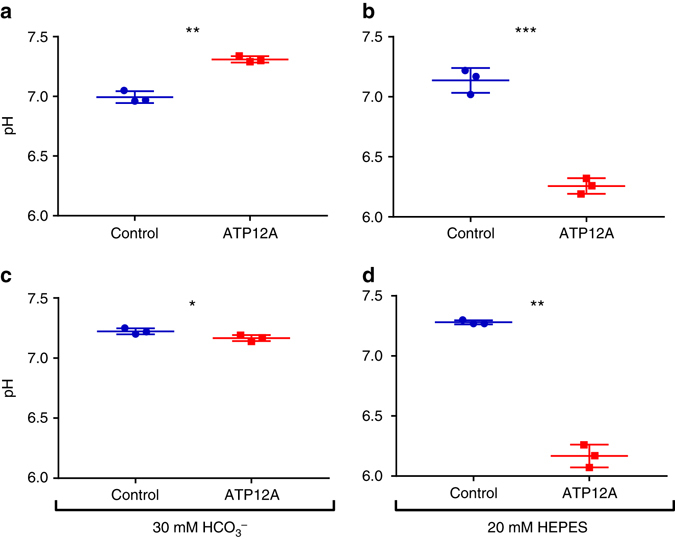
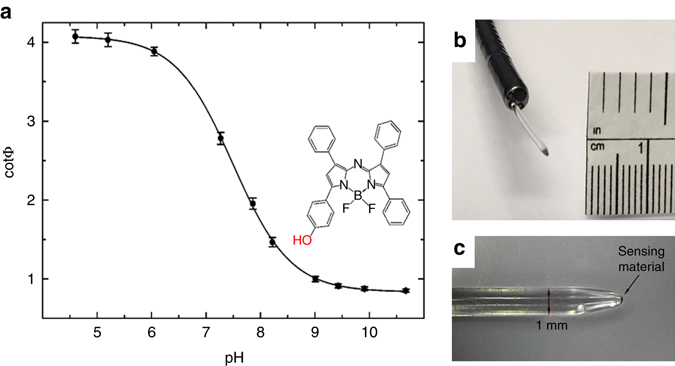
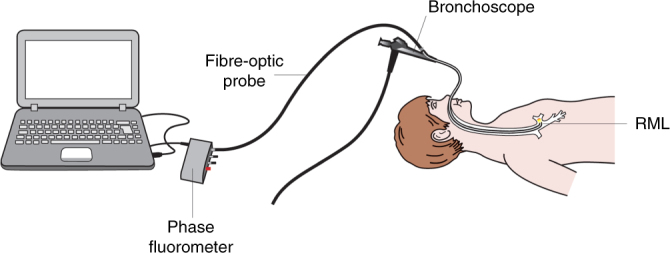
Modulation of airway surface liquid (ASL) pH has been proposed as a therapy for cystic fibrosis (CF). However, evidence that ASL pH is reduced in CF is limited and conflicting. The technical challenges associated with measuring ASL pH in vivo have precluded accurate measurements in humans. In order to address this deficiency, ASL pH was measured in vivo in children using a novel luminescent technology integrated with fibre-optic probes. Here we show that ASL pH in children with CF is similar to that of children without CF. Findings were supported by highly controlled direct pH measurements in primary human airway epithelial cell culture models, which also suggest that the potential ASL pH gradient produced by defective apical ion transport is balanced out by paracellular shunting of acid/base. Thus, reduced baseline ASL pH is unlikely to be an important pathobiological factor in early CF lung disease.


Conflict of interest statement

The authors declare no competing financial interests.

Figures

Fig. 1
Fig. 1
No difference in airway surface liquid pH between children with and without CF. A single pH value was obtained for each individual patient where the mean ± s.d. for non-CF (n = 21) and CF (n = 30) groups was 7.00 ± 0.12 and 6.98 ± 0.15, respectively. Two-sided t-test demonstrated no significant difference between groups (p = 0.62). Individual measurements and averaged data are presented as mean ± s.d.
Fig. 2
Fig. 2
Airway surface liquid pH and inflammatory markers in bronchoalveolar lavage fluid (BALF). a No relationship between airway surface liquid pH and total cell count in children with CF (n = 29; p = 0.83). However, a significant inverse relationship between airway surface liquid pH and total cell count was observed in the non-CF group (n = 16; p = 0.01). b No relationship between airway surface liquid pH and neutrophil count for children with (n = 24; p = 0.53) or without CF (n = 16; p = 0.83). c A significant relationship between airway surface liquid pH and macrophage count was demonstrated in the non-CF group (n = 16; p = 0.04) but was not observed in the CF group (n = 24; p = 0.18). d There was no correlation between interleukin-8 (IL-8) levels and airway surface liquid pH for the CF (n = 29; p = 0.90) or the non-CF group (n = 16; p = 0.43). For all panels, BALF analysed for inflammatory markers was sampled from the lung lobe corresponding to the airway surface liquid pH measurement. A single pH value was obtained for each individual patient while a single aliquot of BALF was used to measure inflammatory markers. Spearman’s rank correlation test was used for all statistical analyses
Fig. 3
Fig. 3
Airway surface liquid pH and infection. a Using a two-sided t-test to determine statistical significance, there was no difference in airway surface liquid pH between patients who had a positive microbiological bronchoalveolar lavage fluid (BALF) culture result (n = 12) compared to patients with a negative culture result (n = 9) in the non-CF group (p = 0.59). Mean ± s.d. of airway surface liquid pH was 7.01 ± 0.09 and 6.98 ± 0.15, respectively. Data presented as individual measurements and mean ± s.d. b A two-sided Mann–Whitney U-test demonstrated that there was no difference in airway surface liquid pH between patients who had a positive culture result (n = 7) compared to those with a negative culture result (n = 23) in the CF group. Median (range) of airway surface liquid pH was 6.89 (6.72–7.08) and 7.00 (6.72–7.28), respectively. Data presented as individual measurements and median (range). For all data points, BALF was sampled from the lung lobe corresponding to the airway surface liquid pH measurement. A single pH value was obtained for each individual patient
Fig. 4
Fig. 4
Airway surface liquid pH in airway epithelial cells cultures. a No difference (p > 0.99) in ASL pH between CF (n = 5) and non-CF (n = 5) epithelial cell cultures measured using fibre-optic probes. The Mann–Whitney U-test was used for statistical analysis. Bars represent median (range). Each of the points represents a different patient (genotypes of CF cultures described in Supplementary Fig. 8). b No difference (p = 0.12) in ASL pH between CF (n = 15) and non-CF (n = 12) primary bronchial airway epithelial cell cultures using a conventional (potentiometric sensor) micro-pH probe was found using an unpaired t-test. Each of the points represents a different patient (cells harvested from excised CF lung transplant recipient lungs). Bars represent mean ± s.d.
Fig. 5
Fig. 5
Airway surface liquid pH in ATP12A-overexpressing cells. ASL pH measurements were performed using a microsensor pH electrode in thin-film, unperturbed ASL. Two independent cell models (a, b) primary human airway epithelial cells and (c, d) Calu-3 cells were transfected to overexpress ATP12A or empty vector (control cells). a In primary human airway epithelial cells with serosal 30 mM HCO3, ASL pH was increased by ~0.31 pH units in ATP12A-overexpressing cells compared to vector controls (n = 3; p < 0.01). Hence, in the presence of serosal HCO3, overexpressing of ATP12A did not result in ASL acidification. b In primary human airway epithelial cells with serosal 20 mM HEPES, ASL pH of ATP12A-overexpressing cells was markedly reduced (~0.88 pH units) compared to vector controls (n = 3; p < 0.01). c In Calu-3 cells with serosal 30 mM HCO3, ASL pH was slightly reduced (~0.06 pH units) in ATP12A-overexpressing cells compared to vector controls (n = 3; p = 0.04). d In Calu-3 cells with serosal 20 mM HEPES, ASL pH was markedly reduced (~1.11 pH units) in ATP12A-overexpressing Calu-3 cells compared to vector control cells (n = 3; p < 0.01). All statistical analyses were performed using unpaired t-tests. Data represented as mean ± s.d.; *p < 0.05; **p < 0.01; ***p < 0.001
Fig. 6
Fig. 6
Fibre-optic pH probes. a Calibration curves obtained from measurements of three individual sensors at 37 °C and chemical structure of the pH indicator (BF2-chelated hydroxy-tetraarylazadipyrromethane). b Photograph of the tip of the pH probe protruding from the working channel of a bronchoscope. c Photograph of the plastic optical fibre
Fig. 7
Fig. 7
Schematic representation of in vivo transbronchoscopic airway surface pH measurements. RML right middle lobe bronchus

References

    1. Farrell PM. The prevalence of cystic fibrosis in the European Union. J. Cyst. Fibros. 2008;7:450–1. doi: 10.1016/j.jcf.2008.03.007. - DOI - PubMed
    1. Cystic Fibrosis Foundation. https://www.cff.org. 2017.
    1. Cystic Fibrosis Canada. http://www.cysticfibrosis.ca/cf-care/cf-registry. 2017.
    1. Cystic Fibrosis Australia. http://www.cysticfibrosis.org.au. 2017.
    1. O’Sullivan BP, Freedman SD. Cystic fibrosis. Lancet. 2009;373:1891–1904. doi: 10.1016/S0140-6736(09)60327-5. - DOI - PubMed

Publication types

MeSH terms