. 2017 Nov 9;8(1):1373.
doi: 10.1038/s41467-017-01352-3.

Assessing the impact of imperfect adherence to artemether-lumefantrine on malaria treatment outcomes using within-host modelling

Affiliations

Assessing the impact of imperfect adherence to artemether-lumefantrine on malaria treatment outcomes using within-host modelling

Joseph D Challenger et al. Nat Commun. .

Abstract

Artemether-lumefantrine (AL) is the most widely-recommended treatment for uncomplicated Plasmodium falciparum malaria worldwide. Its safety and efficacy have been extensively demonstrated in clinical trials; however, its performance in routine health care settings, where adherence to drug treatment is unsupervised and therefore may be suboptimal, is less well characterised. Here we develop a within-host modelling framework for estimating the effects of sub-optimal adherence to AL treatment on clinical outcomes in malaria patients. Our model incorporates the data on the human immune response to the parasite, and AL's pharmacokinetic and pharmacodynamic properties. Utilising individual-level data of adherence to AL in 482 Tanzanian patients as input for our model predicted higher rates of treatment failure than were obtained when adherence was optimal (9% compared to 4%). Our model estimates that the impact of imperfect adherence was worst in children, highlighting the importance of advice to caregivers.


Conflict of interest statement

The authors declare no competing financial interests.

Figures

Fig. 1
Fig. 1
Simulated parasitaemia within individual patients. Here we show example model output for the parasite density (the number of parasitised red blood cells per µL) over time. Our within-host parasitaemia model was fitting to data from 35 malaria therapy patients, as described in the ‘Methods’ and Supplementary Methods section. a Untreated infections, where each different coloured line represents a different patient. These three model simulations were selected to demonstrate the variety of infection duration generated by the model. b Treated infections in 1000 simulated patients treated with six doses of AL, with the median parasitaemia at each two-day time point shown in black. Treatment fails in about 5% of cases (here coloured blue), causing patients to relapse
Fig. 2
Fig. 2
Details of treatment failure in our within-host model. Here we summarise simulated data generated from the proportion (about 5%) of 106 model runs for which treatment failed. a The estimated probability of parasitological treatment failure according to the lumefantrine concentration 7 days after treatment commenced. The proportion failing treatment was calculated from 106 model runs, grouping the results into bins of width 20 ng mL−1. The blue circles measure treatment failure as positive by microscopy on day 28: the orange triangles show results obtained when an additional follow-up is made on day 42. b The simulated cumulative probability distribution for the time to recrudesce (the time at which parasitaemia becomes detectable by microscopy after treatment failure) in our model. By day 28 (red vertical line), around 93% (black dashed line) of recrudescences are detectable. c Factors influencing treatment failure. The probability of treatment failure according to patient body weight. The vertical red lines indicate the four dosing groups, determining the number of pills per dose (one, two, three, or four). These results were generated by grouping patients into 2 kg-wide bins. The symbols are as described in a
Fig. 3
Fig. 3
Model-estimated parasitological treatment failure rates at 28 days after treatment with AL. Results for perfectly-adherent patients (6 doses) are compared with patients who did not complete treatment. The bar marked ‘5 doses’ denotes that only the first 5 doses were taken, ‘4 doses’ that only the first 4 were taken, and so on. In each case we performed simulations for three body-weight distributions. For each bar shown, results were obtained by simulating a cohort of 105 patients. Body-weight distribution 1, taken from clinical trials of AL in African children, was the distribution used when fitting the PD model (mean = 11.1 kg, SD 2.8). We compare the results obtained in that case with two older cohorts: distribution 2 (mean = 17.3 kg, SD = 6), and distribution 3 (mean = 30.0 kg, SD = 10.0). All distributions were Gaussian, truncated so that the minimum body weight was 5 kg
Fig. 4
Fig. 4
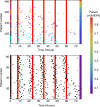
The time series data recorded by the smart blister packs in ref. . and model-estimated probability of parasitological treatment failure at day 28. Each row represents a patient, with each dose taken marked by a rectangle. Shorter rectangles indicate that the patient did not take the full dose. The rectangles are coloured to indicate the percentage of prescribed pills taken by the patient: all pills (black) between 80–99% (cyan), 60–79% (purple), 40–59% (orange), 20–39% (magenta), and <20% (brown). The vertical, red lines indicate the recommended timings of the six doses. For patients who took multiple pills per dose, we have grouped pills into doses if pills were taken within half an hour of each other. In this figure, patients are ordered by the probability that their adherence profile results in treatment failure, according to our within-host model. As the full cohort is large (482 patients), we show two subsets here: the 80 patients with the lowest failure probability (lower panel) and the 80 with the highest failure probability (upper panel). The probability of failing treatment was estimated from 104 simulations of the within-host model for each patient adherence profile. The body-weight data, which is needed to inform the PK model, were not available for this cohort, however, the dosing group (the number of pills per dose) is known. Therefore, when running our simulation model for each patient, we average over the weight range (e.g. 5–15 kg for the 1 pill per dose group) using a uniform probability distribution. Doses taken after 75 h are not shown here, but their effects are included in the model. The plot for all 482 patients is shown in Supplementary Fig. 4

Similar articles

Cited by

References

    1. Warrell, D.A. & Gilles H. M. (eds) in Essential Malariology 4th Edn, Ch 3, p. 1–7 (2002).
    1. World Health Organization. World Malaria Report 2016 (World Health Organization, Geneva, 2016).
    1. World Health Organization. Guidelines for the Treatment of Malaria 3rd edn, (World Health Organization, Geneva, 2015).
    1. Bhatt, S. et al. The effect of malaria control on plasmodium falciparum in Africa between 2000 and 2015. Nature526, 207–211 (2015). - PMC - PubMed
    1. Sinclair, D., Zani, B., Donegan, S., Olliaro, P. & Garner, P. Artemisinin-based combination therapy for treating uncomplicated malaria. Cochrane Database of Syst. Rev. CD007483 (2009). - PMC - PubMed

Publication types

MeSH terms