. 2017 Nov 9;7(1):15216.
doi: 10.1038/s41598-017-15152-8.

Genomic and epidemiological characterisation of a dengue virus outbreak among blood donors in Brazil

Collaborators, Affiliations

Genomic and epidemiological characterisation of a dengue virus outbreak among blood donors in Brazil

Nuno R Faria et al. Sci Rep. .

Abstract

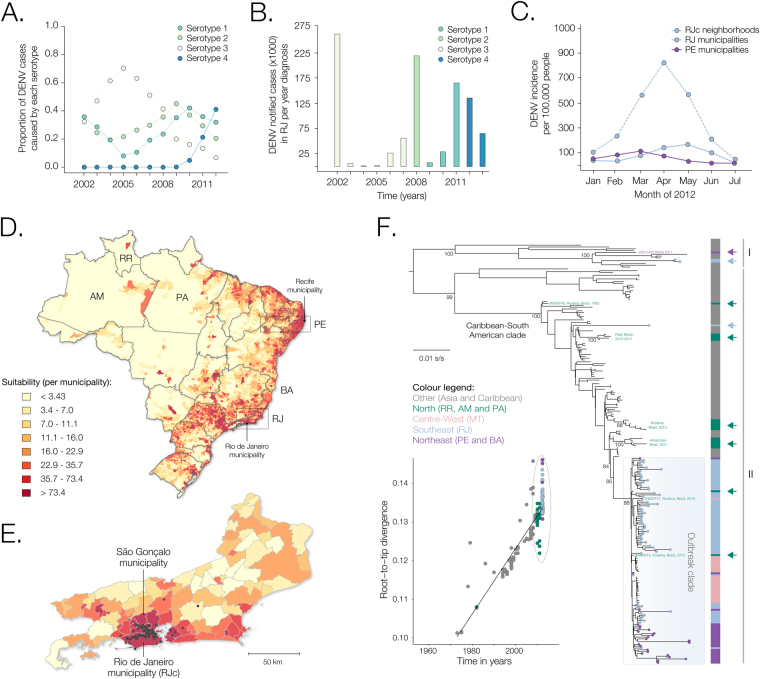
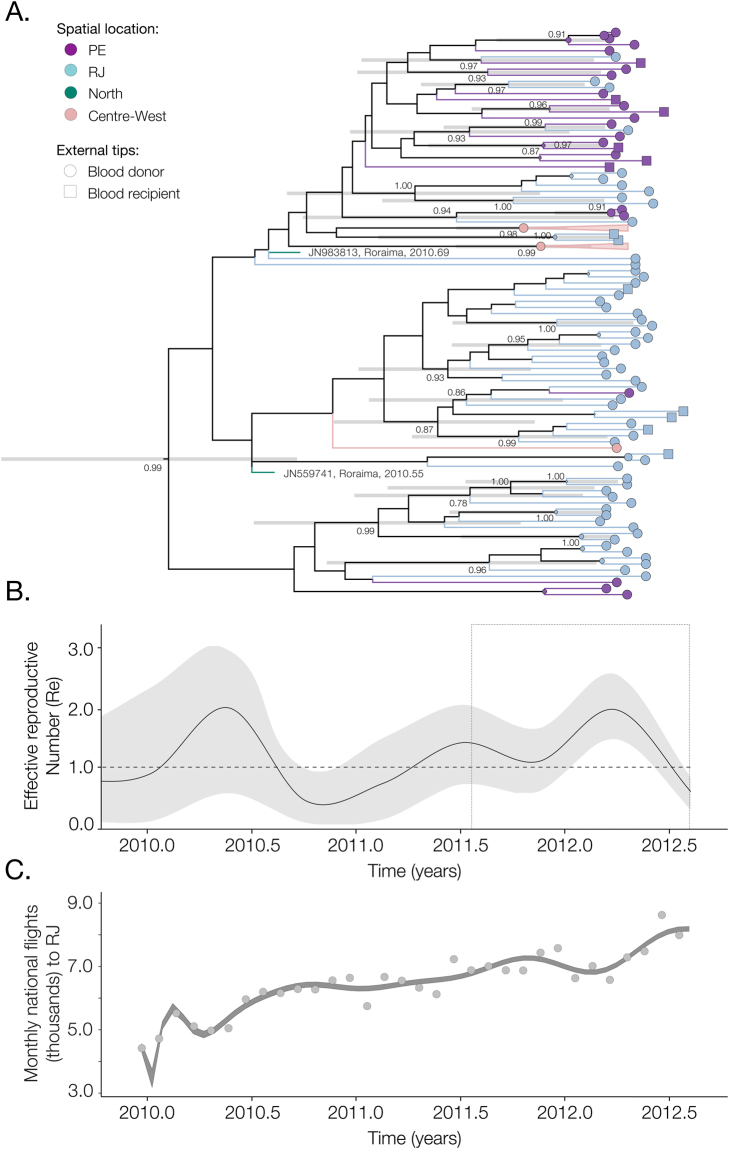
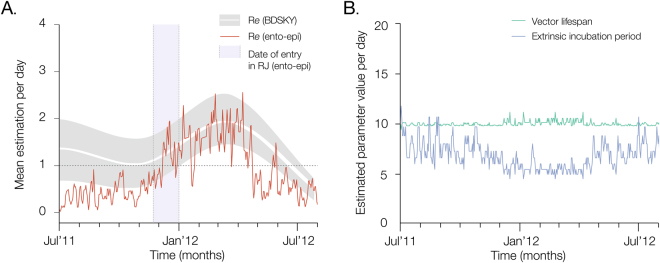
Outbreaks caused by Dengue, Zika and Chikungunya viruses can spread rapidly in immunologically naïve populations. By analysing 92 newly generated viral genome sequences from blood donors and recipients, we assess the dynamics of dengue virus serotype 4 during the 2012 outbreak in Rio de Janeiro. Phylogenetic analysis indicates that the outbreak was caused by genotype II, although two isolates of genotype I were also detected for the first time in Rio de Janeiro. Evolutionary analysis and modelling estimates are congruent, indicating a reproduction number above 1 between January and June, and at least two thirds of infections being unnoticed. Modelling analysis suggests that viral transmission started in early January, which is consistent with multiple introductions, most likely from the northern states of Brazil, and with an increase in within-country air travel to Rio de Janeiro. The combination of genetic and epidemiological data from blood donor banks may be useful to anticipate epidemic spread of arboviruses.


Conflict of interest statement

The authors declare that they have no competing interests.

Figures

Figure 1
Figure 1
Patterns of DENV4 transmission in Rio de Janeiro and Pernambuco, Brazil. (A) Proportion of annual dengue serotype-specific detections in Brazil obtained from SINAN reports. (B) Total number of dengue notified cases for each serotype in Rio de Janeiro (RJ) between 2002 and 2013. The same colour scheme was used in panels A and B. (C) Notified DENV incidence in RJ state, in RJ municipality/city (RJc) neighborhoods, and in Pernambuco (PE) municipalities, as obtained from SINAN reports. (D) Cartography of Brazil showing suitability for Aedes-borne viruses, i.e. presence of Ae. aegypti described in weighted by population density (aggregated per municipality) in each 5,596 Brazilian municipalities for the same year. Most suitable areas are located in northeastern and southeastern areas of the country. (E) Zoomed map of the RJ state where black circles indicate patient’s most likely place of infection (residence) (http://www.worldpop.org.uk/). (F) Mid-point rooted ML phylogenetic tree using 244 genome sequences from DENV4 sampled worldwide. Coloured circles at the tips of phylogenetic branches represent sequences reported in this study, and gave been coloured according to location of sampling (as shown on the left of the phylogeny). Sylvatic strains (Accession numbers: EF457906, JF262779 and JF262780, all from Malaysia) were removed for clarity. A fully annotated ML tree is show as Fig. S1, and the corresponding molecular clock tree is shown as Fig. S2. The blue box highlights the DENV4-II outbreak clade in Brazil studied here (see also Fig. 2). Green arrows on the right denote secondary introductions of DENV4 in the Northern region of Brazil (RR: Roraima, PA: Pará and AM: Amazonas states) that resulted in little or no onward transmission in the country. Blue and purple arrows denote, respectively, secondary introductions of non-outbreak strains in RJ and PE. Colour code for the bars right-sided to the phylogeny is shown on the left of the phylogeny. Numbers below key nodes indicate bootstrap support. Left to the tree, a linear regression analysis between divergence and sampling times for the global tree depicted in panel F is shown. Maps were created using the ggplot2 package in “R version 3.3.3”.
Figure 2
Figure 2
Seasonal dynamics of the 2012 DENV4 outbreak in Brazil. (A) Time-calibrated phylogenetic tree of the outbreak clade. This represents a subset of the global phylogenetic tree shown in Fig. 1. Circles and squares at the external branches represent isolates from donors and recipients respectively, and colours represent cohort locations. Horizontal bars represent the 95% credible intervals of all divergences that are supported by posterior probabilities above 0.9. (B) Temporal fluctuation of the effective reproduction number (Re) of the outbreak clade estimated using the Bayesian birth-death approach (see details in Materials and Methods). (C) Polynomial fitting of the aggregated number of passengers arriving on national flights (dark grey points) to RJ between January 2010 and July 2012.
Figure 3
Figure 3
Epidemiological and entomological dynamics of a dengue virus outbreak. (A) The red solid line corresponds to daily R e estimates obtained using the ento-epidemiological model for the period July 2011 to July 2012 in Rio de Janeiro state, Brazil. In grey are the 95% credible intervals obtained using the BDSKY model as shown in Fig. 2B, with the white solid line representing the mean estimates of R e through time. In panel B, the green line corresponds to the lifespan of Aedes mosquitoes, while the purple line corresponds to the vector’s extrinsic incubation period. The estimated date of entry of DENV4 in Rio de Janeiro (blue box in panel A) was November to December 2011.

References

    1. Bhatt S, et al. The global distribution and burden of dengue. Nature. 2013;496:504–507. doi: 10.1038/nature12060. - DOI - PMC - PubMed
    1. Holmes EC, Twiddy SS. The origin, emergence and evolutionary genetics of dengue virus. Infect Genet Evol. 2003;3:19–28. doi: 10.1016/S1567-1348(03)00004-2. - DOI - PubMed
    1. Twiddy SS, Holmes EC, Rambaut A. Inferring the rate and time-scale of dengue virus evolution. Mol Biol Evol. 2003;20:122–129. doi: 10.1093/molbev/msg010. - DOI - PubMed
    1. Messina JP, et al. Global spread of dengue virus types: mapping the 70 year history. Trends Microbiol. 2014;22:138–146. doi: 10.1016/j.tim.2013.12.011. - DOI - PMC - PubMed
    1. Gubler DJD. Urbanization and Globalization: The Unholy Trinity of the 21(st) Century. Trop Med Health. 2011;39:3–11. doi: 10.2149/tmh.2011-S05. - DOI - PMC - PubMed

Publication types