. 2017 Nov 9;7(1):15130.
doi: 10.1038/s41598-017-15417-2.

A nanobody-based tracer targeting DPP6 for non-invasive imaging of human pancreatic endocrine cells

Affiliations

A nanobody-based tracer targeting DPP6 for non-invasive imaging of human pancreatic endocrine cells

Alexander Balhuizen et al. Sci Rep. .

Abstract

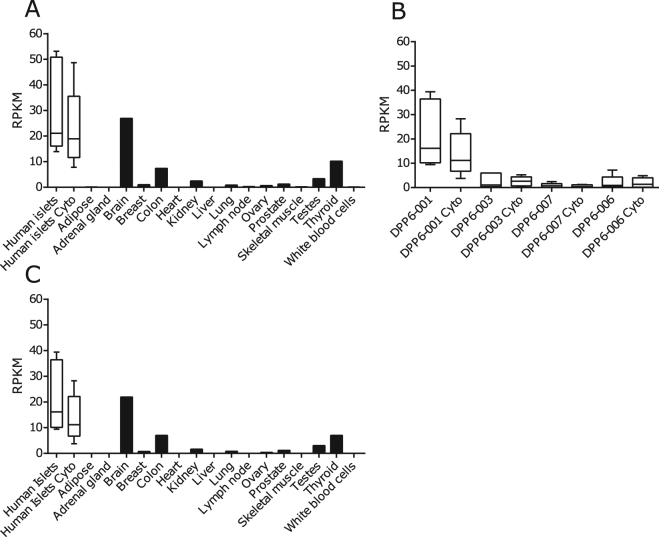
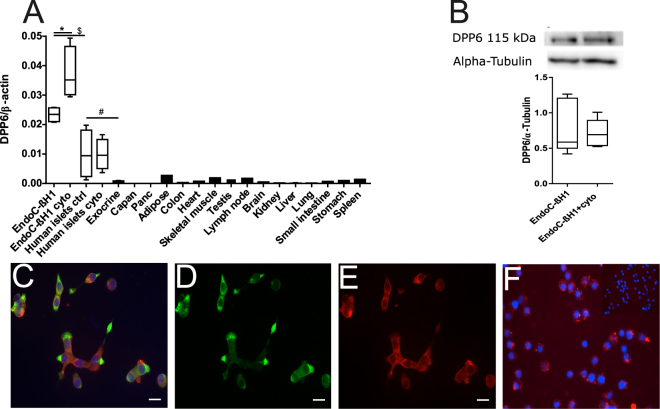
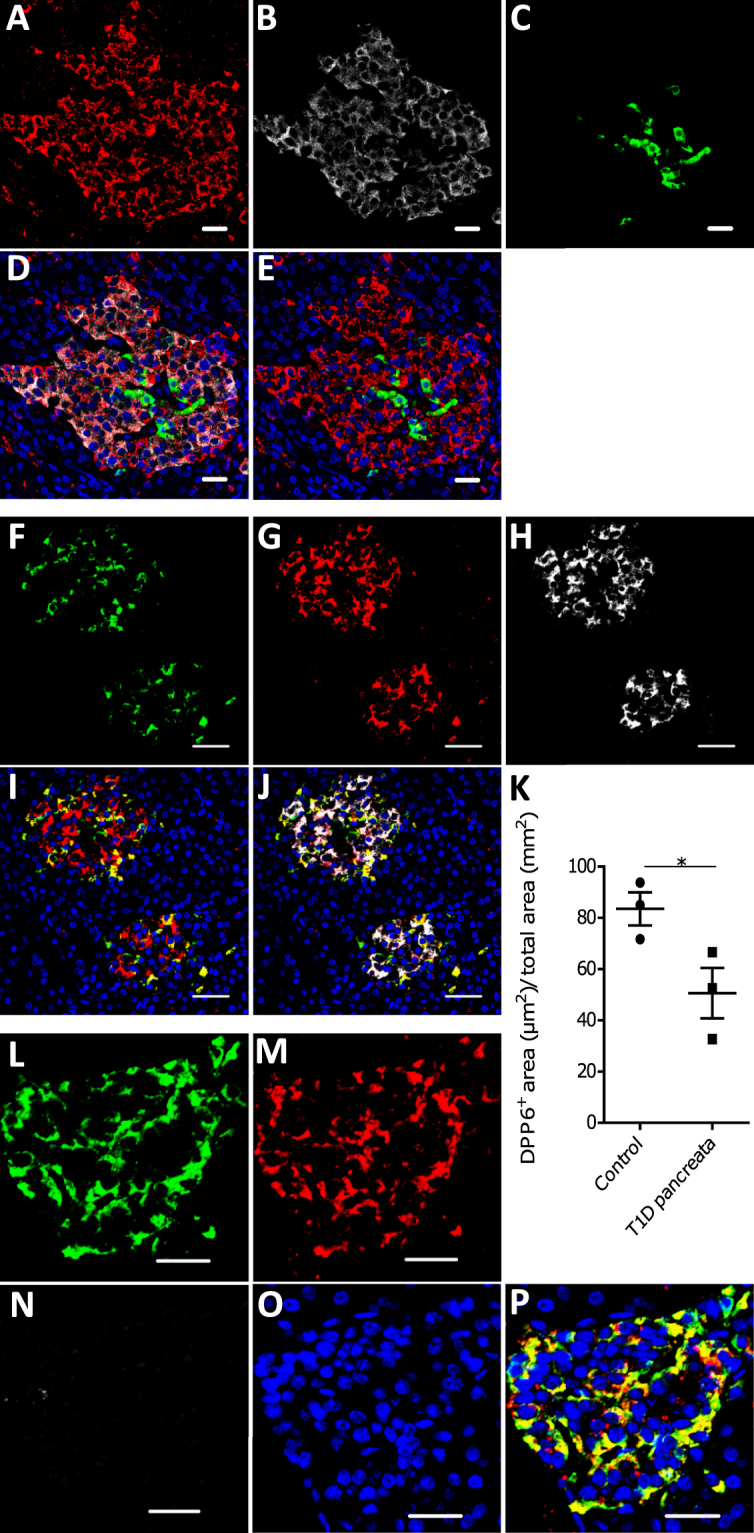
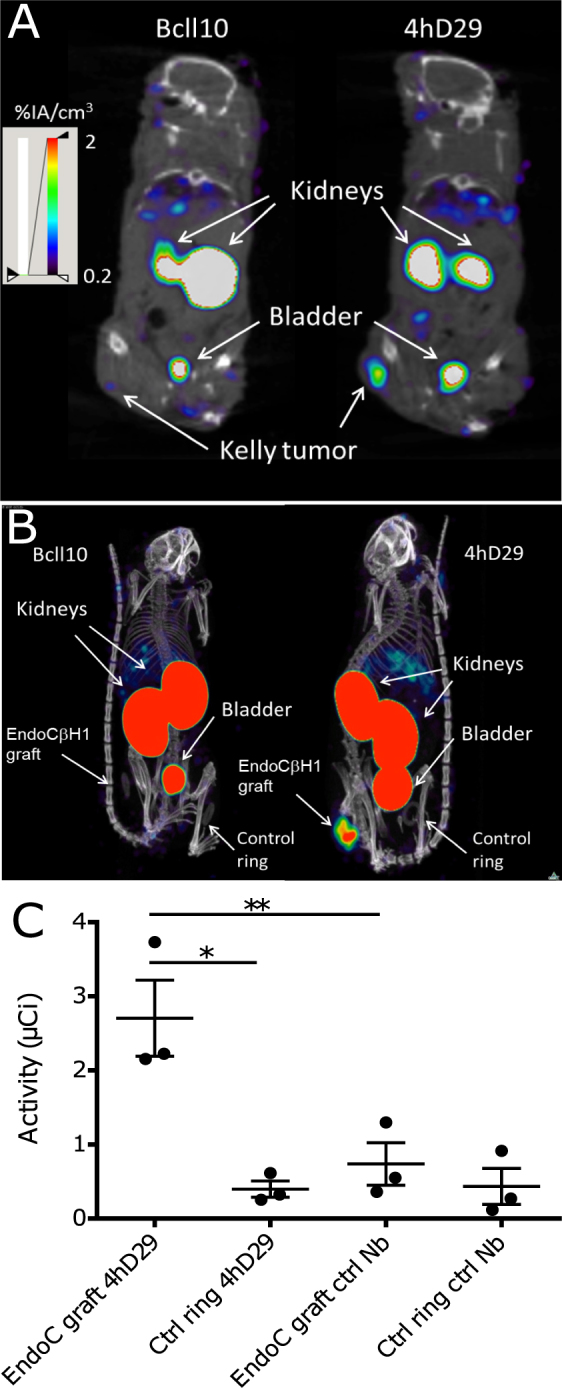
There are presently no reliable ways to quantify endocrine cell mass (ECM) in vivo, which prevents an accurate understanding of the progressive beta cell loss in diabetes or following islet transplantation. To address this unmet need, we coupled RNA sequencing of human pancreatic islets to a systems biology approach to identify new biomarkers of the endocrine pancreas. Dipeptidyl-Peptidase 6 (DPP6) was identified as a target whose mRNA expression is at least 25-fold higher in human pancreatic islets as compared to surrounding tissues and is not changed by proinflammatory cytokines. At the protein level, DPP6 localizes only in beta and alpha cells within the pancreas. We next generated a high-affinity camelid single-domain antibody (nanobody) targeting human DPP6. The nanobody was radiolabelled and in vivo SPECT/CT imaging and biodistribution studies were performed in immunodeficient mice that were either transplanted with DPP6-expressing Kelly neuroblastoma cells or insulin-producing human EndoC-βH1 cells. The human DPP6-expressing cells were clearly visualized in both models. In conclusion, we have identified a novel beta and alpha cell biomarker and developed a tracer for in vivo imaging of human insulin secreting cells. This provides a useful tool to non-invasively follow up intramuscularly implanted insulin secreting cells.


Conflict of interest statement

A.B., I. Ma., S.M., L.B., N.D. and D.L.E. have submitted a patent based on the use of DPP6 and the nanobodies targeting it for pancreatic islet cell imaging. T.L., J.D. and N.D. are cofounders and consultants of the biotech company Camel-IDS. T.L. and N.D. have received funding from Boehringer-Ingelheim, Complix and 121BIO. T.L. and N.D. hold patents on Nanobody imaging and therapy.

Figures

Figure 1
Figure 1
The step-by-step approach used to identify new endocrine cell biomarkers. Schematic overview of the approach taken to mine for new endocrine cell biomarkers in the transcriptome of human islet preparations (n = 5) analysed by RNA sequencing under both control condition and following treatment with pro-inflammatory cytokines (IL-1β + IFN-γ). Enriched pancreatic islet specific transcripts were identified by comparing transcriptomes of human pancreatic islets against 16 different normal human tissues. IPA: ingenuity pathway analysis, http://www.ingenuity.com/products/ipa.
Figure 2
Figure 2
DPP6 expression in different human tissues as determined by RNA sequencing. (A) Expression of DPP6 mRNA based on the RNA-sequencing of human pancreatic islets; (n = 5) treated or not with IL-1β + IFN-γ (cyto) for 48 h; and compared to 16 other human tissues under basal condition (Illumina Body Map 2.0; GSE30611). (B) Expression pattern of DPP6 splice variants in human pancreatic islets exposed or not to IL-1β + IFN-γ (cyto); human pancreatic islets express mainly the DPP6-001 variant, (n = 5); (C) Expression of the isoform DPP6-001 in human pancreatic islets exposed or not to IL-1β + IFN-γ (cyto), (n = 5) as compared to other human tissues; the highest extra-pancreatic expression is seen in brain, colon and thyroid.
Figure 3
Figure 3
Expression of DPP6 in human islets and EndoC-βH1 cells and other tissues evaluated by qPCR and histology. (A) Quantitative RT-PCR (qPCR) of DPP6 mRNA expression (detecting a shared sequence among all DPP6 splice variants) in EndoC-βH1 cells (n = 5) and human pancreatic islets (n = 4) that were exposed or not to cytokines (IL-1β + IFN-γ) for 48 h, as compared to pancreatic exocrine tissue (n = 6), two exocrine cell lines (Capan-2 (n = 3) and PANC (n = 3)), and 14 other non-pathological human tissues (n = 1). (B) Immunoblot of EndoC-βH1 cells under control conditions or following a 48h exposure to cytokines (IL-1β and IFN-γ), with alpha-tubulin as a reference protein. A representative figure is shown at the top and densitometric analysis at the bottom (n = 5), this figure displays a cropped blot, the full-length version is included in supplementary figure 8; (CF) Immunocytochemistry of EndoC-βH1 cells. (C) An overlay with cells stained with an anti-DPP6 monoclonal antibody (mAb, red), co-stained for insulin (green) and Hoechst in blue. The separate channels are displayed in (D) insulin (green) and (E) DPP6 (red) (n = 3). The mostly surface localization of DPP6 (red) can be observed in (F) (n = 4), with blue signals indicating Hoechst staining. The negative staining control of EndoC-βH1 cells (without the DPP6 antibody) is placed in the top right corner of panel F. White scale bar represents 1 µm. RT-qPCR and the western blot data are presented as means ± SEM. Paired and unpaired two-way ANOVA (indicated with * and $, respectively), and unpaired one-way ANOVA (indicated with #) with Šídák correction for multiple comparisons; *, $ and # p ≤ 0.05 as indicated by bars.
Figure 4
Figure 4
Localization of DPP6 expression in human pancreas. (AE) A representative human pancreas stained for DPP6 (A, red), insulin (B, white), somatostatin (C, green); overlay of DPP6 (red), insulin (white) and somatostatin (green) (D); overlay of DPP6 (red) and somatostatin (green) (E); the data indicate co-staining of insulin and DPP6, but not somatostatin and DPP6; (FJ) A representative human pancreas stained for glucagon (F, green), DPP6 (G, red), insulin (H, white); DPP6 (red) and glucagon (green) overlay (I); overlay of DPP6 (red), insulin (white) and glucagon (green) (J), the data indicate co-staining of both insulin and glucagon with DPP6; (K) Morphometric quantification of DPP6 area in pancreata from T1D patients as compared to control, non-diabetic individuals (n = 3). (LP) A representative human pancreas from a subject with long-term type 1 diabetes (16 years of disease) stained for glucagon (L, green), DPP6 (M, red), insulin (N, white); Hoechst (O, blue); (P) overlay of DPP6 (green), glucagon (red), insulin (white) and Hoechst (blue), indicating that in the absence of insulin positive cells, the remaining glucagon positive cells co-stain for DPP6. In total, 3 pancreata from normoglycemic individuals and 3 from type 1 diabetes subjects were analysed. White scale bar represents 20 µm.
Figure 5
Figure 5
Flow cytometry analysis of nanobody cell binding. The cell binding of the 4hD29 nanobody (Nb) was evaluated by flow cytometry. (AD) 4hD29 (red) recognizes human DPP6 in different cell types (HsDPP6); (A) 4hD29 (red) labelled transiently-transfected CHO cells overexpressing DPP6, where neither the irrelevant control Nb (green) nor the secondary control antibodies only (blue) stained the cells (n = 3); (B) non-transfected CHO cells labelled as in A (n = 3); (C) The Nb 4hD29 (red) recognizes DPP6-positive human Kelly neuroblastoma (n = 4) and (D) EndoC-βH1 cells (n = 5), whereas the secondary antibodies only (blue) or an irrelevant control Nb (green) do not. (E,F) 4hD29 (red) binds to endocrine (TSQ+/Rh) (E), but not to exocrine tissue (TSQ/Rh+) (F) of dissociated human pancreas (n = 4). Background staining with secondary staining control is indicated in blue. (G) Overview of the gating strategy for endocrine (TSQ+/Rh) and exocrine cells (TSQ/Rh+) analysed in (E,F). The median fluorescence intensity (MFI) was calculated for Kelly neuroblastoma (H) and EndoC-βH1 cells (I). Delta MFI values were calculated to compare the endocrine (TSQ+/Rh) and exocrine populations (TSQ/Rh+), showing that 4hD29 has an increased binding in endocrine cells as compared to exocrine cells (J). Unpaired (E,F) or paired (J) Student’s t-tests were performed to compare two groups; *p ≤ 0.05, **p ≤ 0.01.
Figure 6
Figure 6
Ex vivo biodistribution profile of radiolabelled 4hD29 and control nanobodies in mice implanted with a Kelly neuroblastoma subcutaneous tumour or intramuscular EndoC-βH1 transplants. Ex vivo biodistribution analysis of radiolabelled 4hD29 or control (non-specific) nanobody (BcII10) was performed in mice xenografted with Kelly neuroblastoma cells (n = 4) (A,CE) or with EndoC-βH1 transplants (n = 5) (B,FH). The evaluation was done 60 or 80 minutes, respectively, after i.v. administration of 5 µg 99mTc-labelled nanobody 4hD29 (white bars) or control nanobody BcII10 (black bars) and expressed as percent of injected activity per gram of tissue (%IA/g) ± SEM; (C,F) Individual uptake levels of tracers in Kelly tumours (C) or EndoC-βH1 transplants (F). Tumour-to-blood (D,G) and tumour-to-muscle ratios (E,H) of individual mice with either Kelly tumours (D,E) or EndoC-βH1 transplants (G,H). Data is presented as mean ± SEM; unpaired t-test, *p ≤ 0.05; **p ≤ 0.01; ***p ≤ 0.001.
Figure 7
Figure 7
Noninvasive microSPECT/CT imaging of Kelly neuroblastoma and EndoC-βH1 tumours in mice using 4hD29 or control nanobody tracers. Representative microSPECT/CT fusion images of mice bearing subcutaneous human Kelly neuroblastoma tumours (n = 3 per Nanobody); coronal slices at the height of the tumour are shown) (A) or EndoC-βH1 transplants (n = 5–6 per Nb; maximal intensity projections are shown) (B). The images were obtained at 60 and 80 minutes, respectively, after i.v. administration of 5 µg of 99mTc-4hD29 (right panel) or 99mTc-BcII10 (left panel) radiotracers. Mice were implanted with EndoC-βH1 grafts in transplantation rings in the right flank and empty transplantation rings in the left flank. (C) Quantification of SPECT signals in equally-sized regions-of-interest (ROIs) drawn over each transplantation ring in each individual mouse. Data are expressed as mean of total radioactivity (µCi) in each ROI ± SEM; Paired two-way ANOVA with Šídák correction for multiple comparisons, *p ≤ 0.05 and **p ≤ 0.01 as indicated by bars.

References

    1. Gregg BE, et al. Formation of a human beta-cell population within pancreatic islets is set early in life. J Clin Endocrinol Metab. 2012;97:3197–3206. doi: 10.1210/jc.2012-1206. - DOI - PMC - PubMed
    1. Campbell-Thompson M, et al. Insulitis and beta-cell mass in the natural history of type 1 diabetes. Diabetes. 2016;65:719–731. doi: 10.2337/db15-0779. - DOI - PMC - PubMed
    1. Andralojc K, et al. Obstacles on the way to the clinical visualisation of beta cells: looking for the Aeneas of molecular imaging to navigate between Scylla and Charybdis. Diabetologia. 2012;55:1247–1257. doi: 10.1007/s00125-012-2491-7. - DOI - PMC - PubMed
    1. Eriksson O, et al. Positron emission tomography ligand [11C]5-hydroxy-tryptophan can be used as a surrogate marker for the human endocrine pancreas. Diabetes. 2014;63:3428–3437. doi: 10.2337/db13-1877. - DOI - PubMed
    1. Gotthardt M, Eizirik DL, Cnop M, Brom M. Beta cell imaging - a key tool in optimized diabetes prevention and treatment. Trends in endocrinology and metabolism: TEM. 2014;25:375–377. doi: 10.1016/j.tem.2014.02.002. - DOI - PubMed

Publication types

MeSH terms

Substances