

Plasticity of the inner cell mass in mouse blastocyst is restricted by the activity of FGF/MAPK pathway
- PMID: 29123210
- PMCID: PMC5680175
- DOI: 10.1038/s41598-017-15427-0
Plasticity of the inner cell mass in mouse blastocyst is restricted by the activity of FGF/MAPK pathway
Abstract
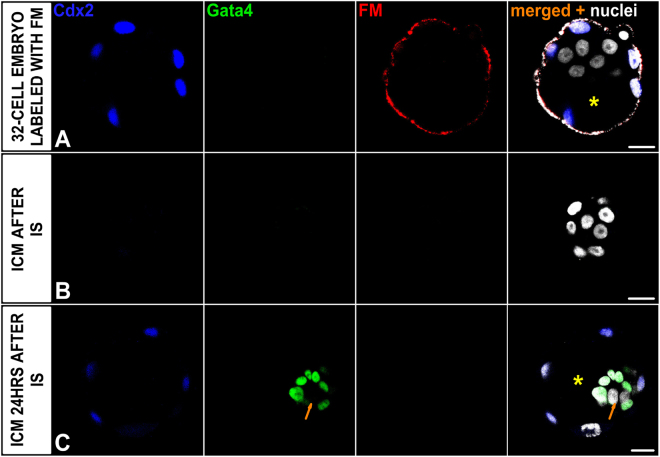
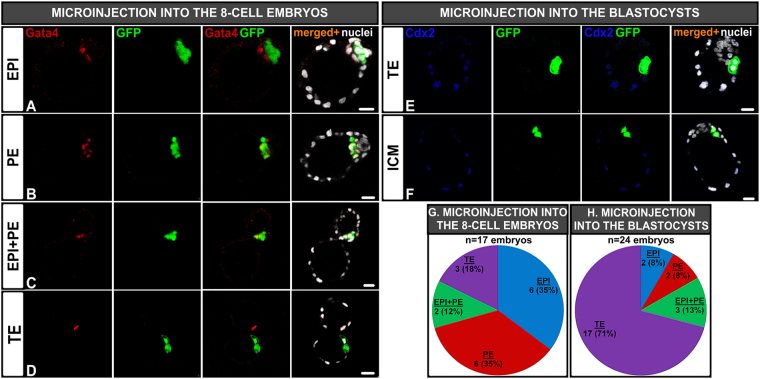
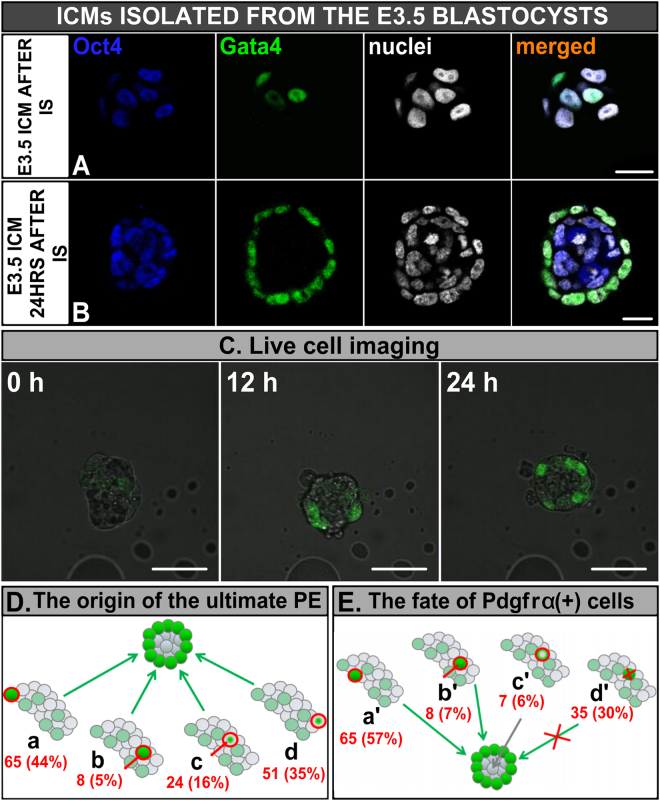
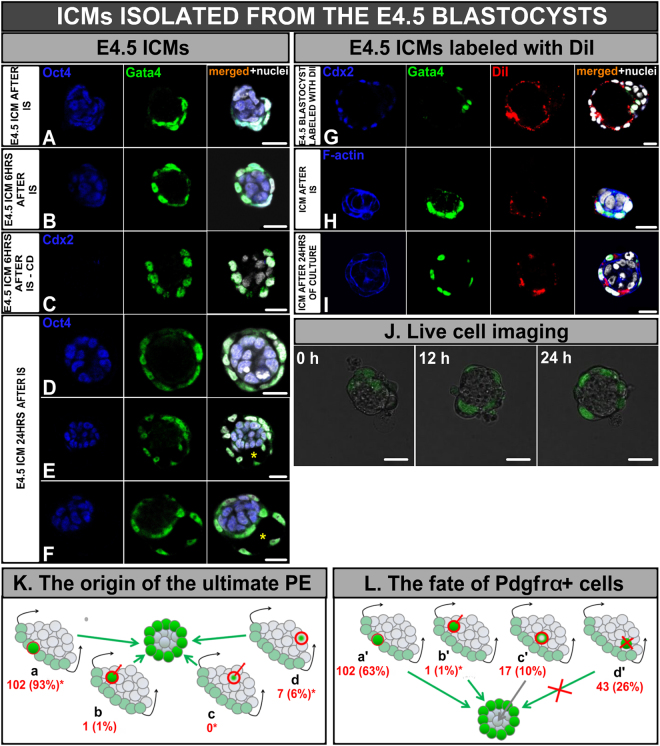
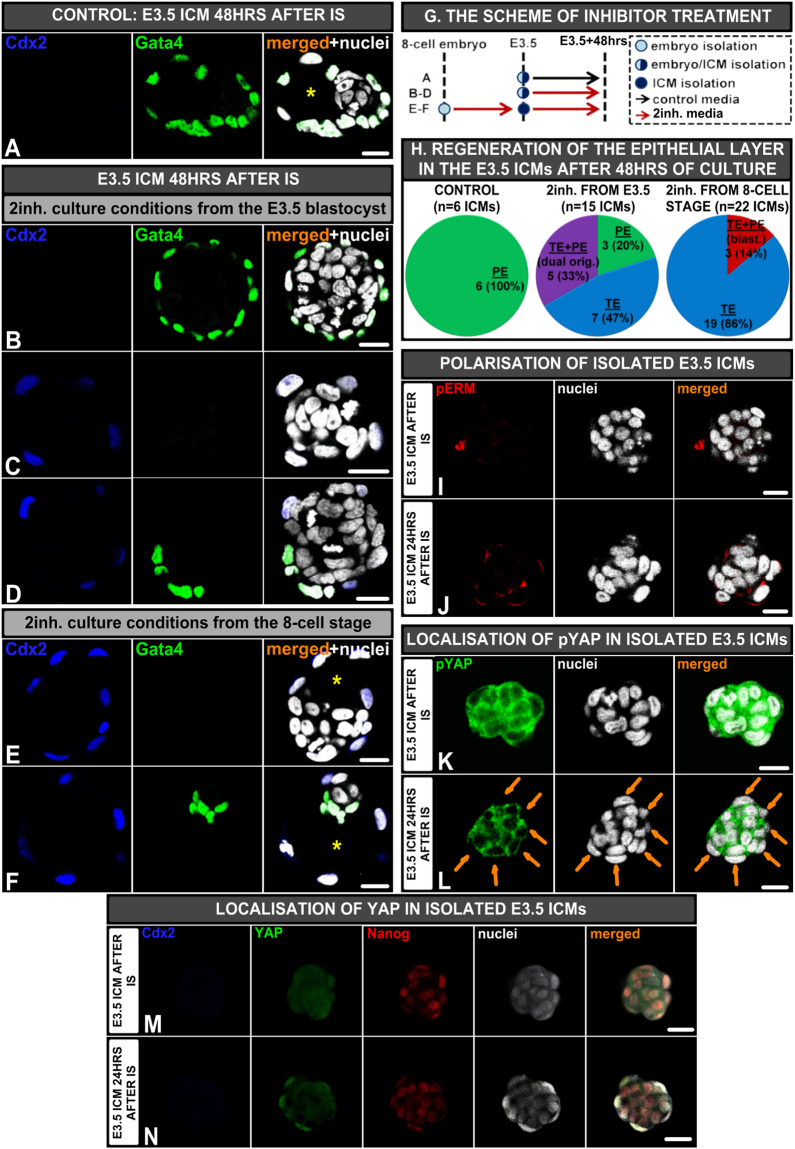
In order to ensure successful development, cells of the early mammalian embryo must differentiate to either trophectoderm (TE) or inner cell mass (ICM), followed by epiblast (EPI) or primitive endoderm (PE) specification within the ICM. Here, we deciphered the mechanism that assures the correct order of these sequential cell fate decisions. We revealed that TE-deprived ICMs derived from 32-cell blastocysts are still able to reconstruct TE during in vitro culture, confirming totipotency of ICM cells at this stage. ICMs isolated from more advanced blastocysts no longer retain totipotency, failing to form TE and generating PE on their surface. We demonstrated that the transition from full potency to lineage priming is prevented by inhibition of the FGF/MAPK signalling pathway. Moreover, we found that after this first restriction step, ICM cells still retain fate flexibility, manifested by ability to convert their fate into an alternative lineage (PE towards EPI and vice versa), until peri-implantation stage.
Conflict of interest statement
The authors declare that they have no competing interests.
Figures
Similar articles
-
FGF signal-dependent segregation of primitive endoderm and epiblast in the mouse blastocyst.Development. 2010 Mar;137(5):715-24. doi: 10.1242/dev.043471. Development. 2010. PMID: 20147376
-
p38 (Mapk14/11) occupies a regulatory node governing entry into primitive endoderm differentiation during preimplantation mouse embryo development.Open Biol. 2016 Sep;6(9):160190. doi: 10.1098/rsob.160190. Open Biol. 2016. PMID: 27605380 Free PMC article.
-
Allocation of inner cells to epiblast vs primitive endoderm in the mouse embryo is biased but not determined by the round of asymmetric divisions (8→16- and 16→32-cells).Dev Biol. 2014 Jan 1;385(1):136-48. doi: 10.1016/j.ydbio.2013.09.008. Epub 2013 Sep 13. Dev Biol. 2014. PMID: 24041854
-
Formation of distinct cell types in the mouse blastocyst.Results Probl Cell Differ. 2012;55:203-17. doi: 10.1007/978-3-642-30406-4_11. Results Probl Cell Differ. 2012. PMID: 22918808 Review.
-
The birth of embryonic pluripotency.Philos Trans R Soc Lond B Biol Sci. 2014 Dec 5;369(1657):20130541. doi: 10.1098/rstb.2013.0541. Philos Trans R Soc Lond B Biol Sci. 2014. PMID: 25349450 Free PMC article. Review.
Cited by
-
A comprehensive review: synergizing stem cell and embryonic development knowledge in mouse and human integrated stem cell-based embryo models.Front Cell Dev Biol. 2024 Apr 22;12:1386739. doi: 10.3389/fcell.2024.1386739. eCollection 2024. Front Cell Dev Biol. 2024. PMID: 38715920 Free PMC article. Review.
-
Divergent destinies: insights into the molecular mechanisms underlying EPI and PE fate determination.Life Sci Alliance. 2025 Jan 8;8(3):e202403091. doi: 10.26508/lsa.202403091. Print 2025 Mar. Life Sci Alliance. 2025. PMID: 39779220 Free PMC article. Review.
-
Principles of Self-Organization of the Mammalian Embryo.Cell. 2020 Dec 10;183(6):1467-1478. doi: 10.1016/j.cell.2020.11.003. Cell. 2020. PMID: 33306953 Free PMC article. Review.
-
Age-related decline in behavior and reproductive health in male mice.Sci Rep. 2025 Jul 1;15(1):22366. doi: 10.1038/s41598-025-08743-3. Sci Rep. 2025. PMID: 40595392 Free PMC article.
-
Novel generic models for differentiating stem cells reveal oscillatory mechanisms.J R Soc Interface. 2021 Oct;18(183):20210442. doi: 10.1098/rsif.2021.0442. Epub 2021 Oct 6. J R Soc Interface. 2021. PMID: 34610261 Free PMC article.
References
-
- Koutsourakis M, Langeveld A, Patient R, Beddington R, Grosveld F. The transcription factor GATA6 is essential for early extraembryonic development. Dev. Camb. Engl. 1999;126:723–732. - PubMed
Publication types
MeSH terms
Substances
LinkOut - more resources
Full Text Sources
Other Literature Sources
