. 2017 Nov 9;7(1):15151.
doi: 10.1038/s41598-017-15495-2.

Observer's anxiety facilitates magnocellular processing of clear facial threat cues, but impairs parvocellular processing of ambiguous facial threat cues

Affiliations

Observer's anxiety facilitates magnocellular processing of clear facial threat cues, but impairs parvocellular processing of ambiguous facial threat cues

Hee Yeon Im et al. Sci Rep. .

Abstract

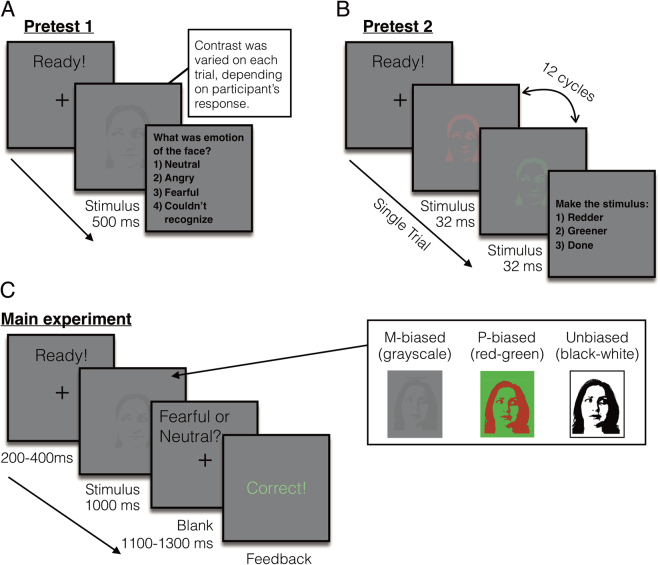
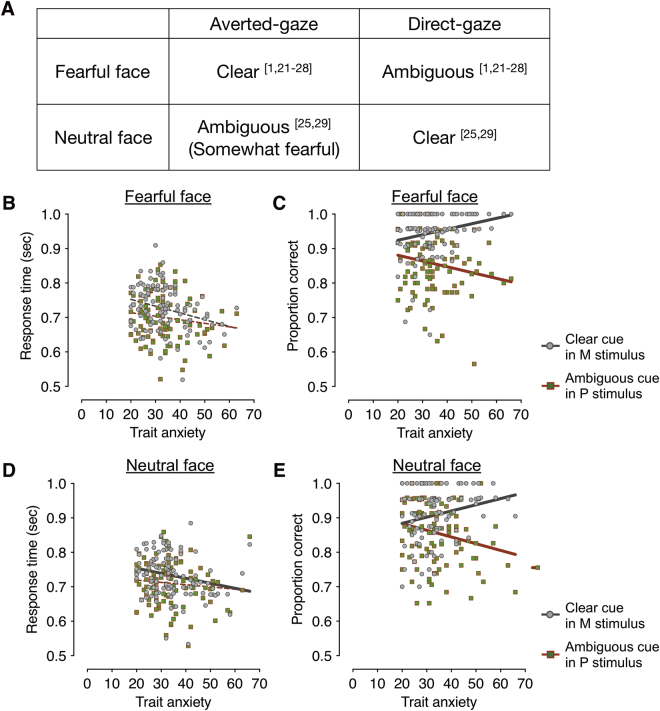
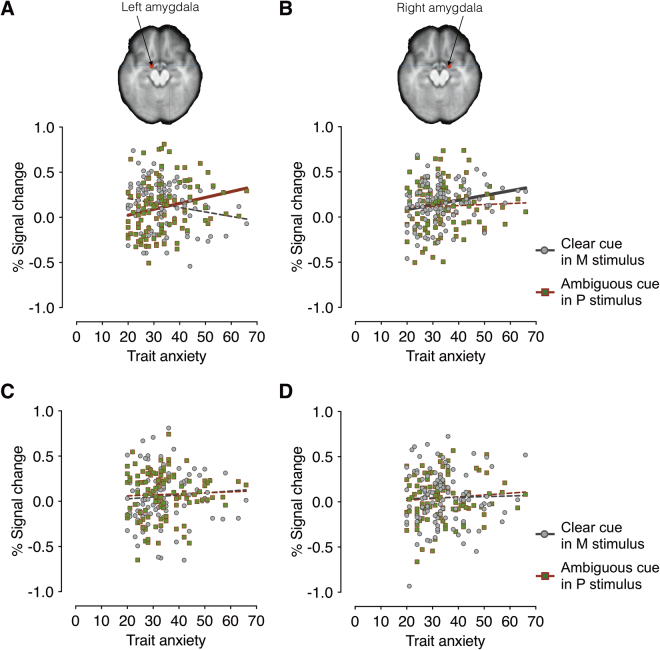
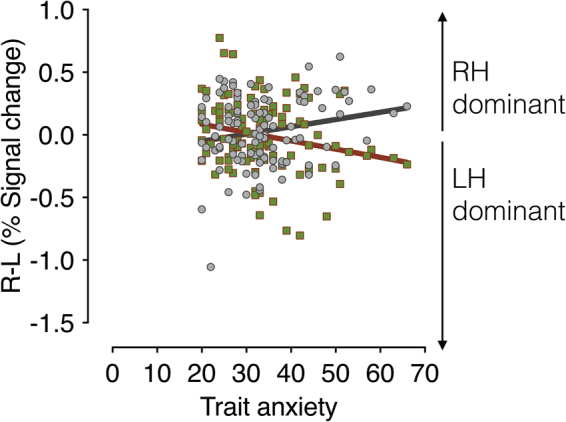
Facial expression and eye gaze provide a shared signal about threats. While a fear expression with averted gaze clearly points to the source of threat, direct-gaze fear renders the source of threat ambiguous. Separable routes have been proposed to mediate these processes, with preferential attunement of the magnocellular (M) pathway to clear threat, and of the parvocellular (P) pathway to threat ambiguity. Here we investigated how observers' trait anxiety modulates M- and P-pathway processing of clear and ambiguous threat cues. We scanned subjects (N = 108) widely ranging in trait anxiety while they viewed fearful or neutral faces with averted or directed gaze, with the luminance and color of face stimuli calibrated to selectively engage M- or P-pathways. Higher anxiety facilitated processing of clear threat projected to M-pathway, but impaired perception of ambiguous threat projected to P-pathway. Increased right amygdala reactivity was associated with higher anxiety for M-biased averted-gaze fear, while increased left amygdala reactivity was associated with higher anxiety for P-biased, direct-gaze fear. This lateralization was more pronounced with higher anxiety. Our findings suggest that trait anxiety differentially affects perception of clear (averted-gaze fear) and ambiguous (direct-gaze fear) facial threat cues via selective engagement of M and P pathways and lateralized amygdala reactivity.


Conflict of interest statement

The authors declare that they have no competing interests.

Figures

Figure 1
Figure 1
Sample trials of the pretests and the main experiment. (A) A sample trial of pretest 1 to measure the participants’ threshold for the foreground-background luminance contrast for achromatic M-biased stimuli. (B) A sample trial of pretest 2 to measure the participants’ threshold for the isoluminance values for chromatic P-biased stimuli. (C) A sample trial of the main experiment and sample images of M-biased (grayscale), P-biased (red-green), and Unbiased (black-white) stimuli.
Figure 2
Figure 2
The behavioral results from the main experiment. (A) Different combinations of facial expressions (fearful and neutral) and eye gaze (averted and direct) that convey clear and ambiguous cues. Numerical superscripts indicate relevant references. (B) The response time (RT) for clear fear (averted-gaze fear) faces presented in M-biased (dots in gray) and for ambiguous fear (direct-gaze fear) faces presented in P-biased (dots in red-green) stimuli. The gray and red lines indicate the linear relationship between trait anxiety and the RT for the M-biased stimuli and the P-biased stimuli, respectively. Solid, thicker lines indicate significant correlations (FDR adjusted p < 0.05), whereas broken, thinner lines indicate correlations that were not statistically significant. (C) The accuracy for clear fear (averted-gaze fear) faces presented in M-biased (dots in gray) and for ambiguous fear (direct-gaze fear) faces presented in P-biased (dots in red-green) stimuli. Solid, thicker lines indicate significant correlations (FDR adjusted p < 0.05), whereas broken, thinner lines indicate correlations that were not statistically significant. (D) The response time (RT) for clear neutral (direct-gaze neutral) faces presented in M-biased (dots in gray) and for ambiguous neutral (averted-gaze neutral) faces presented in P-biased (dots in red-green) stimuli. Note that the type of eye gaze that is combined to neutral face for clear cue is different from fearful face. (E) The accuracy for clear neutral (direct-gaze neutral) faces presented in M-biased and for ambiguous neutral (averted-gaze neutral) faces presented in P-biased stimuli.
Figure 3
Figure 3
Activation map (p < 0.001, k = 5) corresponds to whole-brain analyses showing the left and right amygdalae activations for Ambiguous (direct-gaze fear) minus Clear (averted-gaze fear) threat cues presented in P-biased stimuli (blue-green) and for Clear (averted-gaze fear) minus Ambiguous (direct-gaze fear) threat cues presented in M-biased stimuli (red-yellow), respectively.
Figure 4
Figure 4
The left and right amygdala activation during perception of fearful (A and B) and neutral faces (C and D). (A) The scatter plot of the trait anxiety and the % signal change in the left amygdala when participants viewed clear fear (averted-gaze fear) faces presented in M-biased (in gray dots) and ambiguous fear (direct-gaze fear) faces in P-biased (in red-green dots) stimuli. The gray and red lines indicate the linear relationship between trait anxiety and the left amygdala activation for the M-biased stimuli and the P-biased stimuli, respectively. The solid, thicker lines indicate statistically significant correlations (FDR adjusted p < 0.05), whereas broken, thinner lines indicate that correlations were not statistically significant. (B) The scatter plot of the trait anxiety and the % signal change in the left amygdala when participants viewed clear fear (averted-gaze fear) faces presented in M-biased (in gray dots) and ambiguous fear (direct-gaze fear) faces presented in P-biased (in red-green dots) stimuli. (C) The scatter plot of the trait anxiety and the % signal change in the left amygdala when participants viewed clear neutral (direct-gaze neutral) faces presented in M-biased (in gray dots) and ambiguous neutral (averted-gaze neutral) faces presented in P-biased (in red-green dots) stimuli. (D) The scatter plot of the trait anxiety and the % signal change in the right amygdala when participants viewed clear neutral (direct-gaze neutral) faces presented in M-biased (in gray dots) and ambiguous neutral (averted-gaze neutral) faces presented in P-biased (in red-green dots) stimuli.
Figure 5
Figure 5
The magnitude of hemispheric lateralization in amygdala, obtained by subtracting the % signal change in the left amygdala from that in the right amygdala for each participant. The magnitude of hemispheric lateralization in amygdala when participants viewed clear fear (averted-gaze fear) faces presented in M-biased (dots in gray) and ambiguous fear (direct-gaze fear) faces presented in P-biased (dots in red-green) are plotted as a function of observers’ trait anxiety. The positive values indicate greater activation in the right amygdala (right hemisphere (RH) dominant) whereas the negative values indicate greater activation in the left amygdala (left hemisphere (LH) dominant). The gray and red lines indicate the linear regressions with trait anxiety for the M-biased and P-biased stimuli, respectively. Solid, thick lines indicate that correlations were statistically significant (FDR adjusted p < 0.05).

Similar articles

Cited by

References

    1. Adams RB, Jr., Ambady N, Macrae CN, Kleck RE. Emotional expressions forecast approach-avoidance behavior. Motivation and Emotion. 2006;30:177–186. doi: 10.1007/s11031-006-9020-2. - DOI
    1. Bodenhausen, G. V. & Macrae, C. N. Stereotype activation and inhibition in Advances in social cognition (ed. J. R. Wyer). (Mahwah, NJ: Erlbaum, 1998).
    1. Brewer, M. B. A dual process model of impression formation in Advances in social cognition (ed. Wyer, R. S. Jr. & Srull, T. K.) 1–36 (Hillsdale, N. J. Erlbaum, 1988).
    1. Devine PG. Stereotypes and prejudice: their automatic and controlled components. Journal of Personality and Social Psychology. 1989;56:5–18. doi: 10.1037/0022-3514.56.1.5. - DOI
    1. Fiske, S. T., Lin, M. & Neuberg, S. L. The continuum model: ten years later in Dual-process theories in social psychology (ed. S. Chaiken & Y. Trope) 231–254 (Guilford Press, 1999).

Publication types