. 2017 Oct 10;29(19):8269-8281.
doi: 10.1021/acs.chemmater.7b02567. Epub 2017 Sep 6.

Target-or-Clear Zirconium-89 Labeled Silica Nanoparticles for Enhanced Cancer-Directed Uptake in Melanoma: A Comparison of Radiolabeling Strategies

Affiliations

Target-or-Clear Zirconium-89 Labeled Silica Nanoparticles for Enhanced Cancer-Directed Uptake in Melanoma: A Comparison of Radiolabeling Strategies

Feng Chen et al. Chem Mater. .

Abstract

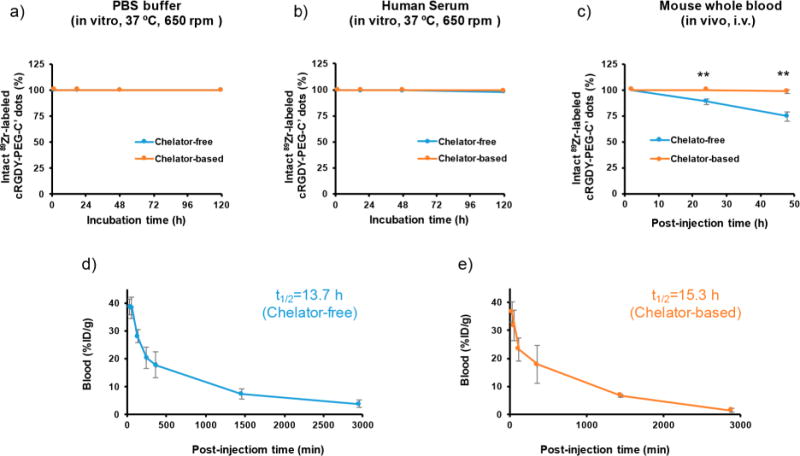
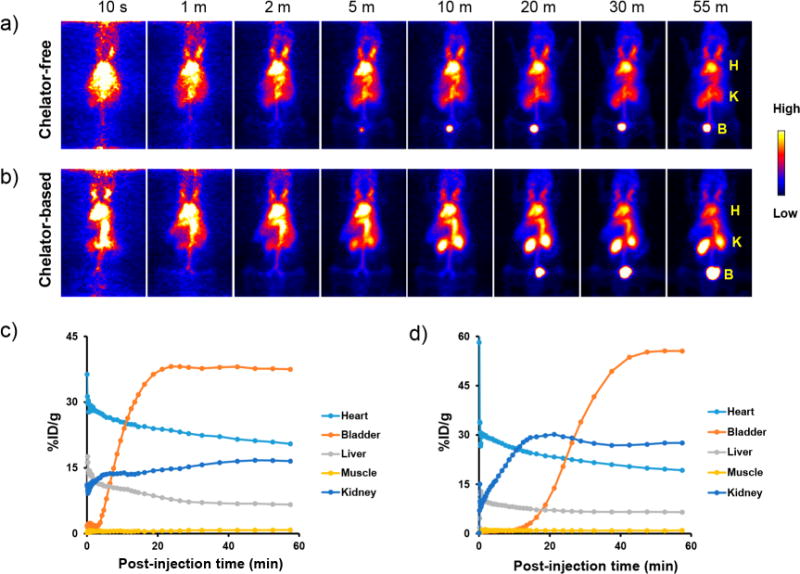
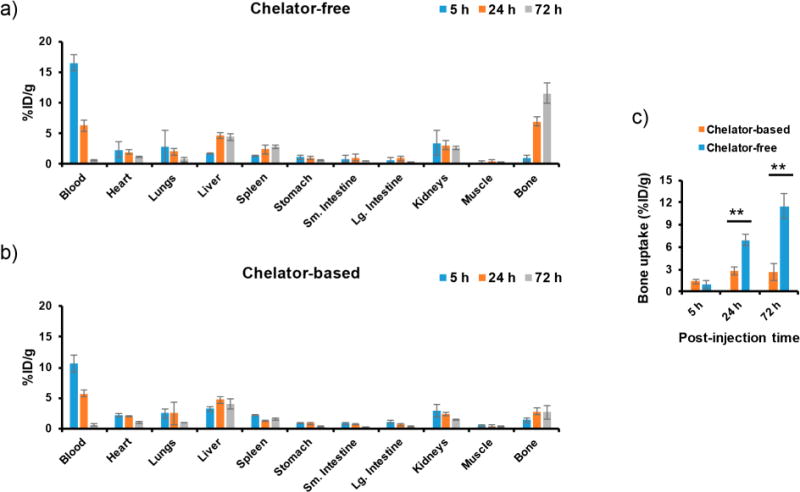
Designing a nanomaterials platform with high target-to-background ratios has long been one of the major challenges in the field of nanomedicine. Here, we introduce a "target-or-clear" multifunctional nanoparticle platform that demonstrates high tumor-targeting efficiency and retention while minimizing off-target effects. Encouraged by the favorable preclinical and clinical pharmacokinetic profiles derived after fine-tuning surface chemical properties of radioiodinated (124I, t1/2 = 100.2 h) ultrasmall cRGDY-conjugated fluorescent silica nanoparticles (C dots), we sought to investigate how the biological properties of these radioconjugates could be influenced by the conjugation of radiometals such as zirconium-89 (89Zr, t1/2 = 78.4 h) using two different strategies: chelator-free and chelator-based radiolabeling. The attachment of 89Zr to newer, surface-aminated, integrin-targeting C' dots using a two-pot synthesis approach led to favorable pharmacokinetics and clearance profiles as well as high tumor uptake and target-to-background ratios in human melanoma models relative to biological controls while maintaining particle sizes below the effective renal glomerular filtration size cutoff <10 nm. Nanoconjugates were also characterized in terms of their radiostability and plasma residence half-lives. Our 89Zr-labeled ultrasmall hybrid organic-inorganic particle is a clinically promising positron emission tomography tracer offering radiobiological properties suitable for enhanced molecularly targeted cancer imaging applications.


Conflict of interest statement

Notes The authors declare no competing financial interest.

Figures

Figure 1
Figure 1
Characterization of cRGDY-PEG-C′ dots and NH2-cRGDY-PEG-C′ dots. GPC elugram with fit (a), FCS Characterization of cRGDY-PEG-C′ dots and NH2-cRGDY-PEG-C′ dots. GPC elugram with fit (a), FCS correlation curve with fit (b), and UV–vis absorbance spectra (c) of cRGDY-PEG-C′ dots as compared to those of PEG-C′ dots. GPC elugram with fit (d), FCS correlation curve with fit (e), and UV–vis absorbance spectra (f) of amine-functionalized NH2-cRGDY-PEG-C′ dots as compared to those of PEG-C′ dots.
Figure 2
Figure 2
Chelator-free and chelator-based 89Zr radiolabeling studies. (a) Concentration-dependent chelator-free 89Zr labeling of cRGDY-PEG-C′ dots. Labeling temperature was set to 75 °C; labeling pH was set to 8, and C′ dot (nmol) to 89Zr (mCi) ratio was in the range of 0–7.5 nmol/mCi. (b) pH-Dependent chelator-free 89Zr labeling. Labeling temperature: 75 °C; C′ dot to 89Zr ratio: 7.5 nmol/mCi; labeling pH range: 2–9. (c) Temperature-dependent chelator-free 89Zr labeling. Labeling pH: 8; C′ dot to 89Zr ratio: 7.5 nmol/mCi; labeling temperature range: 25–75 °C. (d) Chelator-free 89Zr labeling comparison between C′ dots with regular PEGylation procedures and PEGylated C′ dots further modified with additional small silane molecules (i.e., DEDMS: diethoxy dimethyl silane). Labeling temperature: 75 °C; labeling pH: 8; C′ dot to 89Zr ratio: 7.5 nmol/mCi. (e) Concentration-dependent chelator-based 89Zr labeling of DFO-cRGDY-PEG-C′ dots. Labeling temperature: 37 °C; labeling pH: 7.5; C′ dot to 89Zr ratio range: 0–0.75 nmol/mCi. (f) MP-AES testing of the number of natZr per DFO-cRGDY-PEG-C′ dot particles synthesized with varied particle to DFO-NCS ratios. The radiolabeling yield was evaluated once per time point (a–e). MP-AES measurements of natZr concentrations were repeated in triplicate (f).
Figure 3
Figure 3
Comparison of chelator-free and chelator-based 89Zr-labeled C′ dot properties. Radiostability of 89Zr-labeled cRGDY-PEG-C′ dots in (a) PBS, 37 °C under stirring at 650 rpm, (b) human serum, 37 °C under stirring at 650 rpm, and (c) in vivo, i.v.-injected into healthy female athymic nu/nu mice (6–8 weeks old). Plasma (which contained >98% of the 89Zr-labeled cRGDY-PEG-C′ dots) was separated from whole blood at different postinjection time points and used to assess radiopurity. The nonspecific association of 89Zr-labeled cRGDY-PEG-C′ dots to red blood cells was estimated to be less than 2%. Blood circulation half-life fitting for (d) chelator-free 89Zr-labeled cRGDY-PEG-C′ dots (n = 3) and (e) chelator-based 89Zr-labeled cRGDY-PEG-C′ dots (n = 3). (**p < 0.005). For each time point, radiopurity of 89Zr-labeled cRGDY-PEG-C′ dots was evaluated in triplicate. Note: error bars in panels a and b are smaller than the size of the data points.
Figure 4
Figure 4
Comparison of dynamic PET imaging results in mice for chelator-free and chelator-based 89Zr-labeled C′ dots. (a) Chelator-free 89Zr-labeled cRGDY-PEG-C′ dots and (b) chelator-based 89Zr-labeled cRGDY-PEG-C′ dots. H: heart; K: kidney; B: bladder. The first 60 min time– activity curves for major organs (i.e., heart, bladder, liver, muscle, and kidney) in mice i.v.-injected with (c) chelator-free 89Zr-labeled cRGDY-PEG-[89Zr]C′ dots and (d) chelator-based 89Zr-labeled 89Zr-DFO-cRGDY-PEG-C′ dots. All images in panels a and b are coronal MIP PET images. For each group, a representative mouse was used to acquire dynamic PET data.
Figure 5
Figure 5
Biodistribution studies in mice for chelator-free and chelator-based 89Zr-labeled C′ dots. (a) Chelator-free 89Zr-labeled cRGDY-PEG-[89Zr]C′ dots and (b) chelator-based 89Zr-labeled 89Zr-DFO-cRGDY-PEG-C′ dots in healthy mice (n = 3). (c) Comparison of time-dependent bone uptake in mice injected with the 89Zr-labeled cRGDY-PEG-C′ dots (**p < 0.005).
Figure 6
Figure 6
In vivo tumor-targeted coronal PET images of mice and their analysis. Mice injected with (a) cRGDY-PEG-[89Zr]C′ dots, chelator-free labeling, in M21 tumor-bearing mice (n = 3), (b) 89Zr-DFO-cRGDY-PEG-C′ dots, chelator-based labeling, in M21 tumor-bearing mice (n = 3), and (c) 89Zr-DFO-cRGDY-PEG-C′ dots, chelator-based labeling, in M21L tumor-bearing mice (n = 3). MIP images at 2 and 72 h are presented to reveal the extended blood half-lives of the particles, renal clearance of particles into the bladder at 2 h postinjection, and bone and joint uptake at 72 h postinjection. Time activity curves showing (d) chelator-free 89Zr-labeled cRGDY-PEG-[89Zr]C′ dot in M21 xenografts, (e) chelator-based 89Zr-labeled 89Zr-DFO-cRGDY-PEG-C′ dots in M21 xenografts, and (f) chelator-based 89Zr-labeled 89Zr-DFO-cRGDY-PEG-C′ dots in M21L xenografts. Comparisons of (g) tumor uptake, (h) tumor-to-blood ratios, (i) tumor-to-liver ratios, and (j) tumor-to-muscle ratios among three groups. N = 3 for each group.
Scheme 1
Scheme 1. 89Zr-Radiolabeling Strategies of cRGDY-PEG-C′ Dotsa
a(a) Chelator-free strategy: the surface and/or internal deprotonated silanol groups (−Si−O) from the (1) cRGDY-PEG-C′ dots are functioning as the inherent oxygen donors (or hard Lewis bases) for the successful labeling of 89Zr (a hard Lewis acid) at 75 °C, pH 8, forming (2) cRGDY-PEG-[89Zr]C′ dots. (b) Chelator-based strategy: DFO chelators are conjugated to the surface of amine-functionalized NH2-cRGDY-PEG-C′ dots by reacting DFO-NCS with the amine groups on the silica surface of the C′ dots. As synthesized (4) DFO-cRGDY-PEG-C′ dots are then labeled with 89Zr at 37 °C, pH 7, forming (5) 89Zr-DFO-cRGDY-PEG-C′ dots. The molecular structures of the chelated radiometal for both strategies are rendered in 3D and 2D on the right. The atoms of silicon, oxygen, carbon, nitrogen, sulfur, hydrogen, and zirconium in the 3D renderings are colored in purple, red, gray, blue, yellow, white, and light green, respectively.

Similar articles

Cited by

References

    1. Smith BR, Gambhir SS. Nanomaterials for in Vivo Imaging. Chem Rev. 2017;117:901–986. - PubMed
    1. Thakor AS, Gambhir SS. Nanooncology: the Future of Cancer Diagnosis and Therapy. Ca-Cancer J Clin. 2013;63:395–418. - PubMed
    1. Anselmo AC, Mitragotri S. A Review of Clinical Translation of Inorganic Nanoparticles. AAPS J. 2015;17:1041–54. - PMC - PubMed
    1. Anselmo AC, Mitragotri S. Nanoparticles in the Clinic. Bioeng Transl Med. 2016;1:10–29. - PMC - PubMed
    1. Wilhelm S, Tavares AJ, Dai Q, Ohta S, Audet J, Dvorak HF, Chan WCW. Analysis of Nanoparticle Delivery to Tumours. Nat Rev Mater. 2016;1:16014.