. 2017 Oct 24:12:7815-7832.
doi: 10.2147/IJN.S144715. eCollection 2017.

A magnetically responsive nanocomposite scaffold combined with Schwann cells promotes sciatic nerve regeneration upon exposure to magnetic field

Affiliations

A magnetically responsive nanocomposite scaffold combined with Schwann cells promotes sciatic nerve regeneration upon exposure to magnetic field

Zhongyang Liu et al. Int J Nanomedicine. .

Abstract

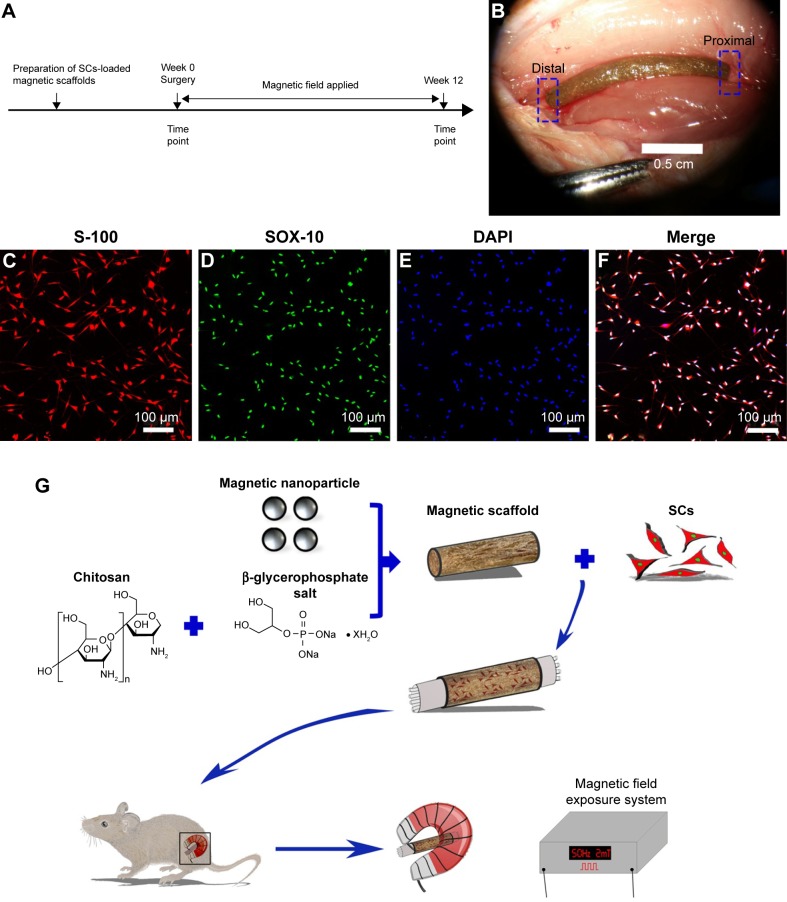
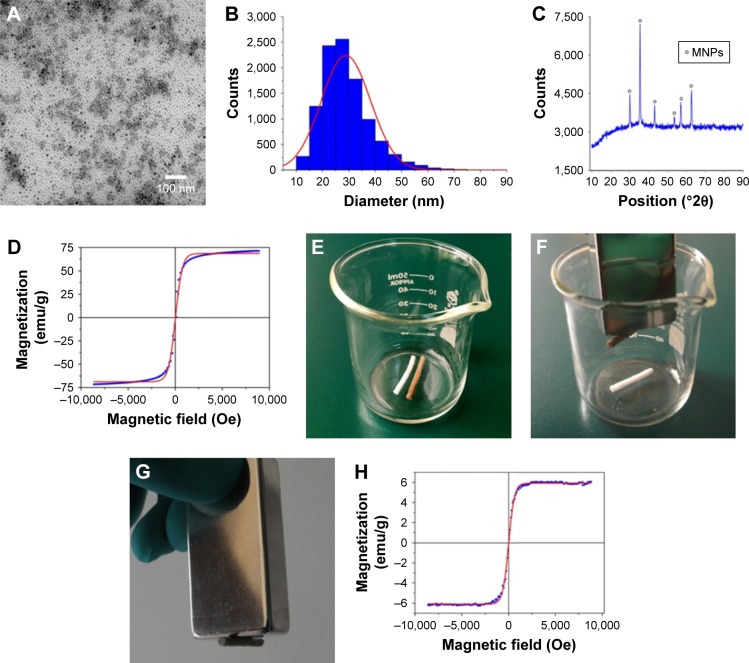
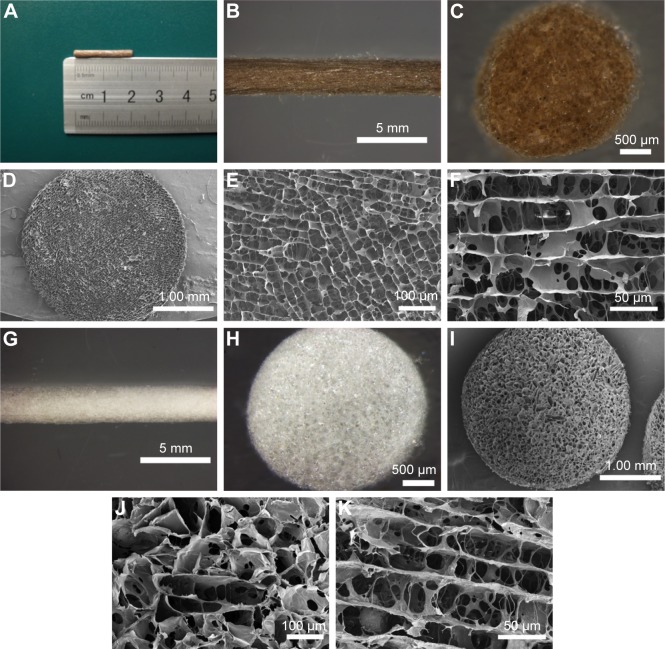
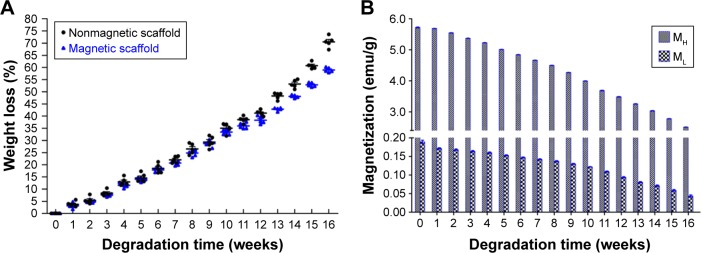
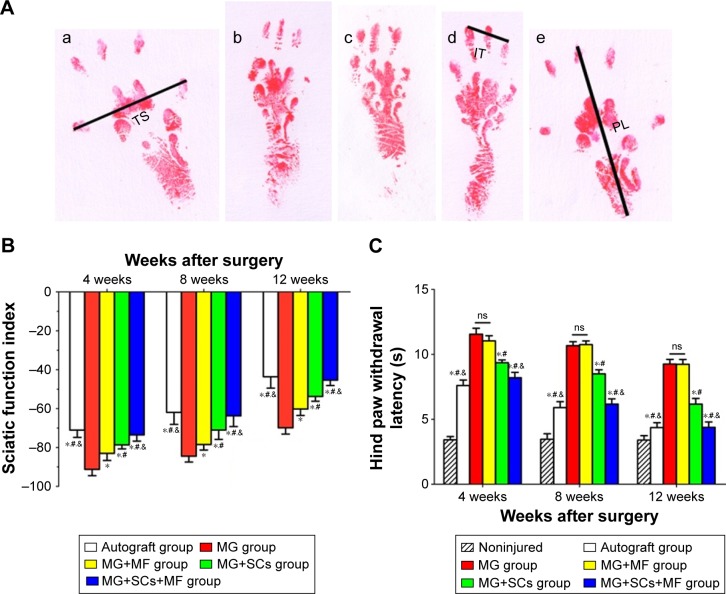
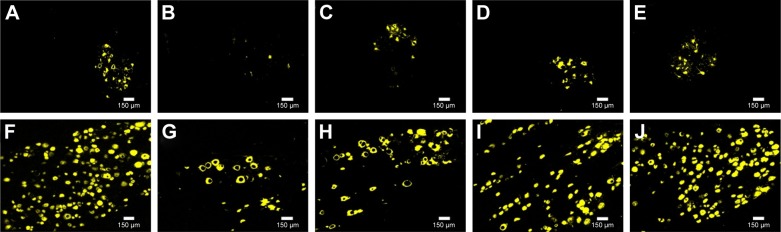
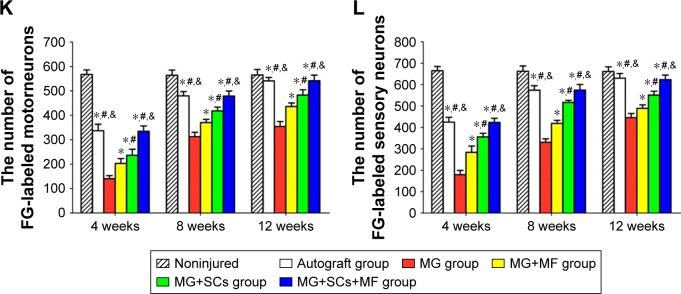
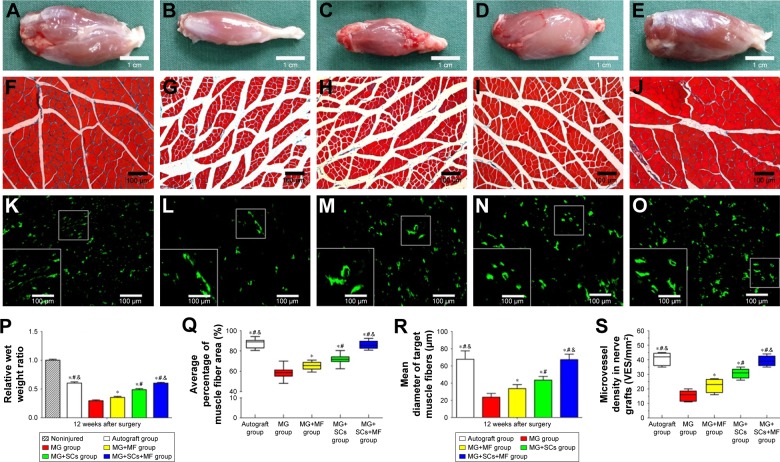
Peripheral nerve repair is still challenging for surgeons. Autologous nerve transplantation is the acknowledged therapy; however, its application is limited by the scarcity of available donor nerves, donor area morbidity, and neuroma formation. Biomaterials for engineering artificial nerves, particularly materials combined with supportive cells, display remarkable promising prospects. Schwann cells (SCs) are the absorbing seeding cells in peripheral nerve engineering repair; however, the attenuated biologic activity restricts their application. In this study, a magnetic nanocomposite scaffold fabricated from magnetic nanoparticles and a biodegradable chitosan-glycerophosphate polymer was made. Its structure was evaluated and characterized. The combined effects of magnetic scaffold (MG) with an applied magnetic field (MF) on the viability of SCs and peripheral nerve injury repair were investigated. The magnetic nanocomposite scaffold showed tunable magnetization and degradation rate. The MGs synergized with the applied MF to enhance the viability of SCs after transplantation. Furthermore, nerve regeneration and functional recovery were promoted by the synergism of SCs-loaded MGs and MF. Based on the current findings, the combined application of MGs and SCs with applied MF is a promising therapy for the engineering of peripheral nerve regeneration.

Keywords: Schwann cell; functional recovery; magnetic field; magnetic nanoparticle; nanocomposite; peripheral nerve repair.


Conflict of interest statement

Disclosure The authors report no conflicts of interest in this work.

Figures

Figure 1
Figure 1
Schematic of this study. Notes: (A) Time scale. (B) The SCs-loaded magnetic scaffold bridging 15 mm sciatic nerve defect in rats under the microscope. (CE) Double immunofluorescent staining shows positive S-100 and SOX-10 with DAPI nuclear counterstaining. (F) Merged image shows a high purity of SCs (>97%). (G) The schematic diagram of the main process of the experiment. Abbreviations: DAPI, 4′,6-diamidino-2-phenylindole; SCs, Schwann cells.
Figure 2
Figure 2
The features of MNPs and the general view and magnetization of the magnetic scaffold. Notes: (A) TEM of MNPs. (B) Size distribution of MNPs. (C) XRD. (D) Magnetization of MNPs. (E) The view of nonmagnetic scaffold and magnetic scaffold. (F and G) Pictures exhibiting the magnetic attraction under a magnet. (H) The magnetization of the magnetic scaffold was performed by VSM. Abbreviations: MNPs, magnetic nanoparticles; TEM, transmission electron microscopy; XRD, X-ray diffraction; VSM, vibrating sample magnetometer.
Figure 3
Figure 3
The morphology of the nonmagnetic and magnetic scaffolds. Notes: (A) The length of the magnetic scaffold. (B, C, G, and H) The general and cross-sectional appearance of the magnetic and nonmagnetic scaffolds under stereomicroscope, respectively. (D and I) The general structures of the magnetic and nonmagnetic scaffolds under SEM, respectively. (E and J) Representative transverse photographs of the magnetic and nonmagnetic scaffolds, showing that the microarrays were formed in a honeycomb-shaped characteristic. (F and K) Representative longitudinal photographs of the magnetic and nonmagnetic scaffolds, displaying the interconnected cellular architecture and lengthwise oriented microchannels. Abbreviation: SEM, scanning electron microscopy.
Figure 4
Figure 4
The weight loss and the magnetization variations during the degradation time. Notes: (A) The weight loss of the nonmagnetic scaffold and magnetic scaffold during 16 weeks. (B) The MH and ML variations of the magnetic scaffold in the process of weight loss during 16 weeks. Abbreviations: MF, magnetic field; MH, the magnetization at high MF of 8 kOe; ML, the magnetization measure at low MF of 34 Oe.
Figure 5
Figure 5
In vivo response of the nerve to the magnetic scaffold. Notes: (A) The representative images of the area surrounding both the sciatic nerve and the non-MG at 1 week postoperation. (B) The representative images of the area surrounding both the sciatic nerve and the non-MG at 12 weeks postoperation. (C) The representative images of the area surrounding both the sciatic nerve and the MG at 1 week postoperation. (D) The representative images of the area surrounding both the sciatic nerve and the MG at 12 weeks postoperation. Abbreviations: MG, magnetic scaffold; non-MG, nonmagnetic scaffold.
Figure 6
Figure 6
Effect of SCs’ viability in magnetic scaffold in vivo. Notes: (A, C, E, and G) Live/dead staining of SCs on day 0, 3, 7, and 14 in MG+SCs group postoperation, respectively. (B, D, F, and H) Live/dead staining of SCs on day 0, 3, 7, and 14 in MG+SCs+MF group postoperation, respectively. (I) Quantification of live SCs from images on day 0, 3, 7, and 14. **p<0.01; all results are expressed as the mean ± SD. Abbreviations: MG+SCs, the rats were bridged with the Schwann cells-loaded magnetic scaffold; MG+SCs+MF, the rats were bridged with the Schwann cells-loaded magnetic scaffold and under MF after surgery; MF, magnetic field; SCs, Schwann cells.
Figure 7
Figure 7
Morphologic appearance and morphometric assessments of regenerated nerves in each group. Notes: (AE) The characteristic toluidine blue photographs of regenerated axons in the autograft group, MG group, MG+MF group, MG+SCs group, and MG+SCs+MF group at 12 weeks postoperation, respectively. (FO) The characteristic electron micrographs of regenerated axons in the middle part of the scaffold in the (F) autograft group, (G) MG group, (H) MG+MF group, (I) MG+SCs group, and (J) MG+SCs+MF group at 12 weeks postoperation. (KO) The characteristic electron micrographs of myelin sheath in the middle part of the scaffold in the autograft group, MG group, MG+MF group, MG+SCs group, and MG+SCs+MF group at 12 weeks postoperation. (P) The cross-sectional area of regenerated nerves in the scaffold. (Q) Quantitative analysis of myelinated axons in the scaffold. (R) The diameter of myelinated axons in the scaffold. (S) The G-ratios in the scaffold. *p<0.05 compared to MG group; #p<0.05 compared to MG+MF group; &p<0.05 compared to MG+SCs group; all results are expressed as the mean ± standard error of mean. Abbreviations: MG, the rats were bridged with the magnetic scaffold; MG+MF, the rats were bridged with the magnetic scaffold and under MF exposure after surgery; MG+SCs, the rats were bridged with the Schwann cells-loaded magnetic scaffold; MG+SCs+MF, the rats were bridged with the Schwann cells-loaded magnetic scaffold and under MF after surgery; MF, magnetic field; SCs, Schwann cells.
Figure 8
Figure 8
Double immunofluorescence assay for S-100 and NF200 in each group. Notes: (AD) Characteristic photographs of the regenerated nerves in the autograft group. (EH) Characteristic photographs of the regenerated nerves in the MG group. (IL) Characteristic photographs of the regenerated nerves in the MG+MF group. (MP) Characteristic photographs of the regenerated nerves in the MG+SCs group. (QT) Characteristic photographs of the regenerated nerves in the MG+SCs+MF group. Abbreviations: MG, the rats were bridged with the magnetic scaffold; MG+MF, the rats were bridged with the magnetic scaffold and under MF exposure after surgery; MG+SCs, the rats were bridged with the Schwann cells-loaded magnetic scaffold; MG+SCs+MF, the rats were bridged with the Schwann cells-loaded magnetic scaffold and under MF after surgery; MF, magnetic field; SCs, Schwann cells.
Figure 9
Figure 9
The sciatic functional index in each group. Notes: (A) The operative left footprints at 12 weeks postoperatively; (ae) autograft group, MG group, MG+MF group, MG+SCs group, and MG+SCs+MF group. (B) The statistical data of the sciatic functional index. (C) The hind paw withdrawal latency time. *p<0.05 compared to MG group; #p<0.05 compared to MG+MF group; &p<0.05 compared to MG+SCs group; all results are presented as the mean ± standard eror of the mean. Abbreviations: MG, the rats were bridged with the magnetic scaffold; MG+MF, the rats were bridged with the magnetic scaffold and under MF exposure after surgery; MG+SCs, the rats were bridged with the Schwann cells-loaded magnetic scaffold; MG+SCs+MF, the rats were bridged with the Schwann cells-loaded magnetic scaffold and under MF after surgery; ns, not significant; MF, magnetic field; SCs, Schwann cells; IT, intermediary toe spread (distance between the second and the fourth toe); PL, print length (distance between the heel and the top of the third toe); TS, toe spread (distance between the first and the fifth toe).
Figure 10
Figure 10
Retrograde FG tracing in each group. Notes: (AE) FG-positive spinal motoneurons in autograft group, MG group, MG+MF group, MG+SCs group, and MG+SCs+MF group, respectively. (FJ) FG-positive DRG sensory neurons in autograft group, MG group, MG+MF group, MG+SCs group, and MG+SCs+MF group, respectively. (K and L) The quantitative analysis of FG-positive motoneurons and sensory neurons in all groups, respectively. *p<0.05 compared to MG group; #p<0.05 compared to MG+MF group; &p<0.05 compared to MG+SCs group; all results are expressed as the mean ± standard error of mean. Abbreviations: FG, Fluoro-Gold; SCs, Schwann cells; MG, the rats were bridged with the magnetic scaffold; MG+MF, the rats were bridged with the magnetic scaffold and under MF exposure after surgery; MG+SCs, the rats were bridged with the Schwann cells-loaded magnetic scaffold; MG+SCs+MF, the rats were bridged with the Schwann cells-loaded magnetic scaffold and under MF after surgery; MF, magnetic field.
Figure 10
Figure 10
Retrograde FG tracing in each group. Notes: (AE) FG-positive spinal motoneurons in autograft group, MG group, MG+MF group, MG+SCs group, and MG+SCs+MF group, respectively. (FJ) FG-positive DRG sensory neurons in autograft group, MG group, MG+MF group, MG+SCs group, and MG+SCs+MF group, respectively. (K and L) The quantitative analysis of FG-positive motoneurons and sensory neurons in all groups, respectively. *p<0.05 compared to MG group; #p<0.05 compared to MG+MF group; &p<0.05 compared to MG+SCs group; all results are expressed as the mean ± standard error of mean. Abbreviations: FG, Fluoro-Gold; SCs, Schwann cells; MG, the rats were bridged with the magnetic scaffold; MG+MF, the rats were bridged with the magnetic scaffold and under MF exposure after surgery; MG+SCs, the rats were bridged with the Schwann cells-loaded magnetic scaffold; MG+SCs+MF, the rats were bridged with the Schwann cells-loaded magnetic scaffold and under MF after surgery; MF, magnetic field.
Figure 11
Figure 11
Weighting and histology of target gastrocnemius muscle, and quantification of microvessel density (MVD) in each group. Notes: (AE) The morphology of the gastrocnemius muscle in the autograft group, MG group, MG+MF group, MG+SCs group, and MG+SCs+MF group at 12 weeks postoperation, respectively. (FJ) The characteristic light photographs of the cross-sectional gastrocnemius muscle following Masson trichrome staining (from left to right: the autograft group, MG group, MG+MF group, MG+SCs group, and MG+SCs+MF group) at 12 weeks postoperation. (KO) The characteristic photographs of MVD staining (from left to right: the autograft group, MG group, MG+MF group, MG+SCs group, and MG+SCs+MF group) at 12 weeks postoperation, respectively. (P) The relative wet weight ratio in each group is shown. (Q) The mean percentage area of muscle fibers in each group is shown. (R) The average diameter of muscle fibers in each group is shown. (S) The quantitative analysis of MVD in each group is shown. *p<0.05 compared to MG group; #p<0.05 compared to MG+MF group; &p<0.05 compared to MG+SCs group; all results are expressed as the mean ± SD. Abbreviations: MG, the rats were bridged with the magnetic scaffold; MG+MF, the rats were bridged with the magnetic scaffold and under MF exposure after surgery; MG+SCs, the rats were bridged with the Schwann cells-loaded magnetic scaffold; MG+SCs+MF, the rats were bridged with the Schwann cells-loaded magnetic scaffold and under MF after surgery; SCs, Schwann cells; MF, magnetic field.

Similar articles

Cited by

References

    1. Sulaiman OA, Gordon T. Effects of short- and long-term schwann cell denervation on peripheral nerve regeneration, myelination, and size. Glia. 2000;32(3):234–246. - PubMed
    1. Pabari A, Yang SY, Mosahebi A, et al. Recent advances in artificial nerve conduit design: strategies for the delivery of luminal fillers. J Control Release. 2011;156(1):2–10. - PubMed
    1. Jaquet JB, Luijsterburg AJ, Kalmijn S, et al. Median, ulnar, and combined median-ulnar nerve injuries: functional outcome and return to productivity. J Trauma. 2001;51(4):687–692. - PubMed
    1. Jiang X, Lim SH, Mao HQ, et al. Current applications and future perspectives of artificial nerve conduits. Exp Neurol. 2010;223(1):86–101. - PubMed
    1. Hu X, Huang J, Ye Z, et al. A novel scaffold with longitudinally oriented microchannels promotes peripheral nerve regeneration. Tissue Eng Part A. 2009;15(11):3297–3308. - PubMed

LinkOut - more resources