Comparison of spontaneous brain activity revealed by regional homogeneity in AQP4-IgG neuromyelitis optica-optic neuritis versus MOG-IgG optic neuritis patients: a resting-state functional MRI study
- PMID: 29123400
- PMCID: PMC5661477
- DOI: 10.2147/NDT.S145183
Comparison of spontaneous brain activity revealed by regional homogeneity in AQP4-IgG neuromyelitis optica-optic neuritis versus MOG-IgG optic neuritis patients: a resting-state functional MRI study
Abstract
Objective: Many previous studies have demonstrated that neuromyelitis optica (NMO) patients have abnormalities of brain anatomy and function. However, differences in spontaneous brain activity between myelin oligodendrocyte glycoprotein (MOG)-IgG ON and aquaporin 4(AQP4)-neuromyelitis optica-optic neuritis (ON) remain unknown. In the current study, we investigated the brain neural homogeneity in MOG-IgG ON versus AQP4-IgG NMO-ON subjects by regional homogeneity (ReHo) method using magnetic resonance imaging (MRI).
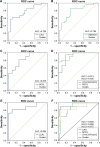
Patients and methods: A total of 32 NMO-ON and ON subjects (21 with AQP4-IgG+NMO-ON and 11 with MOG-IgG+ON) and 34 healthy controls (HCs) closely matched for age were recruited, and scans were performed for all subjects. A one-way analysis of variance (ANOVA) was performed to determine the regions in which the ReHo was different across the three groups. NMO-ON and ON subjects were distinguished from HCs by a receiver operating characteristic (ROC) curve. The relationship between the mean ReHo in many brain regions and clinical features in NMO subjects was calculated by Pearson correlation analysis.
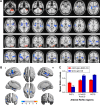
Results: Compared with HCs, MOG-IgG+ON subjects had significantly decreased ReHo values in the posterior lobe of the left cerebellum and increased ReHo values in the left inferior frontal gyrus, right prefrontal gyrus, and left precentral/postcentral gyrus. AQP4-IgG+NMO-ON subjects showed higher ReHo values in the left inferior frontal gyrus and right middle temporal/occipital gyrus. Compared with MOG-IgG+ON subjects, AQP4-IgG+NMO-ON subjects had lower ReHo values in the posterior lobe of the right cerebellum. AQP4-Ig+NMO-ON subjects showed higher ReHo values in the left precentral/postcentral gyrus and right superior temporal gyrus.
Conclusion: AQP4-IgG+NMO-ON and MOG-IgG+ON subjects showed abnormal synchronized neuronal activity in many brain regions, which is consistent with deficits in visual, motor, and cognitive function. Furthermore, different patterns of synchronized neuronal activity occurred in the AQP4-IgG+NMO-ON and MOG-IgG+ON.
Keywords: AQP4-IgG; MOG-IgG; functional magnetic resonance imaging; neuromyelitis optica-optic neuritis; regional homogeneity; resting state.
Conflict of interest statement
Disclosure The authors report no conflicts of interest in this work.
Figures


Similar articles
-
Complement activating antibodies to myelin oligodendrocyte glycoprotein in neuromyelitis optica and related disorders.J Neuroinflammation. 2011 Dec 28;8:184. doi: 10.1186/1742-2094-8-184. J Neuroinflammation. 2011. PMID: 22204662 Free PMC article.
-
Persisting myelin oligodendrocyte glycoprotein antibodies in aquaporin-4 antibody negative pediatric neuromyelitis optica.Mult Scler. 2013 Jul;19(8):1052-9. doi: 10.1177/1352458512470310. Epub 2012 Dec 20. Mult Scler. 2013. PMID: 23257621
-
Neuromyelitis optica spectrum disorders with antibodies to myelin oligodendrocyte glycoprotein or aquaporin-4: Clinical and paraclinical characteristics in Algerian patients.J Neurol Sci. 2017 Oct 15;381:240-244. doi: 10.1016/j.jns.2017.08.3254. Epub 2017 Aug 31. J Neurol Sci. 2017. PMID: 28991690
-
AQP4-IgG and MOG-IgG Related Optic Neuritis-Prevalence, Optical Coherence Tomography Findings, and Visual Outcomes: A Systematic Review and Meta-Analysis.Front Neurol. 2020 Oct 8;11:540156. doi: 10.3389/fneur.2020.540156. eCollection 2020. Front Neurol. 2020. PMID: 33132999 Free PMC article.
-
Optic neuritis in the era of biomarkers.Surv Ophthalmol. 2020 Jan-Feb;65(1):12-17. doi: 10.1016/j.survophthal.2019.08.001. Epub 2019 Aug 16. Surv Ophthalmol. 2020. PMID: 31425702 Review.
Cited by
-
Comprehensive review of neuromyelitis optica and clinical characteristics of neuromyelitis optica patients in Puerto Rico.Surg Neurol Int. 2018 Dec 3;9:242. doi: 10.4103/sni.sni_224_18. eCollection 2018. Surg Neurol Int. 2018. PMID: 30603227 Free PMC article. Review.
-
A Longitudinal Comparison of the Recovery Patterns of Optic Neuritis with MOG Antibody-Seropositive and AQP4 Antibody-Seropositive or -Seronegative for Both Antibodies.J Ophthalmol. 2022 Mar 22;2022:4951491. doi: 10.1155/2022/4951491. eCollection 2022. J Ophthalmol. 2022. PMID: 35360549 Free PMC article.
-
Pregnancy and antibody-mediated CNS disorders: What do we know and what should we know?Front Neurol. 2022 Dec 19;13:1048502. doi: 10.3389/fneur.2022.1048502. eCollection 2022. Front Neurol. 2022. PMID: 36601293 Free PMC article. Review.
-
Aberrant spontaneous brain activity in patients with thyroid-associated ophthalmopathy with and without optic neuropathy: a resting-state functional MRI study.Eur Radiol. 2023 Nov;33(11):7981-7991. doi: 10.1007/s00330-023-09829-0. Epub 2023 Jul 6. Eur Radiol. 2023. PMID: 37410107
References
-
- Lu Z, Qiu W, Zou Y, et al. Characteristic linear lesions and longitudinally extensive spinal cord lesions in Chinese patients with neuromyelitis optica. J Neurol Sci. 2010;293(1–2):92–96. - PubMed
-
- Siuko M, Tienari PJ, Saastamoinen KP, et al. Neuromyelitis optica and aquaporin-4 (AQP4) autoantibodies in consecutive optic neuritis patients in Southern Finland. Acta Ophthalmol. 2014;92(4):387–391. - PubMed
-
- Luppe S, Robertson NP. MOG-IgG in neuromyelitis optica. J Neurol. 2014;261(3):640–642. - PubMed
LinkOut - more resources
Full Text Sources
Other Literature Sources
Miscellaneous

