. 2017 Oct 23:11:592.
doi: 10.3389/fnins.2017.00592. eCollection 2017.

A Model-Based Approach for Separating the Cochlear Microphonic from the Auditory Nerve Neurophonic in the Ongoing Response Using Electrocochleography

Affiliations

A Model-Based Approach for Separating the Cochlear Microphonic from the Auditory Nerve Neurophonic in the Ongoing Response Using Electrocochleography

Tatyana E Fontenot et al. Front Neurosci. .

Abstract

Electrocochleography (ECochG) is a potential clinically valuable technique for predicting speech perception outcomes in cochlear implant (CI) recipients, among other uses. Current analysis is limited by an inability to quantify hair cell and neural contributions which are mixed in the ongoing part of the response to low frequency tones. Here, we used a model based on source properties to account for recorded waveform shapes and to separate the combined signal into its components. The model for the cochlear microphonic (CM) was a sinusoid with parameters for independent saturation of the peaks and the troughs of the responses. The model for the auditory nerve neurophonic (ANN) was the convolution of a unit potential and population cycle histogram with a parameter for spread of excitation. Phases of the ANN and CM were additional parameters. The average cycle from the ongoing response was the input, and adaptive fitting identified CM and ANN parameters that best reproduced the waveform shape. Test datasets were responses recorded from the round windows of CI recipients, from the round window of gerbils before and after application of neurotoxins, and with simulated signals where each parameter could be manipulated in isolation. Waveforms recorded from 284 CI recipients had a variety of morphologies that the model fit with an average r2 of 0.97 ± 0.058 (standard deviation). With simulated signals, small systematic differences between outputs and inputs were seen with some variable combinations, but in general there were limited interactions among the parameters. In gerbils, the CM reported was relatively unaffected by the neurotoxins. In contrast, the ANN was strongly reduced and the reduction was limited to frequencies of 1,000 Hz and lower, consistent with the range of strong neural phase-locking. Across human CI subjects, the ANN contribution was variable, ranging from nearly none to larger than the CM. Development of this model could provide a means to isolate hair cell and neural activity that are mixed in the ongoing response to low-frequency tones. This tool can help characterize the residual physiology across CI subjects, and can be useful in other clinical settings where a description of the cochlear physiology is desirable.

Keywords: auditory hair cells; auditory nerve; auditory nerve model; cochlear physiology; computational modeling; electrophysiology; modeling and simulations.


Figures

Figure 1
Figure 1
Electrocochleography (ECochG) response to a tone burst from a human CI subject. (A) A Human ECochG response to a 500 Hz tone burst presented in condensation phase. The ongoing portion is highlighted (green area). The CAP is shown in red. (B) Each cycle in the ongoing response (dashed lines) and the “average cycle” (solid line). The presence of the ANN causes distortions in the response compared to a reference sinusoid (dotted line).
Figure 2
Figure 2
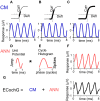
Conceptual basis of the model for the ongoing part of the ECochG response to low frequency tones. (A–C) The CM. To a low stimulus intensity (A), the hair cell stereociliary motion and channel openings operate symmetrically within the input-output function (top, black bar), producing a sinusoidal CM response (bottom). (B) With increasing stimulus intensity, asymmetric saturation can occur if the operating point (average state of the channels at rest) is displaced from the center of the function (top), producing a CM saturated only to one side of motion, in this case the trough of the CM (bottom). (C) With a high stimulus intensity, symmetric saturation occurs with maximal deflection at both ends of the oscillation (top), creating a CM with saturation to both the peak and trough. (D–F) The ANN is created by the convolution (*) of the unit potential (D) and the population cycle histogram (E). The unit potential is the shape of a single action potential at the round window, and the cycle histogram is the sum of action potential firing in the population of the across all responding nerve fibers. Because the cycle histogram is derived by folding the periods in the post-stimulus time histogram, this process is identical to that previously modeled to produce the CAP (see text for references). The non-linearities inherent in this process will always create a distorted version of the cyclic response (F). (G) The ongoing ECochG represents the sum of the CM and ANN.
Figure 3
Figure 3
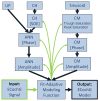
Block diagram for fitting an observed ECochG to model parameters. The ongoing portion of a recorded/input ECochG signal (lower left corner) is the basis for a fit-adaptive modeling function (center, bottom). To estimate the hair cell contribution (right column), the fitting function generates a sinusoidal CM at the stimulus frequency and optimizes the coefficients for amplitude and phase, and saturation of the peaks and troughs of the response. To estimate the neural contribution (left column), a unit potential is convolved with a cycle histogram of variable spread of excitation (SOE) and the resulting ANN amplitude and phase are also optimized. The output of the model is the estimated ongoing ECochG and its associated CM and ANN parameters (lower right corner).
Figure 4
Figure 4
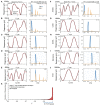
Model fits to ECochG responses in human subjects. (A–E) Responses from different subjects to 250 Hz (A,B) or 500 Hz (C–E) show that the output of the model (left panels, red, dotted line) is able to reproduce the wide variety of waveforms seen in human CI subjects (solid black lines). From the model, the spectra of the CM and ANN used to produce the fit can be produced (right panels). For each case the linear fit between the two curves was described by the r2 value, and the ANN/CM ratio is given for the spectra. (F–J) Similar to the previous examples, except these cases are from subjects with different hearing loss etiologies, to indicate the heterogeneity of causes leading to cochlear implantation (ANSD, auditory nerve spectrum disorder; CND, cochlear nerve deficiency, SNHL, unknown cause of sensineural hearing loss; Meniere's, Meniere's disease; EVA, enlarge vestibular aqueduct). The responses are shown in order of increasing stimulus frequency. The spectrum of the ANN is slightly displaced for clarity. (K) Across all recordings (n = 1,126) from 284 subjects, the model was able to fit observed ECochG signals with an mean r2 of 0.97 ± 0.058 (standard deviation).
Figure 5
Figure 5
Waveforms generated using simulated signals varied in phase. (A) When the CM and ANN are in phase, the waveform is only slightly distorted, and the amplitude is maximal. (B) When the CM and ANN are ¼ cycle out of phase, the distortion increases. (C) When the CM and ANN are ½ cycle out of phase the distortion is even greater and the overall response magnitude is at a minimum.
Figure 6
Figure 6
Parametric examination of model outputs to simulated signals. The parameter varied is changed along the columns (A–E), and the responses obtained for each parameter is varied by row. (A) The ANN amplitude was gradually increased from 0.01 to 2 μV with CM amplitude of 1 μV, no phase difference between the two signal components or trough or peak saturation, and SOE of 0.65 cycles. (B) The phase difference between the two CM and ANN was gradually increased from −0.5 to 0.5 cycle while CM amplitude was 1 μV, no trough or peak saturation, and ANN amplitude was 0.3 μV with SOE of 0.65 cycle. (C) The trough saturation of the CM component was varied from 0 to 15% of the CM amplitude with no peak saturation, the ANN amplitude was 0.3 μV in dB and SOE 0.65 cycles while the phase difference between the two signal components was zero. (D) The degree of peak saturation of CM was varied from zero to approximately 10% of the CM amplitude of 1 μV while trough saturation was stable at 15% of the CM amplitude; ANN amplitude was 0.43 μV in dB, SOE 0.65 cycles and phase difference between the two components zero. (E) The SOE increased from 0.35 to 0.65 cycles while the CM amplitude was 1 μV, ANN amplitude was 0.3 μV and no trough or peak saturation and the phase difference between these two signal components was zero.
Figure 7
Figure 7
Examples of waveforms and frequency spectra of ECochG signals in response to 500 Hz tone burst at 50 dB SPL (A). Three examples (1–3) recorded prior to KA. The waveforms shown strong distortions and in the ECochG and model waveforms (top panels) and the ANN has multiple harmonics in its spectra (bottom panels). Both sets of data were normalized by the maximum response. The numbers in the spectra represent the ANN/CM ratio. The CM is not shown. (B–D) Three examples each (1–3) recorded after KA, TTX, and OA, respectively. The waveforms show less distortion and smaller ANN/CM ratios, although the ANN is not completely removed in most cases. The cases (1–3) are in order of least to most remaining ANN for that drug. The Pre-Drug condition for TTX and OA are not shown, but were similar to that for Pre-KA.
Figure 8
Figure 8
The CM, ANN, and ANN/CM index reported by the model as functions of frequency and intensity. (A) The Pre-KA condition. The CM shows an orderly pattern of CM across frequency and intensity, with no cut-off to higher frequencies. The arrow represents a small discontinuity to low frequencies (750 and 1,000 Hz) and intensities (30–50 dB SPL). The ANN shows a low-pass cut-off to frequencies >1,000 Hz. However, a non-linearity was introduced—all responses where the ANN/CM ratio was <5% were considered no response (see Text for further explanation). The ANN/CM index, where no non-linearity was introduced, also showed the low pass cut-off to frequencies >1,000 Hz. (B–D) Responses after KA, TTX, and OA, respectively. The Pre-Drug condition for TTX and OA are not shown, but were similar to that for Pre-KA. A smaller range of frequencies and intensities was tested with TTX and OA that with KA. In general, the CM was little affected by the neurotoxin. However, the discontinuity seen in the CM was not present after KA (arrow). The ANN/CM index was also reduced to low intensities, but was already small at high intensities so a change was difficult to detect. The reduction in the ANN and ANN/CM index was greater for KA and TTX than OA. Errors bars are standard deviation.
Figure 9
Figure 9
Difference in the CM (top row) and ANN (bottom row) before and after application of vehicle only or vehicle + neurotoxins. Each subtraction is paired between the Pre and Post data for each animal. (A,C) Control cases where vehicle only was applied to the round window. For the lactated Ringer's (LR) there was a small reduction in both the CM and ANN that could be related to the passage of time (A). For the artificial perilymph (AP), the smaller frequency, and intensity range decreased the time between recordings, and the reduction in the CM and ANN was smaller (C). (B,D,E) Responses after KA, TTX, and OA, respectively. After KA (B), the reduction in the CM to 750 and 1,000 Hz, also shown in the previous figure, was greatest to the lowest intensity (arrow). After TTX (D), the reduction in the ANN was large at 500 and 1,000 Hz, and similar to controls the higher frequencies. After OA (E), the reduction to the lower frequencies was smaller than with KA or TTX. Errors bars are standard deviation.
Figure 10
Figure 10
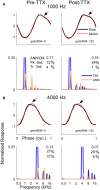
Examples of average cycle waveforms and frequency spectra in response to tone bursts at 80 dB SPL. These examples depict a particular type of ECochG response that does not conform to the shapes expected for CM. To the 1,000 Hz (A) and 4,000 Hz stimuli (B) there was a sloping response to the clipped peak of the average cycle (arrows). To a 1,000 Hz stimulus at this sound level the ANN should be a relatively small proportion of the response, and smaller still after TTX. For the 4,000 Hz stimulus there should be little or no ANN either before or after TTX. Thus, these waveforms are likely to be nearly-pure CM. The model did capture considerable clipping of the CM, indicated by the large saturation values reported for the peak (Pk. Sat.) and smaller values for the trough (Tr. Sat.). However, the spectrum of each modeled waveform showed considerable ANN even after TTX, suggesting the model interpreted the sloping shape of the CM as ANN. The waveforms and the spectra are normalized to the amplitude of CM contribution measured by the model. The CM of the first harmonic is off-scale to emphasize the higher harmonics, which were present due to the clipping. The spectrum of the ANN is slightly displaced for clarity.
Figure 11
Figure 11
The CM and ANN in human CI subjects. (A) In 249 subjects with significant responses (see section Methods) to 500 Hz tone bursts at 90 dB HL the ANN amplitude was generally smaller than the CM (below the line of equality, dashed) but the two were positively correlated (r = 0.75, p < 0.001). Symbols with an X had an ANN/CM ratio <0.05. (B) The ANN/CM index of the same subjects. On this scale an index of−1 is all CM, 0 is equal amount of CM and ANN, and 1 is all ANN. Usually the CM was greater than the ANN, although in a number of cases they were nearly equal, and in a few the ANN was larger than the CM (C–E). The CM (C), ANN (D), and ANN/CM index (D) as a function of frequency and with the parameter of “nerve score,” which is a subjective scaling of the neural activity in each cases based on visual observation of the CM and ANN. There was no trend for the subjective nerve activity to reflect the size of the CM, in contrast, the size of the ANN and the ANN/CM index reflected the nerve activity. Both also showed low-pass filtering of similar to that in gerbil. The responses included for each frequency had to be significant (see section Methods) so the numbers of cases differ by a small amount for 250–1,000 Hz (>80% of cases have significant responses to these frequencies) but are fewer to 2 and 4 kHz (43 and 26%, respectively). Errors bars in (C–E) are standard error.

Similar articles

Cited by

References

    1. Abbas P. J., Tejani V. D., Scheperle R. A., Brown C. J. (2017). Using neural response telemetry to monitor physiological responses to acoustic stimulation in hybrid cochlear implant users. Ear Hear. 38, 409–425. 10.1097/AUD.0000000000000400 - DOI - PMC - PubMed
    1. Adunka O. F., Mlot S., Suberman T. A., Campbell A. P., Surowitz J., Buchman C. A., et al. . (2010). Intracochlear recordings of electrophysiological parameters indicating cochlear damage. Otol. Neurotol. 31, 1233–1241. 10.1097/MAO.0b013e3181f1ffdf - DOI - PMC - PubMed
    1. Bester C. W., Campbell L., Dragovic A., Collins A., O'Leary S. J. (2017). Characterizing electrocochleography in cochlear implant recipients with residual low-frequency hearing. Front. Neurosci. 11:141. 10.3389/fnins.2017.00141 - DOI - PMC - PubMed
    1. Calloway N. H., Fitzpatrick D. C., Campbell A. P., Iseli C., Pulver S., Buchman C. A., et al. . (2014). Intracochlear electrocochleography during cochlear implantation. Otol. Neurotol. 35, 1451–1457. 10.1097/MAO.0000000000000451 - DOI - PubMed
    1. Campbell L., Kaicer A., Briggs R., O'Leary S. (2015). Cochlear response telemetry: intracochlear electrocochleography via cochlear implant neural response telemetry pilot study results. Otol. Neurotol. 36, 399–405. 10.1097/MAO.0000000000000678 - DOI - PubMed

LinkOut - more resources