. 2017 Oct 26:10:344.
doi: 10.3389/fnmol.2017.00344. eCollection 2017.

Suppression of Inflammatory Demyelinaton and Axon Degeneration through Inhibiting Kv3 Channels

Affiliations

Suppression of Inflammatory Demyelinaton and Axon Degeneration through Inhibiting Kv3 Channels

Peter Jukkola et al. Front Mol Neurosci. .

Abstract

The development of neuroprotective and repair strategies for treating progressive multiple sclerosis (MS) requires new insights into axonal injury. 4-aminopyridine (4-AP), a blocker of voltage-gated K+ (Kv) channels, is used in symptomatic treatment of progressive MS, but the underlying mechanism remains unclear. Here we report that deleting Kv3.1-the channel with the highest 4-AP sensitivity-reduces clinical signs in experimental autoimmune encephalomyelitis (EAE), a mouse model for MS. In Kv3.1 knockout (KO) mice, EAE lesions in sensory and motor tracts of spinal cord were markedly reduced, and radial astroglia were activated with increased expression of brain derived neurotrophic factor (BDNF). Kv3.3/Kv3.1 and activated BDNF receptors were upregulated in demyelinating axons in EAE and MS lesions. In spinal cord myelin coculture, BDNF treatment promoted myelination, and neuronal firing via altering channel expression. Therefore, suppressing Kv3.1 alters neural circuit activity, which may enhance BNDF signaling and hence protect axons from inflammatory insults.

Keywords: 4-aminopyridine; brain derived neurotrophic factor; experimental autoimmune encephalomyelitis; multiple sclerosis; radial astroglia; voltage-gated K+ channel.


Figures

Figure 1
Figure 1
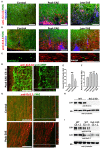
Deleting Kv3.1 channel reduces EAE severity through lesion reduction. (A) Reduction of EAE severity in Kv3.1 KO mice (n = 9) compared to WT mice (n = 8). (B) Alterations of mouse body weight during EAE progression. (C) EAE lesions in control mice. Cross sections of spinal cord (top, thoracic; middle, cervical) and coronal section of the cerebellum (bottom) were stained with FluoroMyelin Green (FMG; green) and nuclear dye (Hoechst; red). CS, clinical score. Dorsal, lateral, and ventral funiculi were indicated with blue arrows. (D) EAE lesions at the late stage in WT mice. (E) EAE lesions at the late stage in Kv3.1 KO mice. White arrowheads, lesions. Scale bars, 250 μm. (F) The summary of EAE lesion areas in dorsal, ventral and lateral funiculi white matter in WT and Kv3.1 KO mice. EAE mice at 60 DPI were examined. Unpaired t–test: *p < 0.05. (G) Correlations between clinical scores and lesion areas in WT and Kv3.1 KO mice in dorsal funiculus. (H) Correlations between clinical scores and lesion areas in WT and Kv3.1 KO mice in lateral and ventral funiculi. (C–H) 6 wild type mice and 4 Kv3.1 KO mice were used. About 20 images for each mouse were used for quantification of lesion areas.
Figure 2
Figure 2
Efficacy of immune cells from Kv3.1 KO mice in adoptive transfer EAE. (A) Diagram of adoptive transfer EAE. First, chronic EAE was induced with MOG35–55 on both Kv3.1 KO mice and WT littermates. At 14 DPI when clear EAE signs were observed, their splenocytes were removed and cultured in vitro with stimulation by MOG35–55 for 3 days. These cells were then transferred into WT C57BL/6 mice. (B) No significant differences in cytokine production between Kv3.1 KO and WT cells was observed. The levels of IFNγ, IL-17, IL-10, and GM-CSF were measured in the supernatants by ELISA. (C) No significant difference in EAE clinical scores was observed between the mice that received WT lymphocytes and those that received Kv3.1 KO lymphocytes.
Figure 3
Figure 3
Axonal Kv3.1 and Kv3.3 channels increased during EAE progression. (A), Cross sections of SC ventral funiculus in WT mice at the control, peak, and late EAE stages stained with FMG (green), Hoechst (blue), and an anti-Kv3.1b antibody (red). (B) Similar cross sections stained for Kv3.3 (red). (C) SC longitudinal section from a control mouse was stained for Kv1.2 (green) and Kv3.3 (red). (D) Upregulated Kv3.1 in axonal segments that were partially demyelinated (anti-Kv3.1b in red and anti-MBP in green) at the peak stage of EAE. The high magnification confocal image stack was obtained from a lesion area in a longitudinal SC section. The collapsed 2D image is on the left, and three cross sections are on the right. White arrows, positions for the other two cross sections. (E) Summary of axonal levels of Kv3.1b at three different stages of EAE. One-way ANOVA followed by Dunnett's test. **p < 0.01; *p < 0.05. n = 50. (F) Axonal Kv3.3 levels were upregulated during EAE (anti-Kv3.3 in red and FMG in green). Top, control; bottom, peak EAE. High magnification confocal image stacks were obtained from longitudinal SC sections. The collapsed 2D images are on the left, and 3 cross sections are on the right. Scale bars, 50 μm. (G) Summary of axonal levels of Kv3.3 at three different stages of EAE in WT and Kv3.1 KO mice. One-way ANOVA followed by Dunnett's test. **p < 0.01; *p < 0.05. n = 50. (H) Confirmation of no Kv3.1 expression in Kv3.1 KO mice by Western blotting. (I) Alterations of Kv3.1b (middle) and Kv3.3 (bottom) levels during EAE in WT and Kv3.1 KO mice.
Figure 4
Figure 4
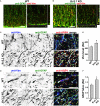
Upregulation of astrocytic intermediate filaments in Kv3.1 KO mice. (A) Cross sections of ventral SCWM in WT mice were costained for GFAP (green) and Vim (red). The collapsed 2D image is on the left, and three cross sections are on the right. (B) Cross sections of ventral SCWM in Kv3.1 KO mice were costained for GFAP (green) and Vim (red). Scale bars, 200 μm. (C), Increased expression of Vim (inverted gray scale image on the left; blue in the merged image on the right), GFAP (inverted gray scale image in the middle; green in the merged image on the right), and AQP4 (red) in dorsal SCWM of Kv3.1 KO mice (bottom) compared to that of WT mice (top). (D) Increased expression of astrocytic proteins as in (C) in ventral SCWM. Scale bars, 100 μm. Summary of expression levels of Vim (E) and GFAP (F) in WT and Kv3.1 KO mice. Unpaired Student t–test: *p < 0.05. n = 50. The results were from 3 Kv3.1 KO and 4 WT mice.
Figure 5
Figure 5
Alterations of BDNF and Trk receptor levels in Kv3.1 KO mice and EAE mice. The levels of BDNF (red) and Vim (green) in SCWM of WT (A) and Kv3.1 KO (B) mice. High magnification confocal image stacks were obtained from cross sections of ventral SCWM. The collapsed 2D images are on the left, and three cross sections are on the right. Scale bars, 200 μm. The levels of phospho-TrkB (TrkB-p) receptors (red) and Vim (green) in the control (C) and peak EAE (D) stages of WT mice. The image stacks were captured from longitudinal sections of SCWM. (E) The BDNF level significantly increased in Vim-positive astrocytes in SCWM of Kv3.1 KO mice. Unpaired Student t–test: *p < 0.05. (F) BDNF levels in Vim-positive astrocytes at different stages of EAE in WT mice. (G) Axonal pan-Trk levels increased during EAE. One-way ANOVA followed by Dunnett's test in (F,G). **p < 0.01; *p < 0.05. n = 50.
Figure 6
Figure 6
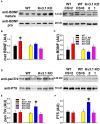
Biochemical analysis of BDNF and its receptor levels in Kv3.1 KO and EAE mice. (A) Western blot analysis of alterations of mature BDNF and pro-BDNF expression levels in Kv3.1 KO mice and at different stages of EAE. (B) Summary of mature BDNF levels. (C) Summary of pro-BDNF levels. (D) Western blot analysis of alterations of pan-Trk and P75 expression levels in Kv3.1 KO mice and at different stages of EAE. (E) Summary of pan-Trk levels. (F) Summary of P75 levels. Unpaired Student t–test between WT and Kv3.1 KO mice: *p < 0.05. One-way ANOVA followed by Dunnett's test in EAE mice. *p < 0.05.
Figure 7
Figure 7
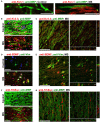
Alterations of Kv3 channels and BDNF in post-mortem tissues of MS patients. (A) Costaining of post-mortem brain sections from a non-MS individual (control) and an MS patient for Kv3.1 (red) and MBP (green). (B) Post-mortem brain sections from a control individual (top) and an MS patient (bottom) were costained for Kv3.3 channels (red) and MBP (green). (C) A 3-D confocal image stack for Kv3.3 (red) and MBP (green) in an MS lesion. (D) Sections from post-mortem brains were costained for Vim (green) and BDNF (red). (E) A 3-D confocal image stack in an MS lesion from (D). (F) Sections from post-mortem brains were costained for phospho-TrkB (TrkB-p, red) and MBP (green). (G) A 3-D confocal image stack in an MS lesion (F). Scale bars, 50 μm.
Figure 8
Figure 8
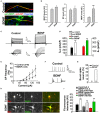
BDNF treatment stimulates axon myelination and increases neuronal excitability. (A) BDNF treatment (bottom) increased axon myelination of cultured SC neurons. (B) Summary of BDNF treatment on the levels of MAP2, neurofilament (NF) and MBP. (C) BDNF treatment increased the levels of inward and outward currents under the voltage-clamp mode. (D) Summary of inward and outward current amplitudes. (E) BDNF treatment increased action potential firing frequency revealed by the input-output relationship. (F,G) BDNF treatment increased burst firing. (H) BDNF treatment (bottom) increased the endogenous expression levels of Kv3.3 (green) and Nav (red) channels. (I) Summary of the expression levels of endogenous Kv3.3 and Nav channels at the soma and AIS. Unpaired Student t–test: **p < 0.01. Scale bars, 50 μm.
Figure 9
Figure 9
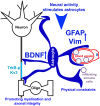
Hypothetical model diagram of the role of Kv3 channels in lesion formation in EAE and MS. Neural activity stimulates radial astrocytes, which upregulate the expression of GFAP and Vim, as well as BDNF. Upregulated intermediate filaments (GFAP and Vim) increase the rigidness of astrocytes, thereby deterring migration and proliferation of infiltrating immune cells to limit lesion formation. On the other hand, BDNF signaling promotes axon remyelination and prevents axonal degeneration, and thus contributes to lesion repair.

Similar articles

Cited by

References

    1. Barry J., Xu M., Gu Y., Dangel A., Jukkola P., Shrestha C., et al. . (2013). Activation of conventional kinesin motors in clusters by Shaw voltage-gated K+ channels. J. Cell Sci. 126, 2027–2041. 10.1242/jcs.122234 - DOI - PMC - PubMed
    1. Brew H. M., Gittelman J. X., Silverstein R. S., Hanks T. D., Demas V. P., Robinson L. C., et al. . (2007). Seizures and reduced life span in mice lacking the potassium channel subunit Kv1.2, but hypoexcitability and enlarged Kv1 currents in auditory neurons. J. Neurophysiol. 98, 1501–1525. 10.1152/jn.00640.2006 - DOI - PubMed
    1. Cahalan M. D., Chandy K. G. (2009). The functional network of ion channels in T lymphocytes. Immunol. Rev. 231, 59–87. 10.1111/j.1600-065X.2009.00816.x - DOI - PMC - PubMed
    1. Cameron M. H., Fitzpatrick M., Overs S., Murchison C., Manning J., Whitham R. (2014). Dalfampridine improves walking speed, walking endurance, and community participation in veterans with multiple sclerosis: a longitudinal cohort study. Mult. Scler. 20, 733–738. 10.1177/1352458513507356 - DOI - PubMed
    1. Chan J. R., Watkins T. A., Cosgaya J. M., Zhang C., Chen L., Reichardt L. F., et al. (2004). NGF controls axonal receptivity to myelination by Schwann cells or oligodendrocytes. Neuron 43, 183–191. 10.1016/j.neuron.2004.06.024 - DOI - PMC - PubMed