. 2017 Oct 26:11:324.
doi: 10.3389/fncel.2017.00324. eCollection 2017.

VGLUT2 Trafficking Is Differentially Regulated by Adaptor Proteins AP-1 and AP-3

Affiliations

VGLUT2 Trafficking Is Differentially Regulated by Adaptor Proteins AP-1 and AP-3

Haiyan Li et al. Front Cell Neurosci. .

Abstract

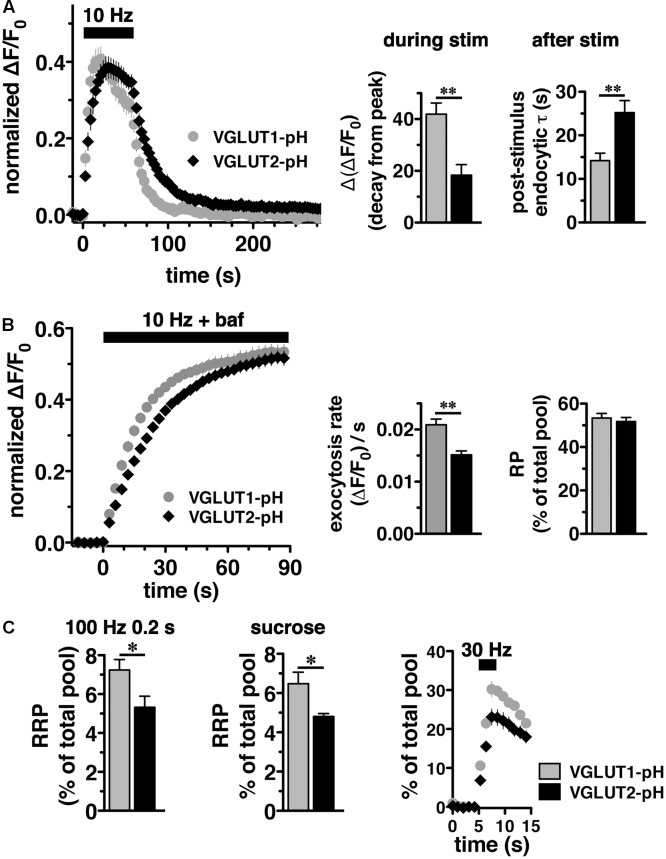
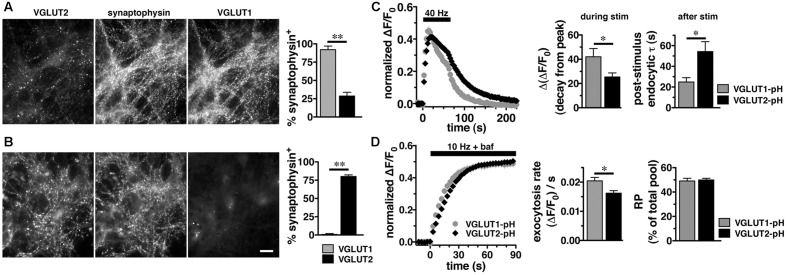
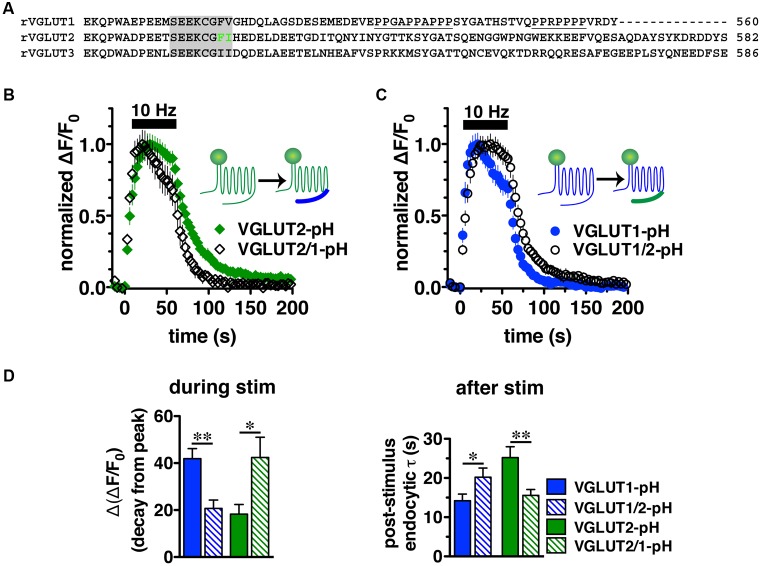
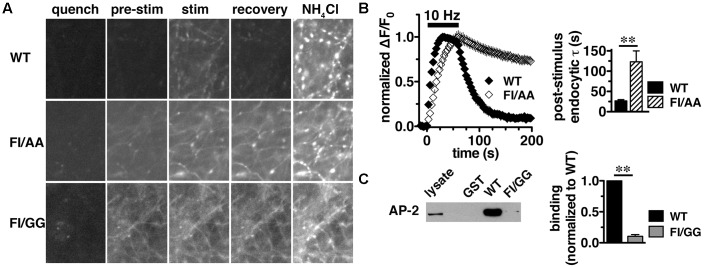
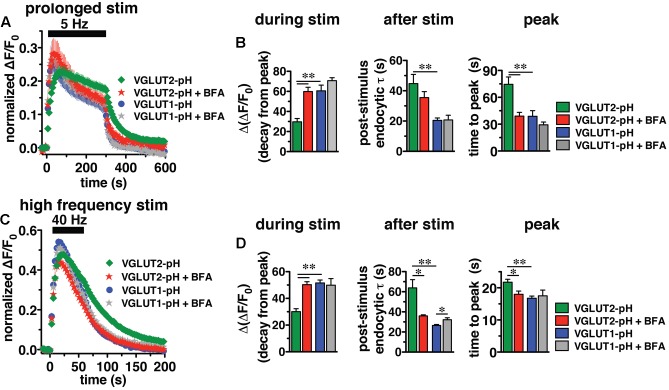
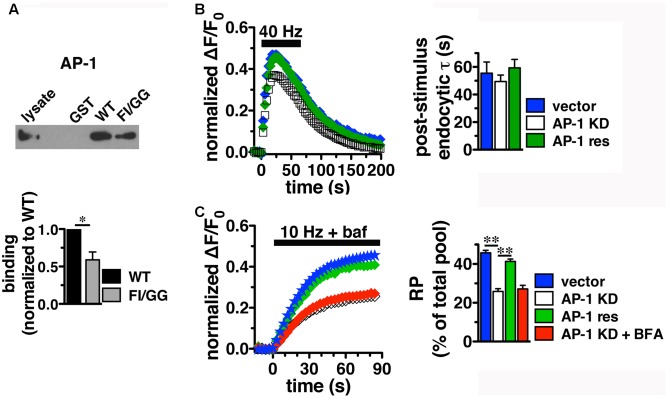
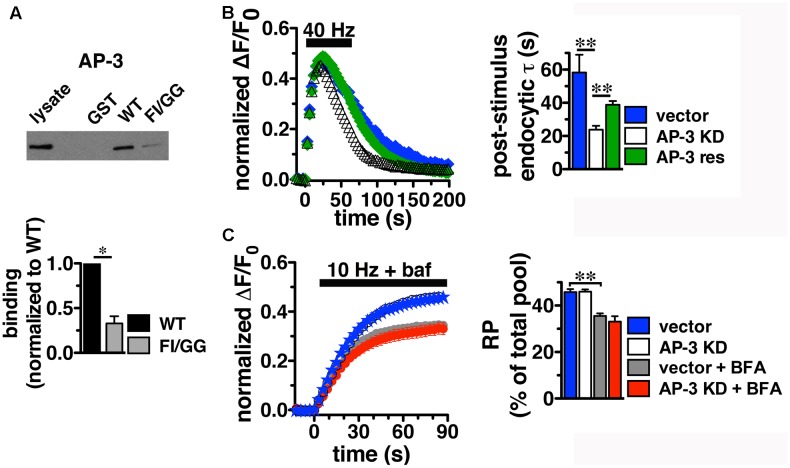
Release of the major excitatory neurotransmitter glutamate by synaptic vesicle exocytosis depends on glutamate loading into synaptic vesicles by vesicular glutamate transporters (VGLUTs). The two principal isoforms, VGLUT1 and 2, exhibit a complementary pattern of expression in adult brain that broadly distinguishes cortical (VGLUT1) and subcortical (VGLUT2) systems, and correlates with distinct physiological properties in synapses expressing these isoforms. Differential trafficking of VGLUT1 and 2 has been suggested to underlie their functional diversity. Increasing evidence suggests individual synaptic vesicle proteins use specific sorting signals to engage specialized biochemical mechanisms to regulate their recycling. We observed that VGLUT2 recycles differently in response to high frequency stimulation than VGLUT1. Here we further explore the trafficking of VGLUT2 using a pHluorin-based reporter, VGLUT2-pH. VGLUT2-pH exhibits slower rates of both exocytosis and endocytosis than VGLUT1-pH. VGLUT2-pH recycling is slower than VGLUT1-pH in both hippocampal neurons, which endogenously express mostly VGLUT1, and thalamic neurons, which endogenously express mostly VGLUT2, indicating that protein identity, not synaptic vesicle membrane or neuronal cell type, controls sorting. We characterize sorting signals in the C-terminal dileucine-like motif, which plays a crucial role in VGLUT2 trafficking. Disruption of this motif abolishes synaptic targeting of VGLUT2 and essentially eliminates endocytosis of the transporter. Mutational and biochemical analysis demonstrates that clathrin adaptor proteins (APs) interact with VGLUT2 at the dileucine-like motif. VGLUT2 interacts with AP-2, a well-studied adaptor protein for clathrin mediated endocytosis. In addition, VGLUT2 also interacts with the alternate adaptors, AP-1 and AP-3. VGLUT2 relies on distinct recycling mechanisms from VGLUT1. Abrogation of these differences by pharmacological and molecular inhibition reveals that these mechanisms are dependent on the adaptor proteins AP-1 and AP-3. Further, shRNA-mediated knockdown reveals differential roles for AP-1 and AP-3 in VGLUT2 recycling.

Keywords: VGLUT; endocytosis; exocytosis; glutamate; synaptic vesicle; vesicular glutamate transporter.


Figures

FIGURE 1
FIGURE 1
Characterization of a pHluorin-based reporter for studying vesicular glutamate transporter 2 (VGLUT2) recycling in real time. (A) VGLUT2-pH fluorescence co-localizes with synaptophysin at synaptic boutons. Hippocampal neurons transfected with VGLUT2-pH were stained with antibody to endogenous synaptophysin, followed by Cy5-conjugated secondary antibody. Inset shows a 9× magnification of the designated box. Scale bar, 10 μm. (B) The rate of FM4-64 destaining is not significantly different between boutons from untransfected (black) and transfected (green) neurons. Data are means ± SEM of the change in fluorescence (ΔF), acquired every 3 s, normalized to initial fluorescence (average of the first five data points prior to stimulation, F0) over 26–49 boutons per coverslip from four coverslips (n) from two independent cultures for each condition. (C) Time-lapse images show the fluorescence changes of VGLUT2-pH in response to neural activity. After onset of a 10 Hz 60 s stimulus, exocytosis of VGLUT2-pH results in a rapid increase in fluorescence (15, 30, and 60 s), followed by fluorescence decay after the termination of stimulation (75, 90, and 250 s) as vesicles undergo endocytosis and reacidification. Color scale is shown to the right. Scale bar, 2 μm.
FIGURE 2
FIGURE 2
Vesicular glutamate transporter 2-pH recycling differs from VGLUT1-pH. (A) Left panel: The time course of exo- and endocytosis in response to electrical stimulation at 10 Hz 60 s (bar) is monitored by the increase and decrease in the fluorescence of VGLUT2-pH (black) or VGLUT1-pH (gray) at hippocampal synaptic boutons, acquired every 3 s. Each trace was normalized to the size of the total pool of VGLUT-pH as determined by application of 50 mM NH4Cl. The fluorescence of both VGLUT1-pH and VGLUT2-pH increases rapidly upon stimulation and decays with an exponential time course after cessation of the stimulus, consistent with exocytosis followed by endocytosis (left panel). Middle panel: The extent of fluorescence decay from peak [Δ(ΔF/F0)] during stimulation is less for VGLUT2-pH (black, 18.26 ± 4.13% from peak, n = 9) than VGLUT1-pH (gray, 41.90 ± 4.31% from peak, n = 11, ∗∗p < 0.01). Right panel: The post-stimulus endocytic rate of VGLUT2-pH (black, τdecay = 25.20 ± 2.77 s) is also significantly slower than that of VGLUT1-pH (gray, τ = 14.18 ± 1.73 s, ∗∗p < 0.01). (B) Left panel: To measure exocytosis, hippocampal neurons expressing VGLUT2-pH or VGLUT1-pH were stimulated at 10 Hz for 90 s (bar) in the presence of 0.5 μM bafilomycin (baf). Middle panel: VGLUT2-pH exhibits a slower initial rate of exocytosis than VGLUT1-pH, calculated as the linear rate of fluorescence change, acquired every 3 s, from 0 to 15 s (VGLUT2-pH, 0.0151 ± 0.0008, n = 9; VGLUT1-pH, 0.0209 ± 0.0011, n = 10, ∗∗p < 0.01). Right panel: Both VGLUT1-pH and VGLUT2-pH fluorescence plateau at a similar level in response to 900 action potentials, indicating that there is no significant difference in the total amount of VGLUT-pH released from the recycling pool (RP, VGLUT1-pH, 53.38 ± 2.11%; VGLUT2-pH, 51.73 ± 1.92% of total pool). (C) Left panel: The fraction of VGLUT2-pH in the readily releasable pool (RRP) is less than VGLUT1-pH, when exocytosis from the RRP is evoked using a stimulus of 20 action potentials at 100 Hz (VGLUT2-pH, 5.32 ± 0.57%, n = 10; VGLUT1-pH, 7.24 ± 0.53%, n = 11, p < 0.05), or middle panel: by application of hypertonic (300 mM) sucrose in Tyrode’s solution (VGLUT2-pH, 4.81 ± 0.15%, n = 6; VGLUT1-pH, 6.48 ± 0.58%, n = 5, p < 0.05). Right panel: Similar results are obtained with an alternate stimulus of 30 Hz for 3 s to release RRP. The release of VGLUT2-pH (black, 6.81 ± 0.640% of total pool, n = 8) even from the first second of stimulation (30 action potentials) is significantly smaller than that of VGLUT1-pH (gray, 10.58 ± 1.025%, n = 8, ∗∗p < 0.01). For RRP measurements, fluorescence intensity measurements were acquired every 1 s. Data are means ± SEM of ΔF/F0 normalized to total fluorescence over at least 38 boutons per coverslip from 8 to 11 coverslips per construct and at least three independent cultures.
FIGURE 3
FIGURE 3
Vesicular glutamate transporter 2-pH retains distinct recycling kinetics from VGLUT1-pH in different neuronal populations. (A) Cultured hippocampal neurons were triple stained with antibodies to endogenous VGLUT2, synaptophysin, and VGLUT1. Right panel: Quantitation of synaptophysin+ puncta that co-localize with antibody to VGLUT1 (92.00 ± 5.05%, n = 3) is greater than VGLUT2 (28.67 ± 5.15%, n = 4, ∗∗p < 0.01) in hippocampal cultures. (B) In thalamic neurons in culture, 80.00 ± 2.28% of synaptophysin+ puncta co-localize with antibody to VGLUT2 (n = 5). VGLUT1 staining was virtually undetectable (0.80 ± 0.49%, n = 5). Data are the mean ± SEM of 3–5 coverslips from at least two independent cultures. Scale bar, 10 μm. (C) Left panel: The time course of exo- and endocytosis of VGLUT2-pH (black) or VGLUT1-pH (gray) in response to electrical stimulation in thalamic synaptic boutons is similar to hippocampus. Middle panel: The extent of VGLUT2-pH fluorescence decay from peak during stimulation is less for VGLUT2-pH (black, 25.41 ± 3.32%, n = 8) than VGLUT1-pH (gray, 42.02 ± 6.85%, n = 6, p < 0.05). Right panel: The post-stimulus endocytic rate of VGLUT2-pH (black, τ = 54.32 ± 9.34 s) is also significantly slower than that of VGLUT1-pH (gray, τ = 24.89 ± 4.18 s, p < 0.05). (D) Left panel: Exocytosis upon stimulation at 10 Hz for 90 s (bar) is measured in the presence of bafilomycin. Middle panel: As in hippocampus, VGLUT2-pH expressed in thalamic neurons exhibits a slower initial rate of exocytosis than VGLUT1-pH, calculated as the linear rate of fluorescence change from 0 to 15 s [(ΔF/F0)/s VGLUT2-pH, 0.0162 ± 0.0008, n = 8; VGLUT1-pH, 0.0205 ± 0.0012, p < 0.05, n = 9]. Right panel: In response to 900 action potentials, fluorescence of VGLUT2-pH and VGLUT1-pH plateaus at a similar level, indicating that there is no significant difference in the total amount of VGLUT-pH released from the RP (VGLUT2-pH, 49.93 ± 1.34% of total pool, VGLUT1-pH, 49.10 ± 2.16%). Data are means ± SEM of ΔF/F0, acquired every 3 s, normalized to total fluorescence over at least 24 boutons per coverslip from 6 to 9 coverslips per construct and two independent cultures.
FIGURE 4
FIGURE 4
Vesicular glutamate transporter C-termini direct isoform-specific trafficking. (A) Alignment of putative targeting sequences in the C-termini of rat VGLUT1, 2, and 3 downstream of the last transmembrane spanning region. Dileucine-like motifs (shaded) are conserved among the three isoforms. The F518I519 motif of VGLUT2 is in green. Polyproline domains (underlined) are present only in VGLUT1. (B) Swapping the C-terminal tails of the two VGLUT-pHs produces chimeric VGLUT2/1-pH and VGLUT1/2-pH (insets). Replacing the VGLUT2 C-terminus with the VGLUT1 C-terminus results in a faster time course of fluorescence change of the chimeric VGLUT2/1-pH (black, n = 8) relative to wild-type (WT) VGLUT2-pH (green, n = 9). (C) Conversely, replacing the VGLUT1 C-terminus with the VGLUT2 C-terminus results in a slower time course of fluorescence change of the chimeric VGLUT1/2-pH (black, n = 8) relative to WT VGLUT1-pH (blue, n = 11). (D) Quantification shows that the extent of fluorescence decay from peak fluorescence [Δ(ΔF/F0)] during stimulation (left panel) is greater and the rate of endocytosis after stimulation (right panel) of VGLUT2/1-pH (hatched green) is faster than WT VGLUT2-pH (green), similar to that of WT VGLUT1-pH (blue). Likewise, fluorescence decay for the chimeric VGLUT1/2-pH (hatched blue) is lower than WT VGLUT1-pH (blue), and more similar to WT VGLUT2-pH (green). Data are means ± SEM of ΔF/F0, acquired every 3 s, normalized to total fluorescence and to peak fluorescence in each trace during stimulation. Data are from at least 18 synapses per coverslip from 8 to 11 coverslips from at least three independent cultures, p < 0.05, ∗∗p < 0.01.
FIGURE 5
FIGURE 5
A C-terminal dileucine-like motif is essential for VGLUT2 synaptic targeting and recycling. (A) Representative images of neurons expressing WT, FI/AA or FI/GG VGLUT2-pH in Tyrode’s buffered with MES pH 5.5 to quench surface fluorescence (quench); at rest, pH 7.4 (pre-stimulus); during 10 Hz 60 s stimulation, near peak fluorescence (stim); during recovery after termination of the stimulus (recovery); and upon alkalinization in 50 mM NH4Cl to visualize total pHluorin levels. The fluorescence of WT VGLUT2-pH increases upon stimulation and quickly recovers to baseline after stimulation stops (top panels). Mutation of the F518I519 residues to either alanine (FI/AA) or glycine (FI/GG) results in more protein stranded at the cell surface (middle and bottom panels). A fraction of FI/AA in puncta responds to action potential stimulation with an increase in fluorescence, but fails to recover (middle panels). FI/GG mutation severely disrupts synaptic targeting, with fluorescence diffused along neuronal processes, with virtually no response to electrical stimulation (bottom panel). Scale bar, 10 μm. (B) Left panel: Time course of changes in fluorescence intensity of neurons expressing either WT or FI/AA VGLUT2-pH, normalized to peak. Upon stimulation, WT exhibits a rapid increase in fluorescence consistent with exocytosis, followed by rapid recovery to baseline after the termination of stimulation (black). The small fraction of FI/AA that appears punctate responds to stimulation but fails to recover (open symbols). Right panel: The post-stimulus endocytic rate of FI/AA is dramatically slower than that of WT (WT, τ = 26.76 ± 2.963 s, n = 6; FI/AA, τ = 123.2 ± 26.81 s, n = 7, ∗∗p < 0.01). Data in (B) are means ± SEM of ΔF/F0, acquired every 3 s, normalized to total fluorescence and to the peak fluorescence in each trace during stimulation. Data are from at least 41 synapses per coverslip from 6 to 8 coverslips from at least two independent cultures. (C) VGLUT2 interacts with the clathrin adaptor protein adaptor protein (AP)-2 through its dileucine-like motif. A GST fusion of the WT VGLUT2 C-terminus specifically pulls down AP-2 from the rat brain lysates, but mutation of F518I519 to GG disrupts the interaction. Left panel: A representative immunoblot of bound proteins detected by antibody to AP-2. Right panel: The averaged quantified band intensity from three independent experiments, ∗∗p < 0.01.
FIGURE 6
FIGURE 6
Brefeldin A (BFA) selectively affects VGLUT2 recycling. (A) The time course of fluorescence changes of VGLUT1-pH (blue) and VGLUT2-pH (green) expressed in hippocampal neurons, acquired every 6 s, in response to prolonged stimulation at 5 Hz for 5 min are differently affected by BFA. (B) Left panel: In the presence of BFA (10 μg/ml), VGLUT2-pH fluorescence changes are selectively accelerated. During stimulation, the extent of VGLUT2-pH fluorescence decay from the peak [Δ(ΔF/F0)] (green, 29.68 ± 3.25% from peak, n = 11) is less than VGLUT1-pH (blue, 60.59 ± 5.63% from peak, n = 13, ∗∗p < 0.01). BFA treatment significantly increases the amount of VGLUT2-pH fluorescence decay from peak during stimulation (red, 59.84 ± 4.25% from peak, n = 10), without affecting the amount of VGLUT1-pH decay during stimulation (gray, 70.73 ± 2.89%, n = 8). Middle panel: VGLUT2-pH also exhibits a slower rate of post-stimulus endocytosis (green, τ = 44.76 ± 6.06 s) than VGLUT1-pH (blue, τ = 20.43 ± 1.63 s, ∗∗p < 0.01) after prolonged stimulation. The post-stimulus rate of VGLUT2-pH endocytosis is faster in neurons treated with BFA (red, τ = 35.48 ± 3.97 s) than control (green) but is not statistically significant. BFA does not change the rate of VGLUT1-pH endocytosis (gray, τ = 20.75 ± 3.11 s). Right panel: While the peak fluorescence level is similar for the two VGLUT-pHs in response to prolonged stimulation, VGLUT2-pH fluorescence peaks more slowly (green, at 74.50 ± 8.27 s) than VGLUT1-pH (blue, at 38.77 ± 6.32 s, ∗∗p < 0.01). In the presence of BFA, VGLUT2-pH fluorescence reaches peak value at 39.00 ± 4.22 s (red), similar to VGLUT1-pH. BFA treatment does not significantly alter the kinetics of VGLUT1-pH (time to peak 29.25 ± 3.09 s). (C) The kinetics of fluorescence change of VGLUT2-pH (green) in response to high frequency stimulation at 40 Hz for 60 s, acquired every 3 s, is different from that of VGLUT1-pH (blue). (D) Left panel: The VGLUT2-pH fluorescence decay from the peak [Δ(ΔF/F0), green, 30.08 ± 2.16% from peak, n = 12] during 40 Hz stimulation is significantly smaller than VGLUT1-pH (blue, 51.53 ± 2.24% from peak, n = 12). The decay of VGLUT2-pH during stimulation is significantly increased by BFA treatment (red, 50.30 ± 2.18% from peak, n = 8, ∗∗p < 0.01), whereas that of VGLUT1-pH is not significantly affected by BFA (gray, 49.86 ± 4.96% from peak, n = 6). Middle panel: VGLUT2-pH exhibits a slower rate of post-stimulus endocytosis (green, τ = 63.81 ± 8.25 s) than VGLUT1-pH (blue, τ = 26.43 ± 1.06 s). BFA significantly accelerates the rate of VGLUT2-pH endocytosis after stimulation (red, τ = 35.99 ± 1.08 s), but slightly decreases that of VGLUT1-pH (gray, τ = 32.13 ± 2.04 s). Right panel: VGLUT2-pH fluorescence peaks more slowly (21.75 ± 0.91 s) than VGLUT1-pH (16.75 ± 0.69 s, ∗∗p < 0.01). BFA treatment shifts the time course of fluorescence changes of VGLUT2-pH (red, time to peak: 17.63 ± 0.98 s) toward that of VGLUT1-pH. The time to peak of VGLUT1-pH fluorescence is not significantly affected by BFA (gray, 17.50 ± 1.80 s) (right panel). Traces in (A,C) are means ± SEM of ΔF/F0 normalized to total fluorescence. Bar graphs in (B,D) are quantifications of fluorescence decay during stimulation and endocytic rate after stimulation. Data are from at least 38 boutons per coverslip from 6 to 12 coverslips from at least three independent cultures, p < 0.05.
FIGURE 7
FIGURE 7
Adaptor protein AP-1 interacts with VGLUT2 and affects the amount of VGLUT2-pH in the RP. (A) A GST fusion of the WT VGLUT2-pH C-terminus pulls down AP-1 from rat brain lysate, but the F518I519 mutation disrupts the interaction. Bound proteins were detected by immunoblotting with AP-1 antibody (anti-adaptin γ). Top panel shows a representative immunoblot, bottom shows the quantification of band intensity from at least three independent experiments, p < 0.05. (B) Left panel: Time course of fluorescence changes in boutons from neurons expressing VGLUT2-pH infected with viral particles expressing either vector control (blue) or AP-1γ (open squares), or co-expressing an siRNA resistant 1γ (green). Quantification of peak fluorescence level as a fraction of total pool confirms a reduction with AP-1 KD (white, 37.69 ± 1.60%) compared to vector control (47.63 ± 1.03%, ∗∗p < 0.01). Co-expression of a construct carrying an siRNA resistant 1γ rescues the peak reduction (green, 46.45 ± 2.48%, n = 7). Right panel: Neither the post-stimulus endocytic τdecay (right panel, vector, 55.50 ± 8.08 s vs. KD, 49.45 ± 4.69 s) nor fluorescence decay during stimulation [Δ(ΔF/F0): vector, 27.45 ± 3.46% vs. AP-1 KD, 32.81 ± 1.65%] is significantly affected by AP-1 depletion. Data in (B,C) are means ± SEM of ΔF/F0, acquired every 3 s, normalized to total fluorescence. Data are from at least 33 boutons per coverslip from 5 to 7 coverslips from at least two independent cultures. (C) Depletion of AP-1 decreases the amount of VGLUT2-pH in the RP, released by 900 action potentials at 10 Hz in the presence of bafilomycin (vector, 45.75 ± 1.34% of total pool, n = 22; AP-1 KD, 25.86 ± 1.40%, n = 18, ∗∗p < 0.01). Co-expression of an siRNA resistant 1γ rescues this reduction (41.33 ± 1.24%, n = 11, ∗∗p < 0.01). BFA treatment has no additional effect on AP-1 KD (red, 27.14 ± 1.85%, n = 8). The rate of exocytosis in response to 10 Hz 90 s stimulation is not significantly altered by either AP-1 knockdown, rescue, or inhibition by BFA [ΔF/F0 (au/s): vector 0.0275 ± 0.0007; AP-1 KD 0.0269 ± 0.0013; AP-1 KD + res 0.0267 ± 0.0021; AP-1 KD + BFA 0.0254 ± 0.0023]. Data in (C) are from at least 28 boutons per coverslip from 8 to 22 coverslips from at 4–6 independent cultures.
FIGURE 8
FIGURE 8
Adaptor protein AP-3 interacts with VGLUT2 and regulates the rate of VGLUT2-pH endocytosis. (A) A GST fusion of the WT VGLUT2-pH C-terminus pulls down AP-3 from rat brain lysate. Mutation of the F518I519 residues of the dileucine-like motif disrupts the interaction. Bound proteins were detected by immunoblotting with antibody against AP-3 (anti-β-NAP). The top panel shows a representative immunoblot, the bottom shows the quantification of WT and mutant band intensities from at least three independent experiments, p < 0.05. (B) AP-3 KD accelerates the recycling kinetics of VGLUT2-pH. Left panel: The time course of fluorescence changes in boutons response to 40 Hz stimulation in neurons transfected with VGLUT2-pH and infected with viral particles expressing either vector control (blue) or AP-3δ1 shRNA (open symbols), or co-expressing siRNA resistant δ1 (green). Depletion of AP-3 shifts the time course to the left, the fluorescence peaks earlier with AP-3 KD relative to vector control (vector, 23.50 ± 1.43 s, n = 5 vs. AP-3 KD, 20.14 ± 0.55 s, n = 7, p < 0.05). AP-3 KD does not alter the peak fluorescence level during stimulation, as a fraction of the total pool, but it increases the extent of fluorescence decay during stimulation (vector, 27.45 ± 3.46% from peak vs. KD, 54.14 ± 1.71%, ∗∗p < 0.01). Right panel: AP-3 KD speeds the endocytic rate after stimulation (vector, τ = 55.50 ± 8.08 s vs. KD, τ = 20.40 ± 1.71 s, ∗∗p < 0.01). Expression of an siRNA resistant δ1 rescues the knockdown phenotype (green, τ = 42.14 ± 1.71 s, n = 8). Data in (B,C) are means ± SEM of ΔF/F0, acquired every 3 s, normalized to total fluorescence. Data in (B) are from at least 52 boutons per coverslip from 5 to 8 coverslips from at least two independent cultures. (C) Depletion of AP-3 does not affect the proportion of VGLUT2-pH in the RP (vector, blue: 45.75 ± 1.34%; AP-3 KD, white: 45.95 ± 1.02%, n = 19). Treatment with BFA reduces the proportion of VGLUT2-pH in the RP irrespective of whether neurons were infected with vector control or AP-3δ1 shRNA (vector + BFA, gray: 35.56 ± 1.10%, n = 15) and knockdown conditions (AP-3 KD + BFA, red: 33.07 ± 2.35%, n = 10), ∗∗p < 0.01. The rate of exocytosis in response to 10 Hz 90 s stimulation is not significantly altered by AP-3 knockdown, or inhibition by BFA [ΔF/F0 (au/s): vector 0.0275 ± 0.0007; AP-3 KD 0.0257 ± 0.0005; vector + BFA 0.0296 ± 0.0009; AP-3 KD + BFA 0.0276 ± 0.0010]. Data in (C) are from at least 24 boutons per coverslip from 10 to 22 coverslips from at 4–6 independent cultures.

Similar articles

Cited by

References

    1. Alabi A. A., Tsien R. W. (2013). Perspectives on kiss-and-run: role in exocytosis, endocytosis, and neurotransmission. Annu. Rev. Physiol. 75 393–422. 10.1146/annurev-physiol-020911-153305 - DOI - PubMed
    1. Ariel P., Ryan T. A. (2010). Optical mapping of release properties in synapses. Front. Neural Circuits 4:18. 10.3389/fncir.2010.00018 - DOI - PMC - PubMed
    1. Asensio C. S., Sirkis D. W., Edwards R. H. (2010). RNAi screen identifies a role for adaptor protein AP-3 in sorting to the regulated secretory pathway. J. Cell Biol. 191 1173–1187. 10.1083/jcb.201006131 - DOI - PMC - PubMed
    1. Balaji J., Armbruster M., Ryan T. A. (2008). Calcium control of endocytic capacity at a CNS synapse. J. Neurosci. 28 6742–6749. 10.1523/JNEUROSCI.1082-08.2008 - DOI - PMC - PubMed
    1. Bellocchio E. E., Reimer R. J., Fremeau R. T. J., Edwards R. H. (2000). Uptake of glutamate into synaptic vesicles by an inorganic phosphate transporter. Science 289 957–960. 10.1126/science.289.5481.957 - DOI - PubMed