

Hypertrophy Stimulation at the Onset of Type I Diabetes Maintains the Soleus but Not the EDL Muscle Mass in Wistar Rats
- PMID: 29123487
- PMCID: PMC5662641
- DOI: 10.3389/fphys.2017.00830
Hypertrophy Stimulation at the Onset of Type I Diabetes Maintains the Soleus but Not the EDL Muscle Mass in Wistar Rats
Abstract
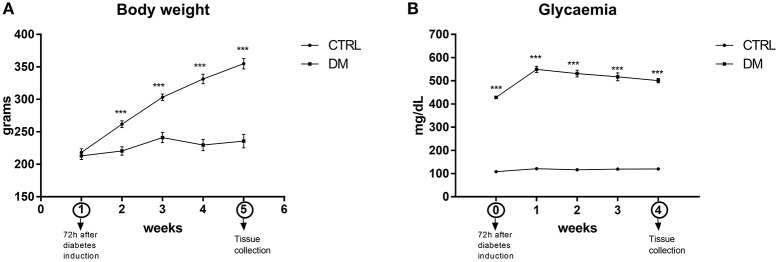
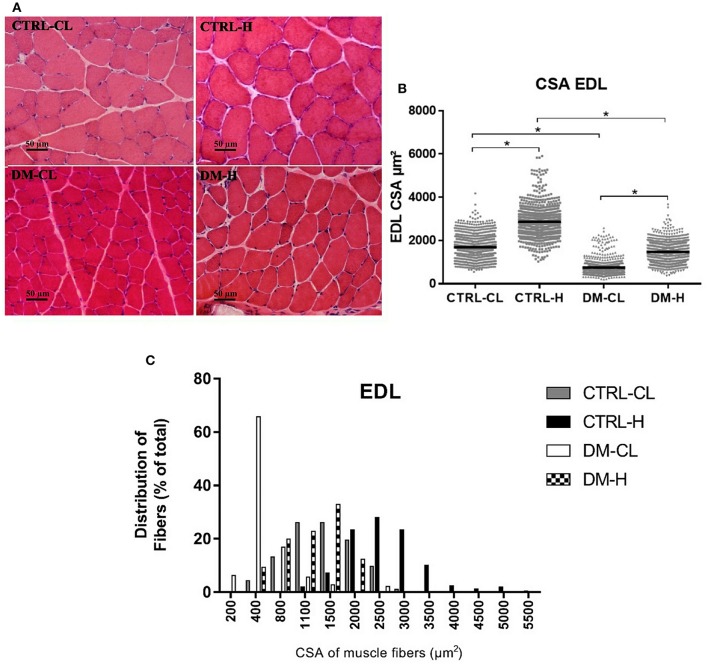
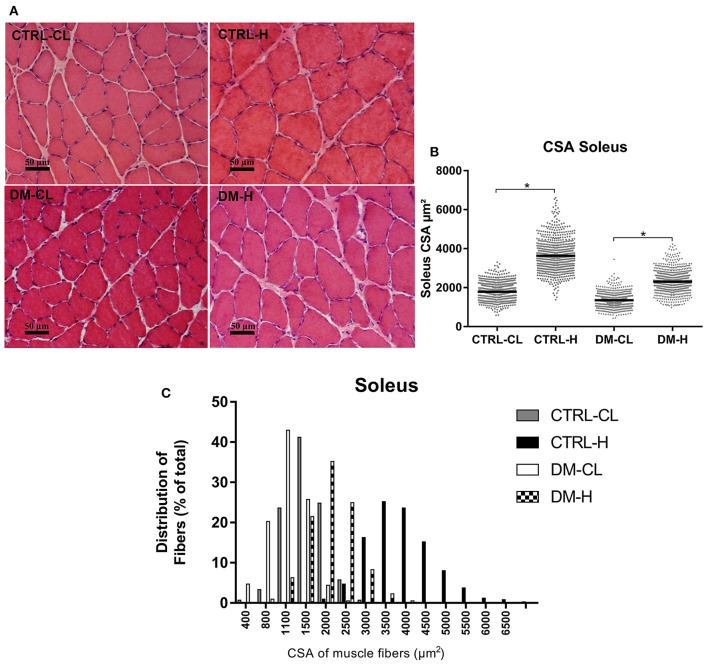
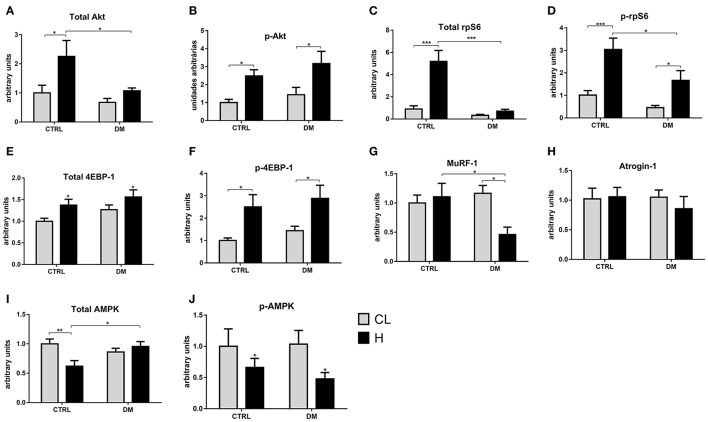
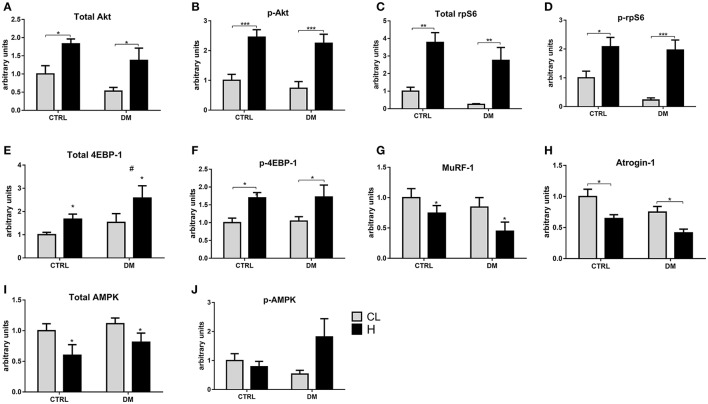
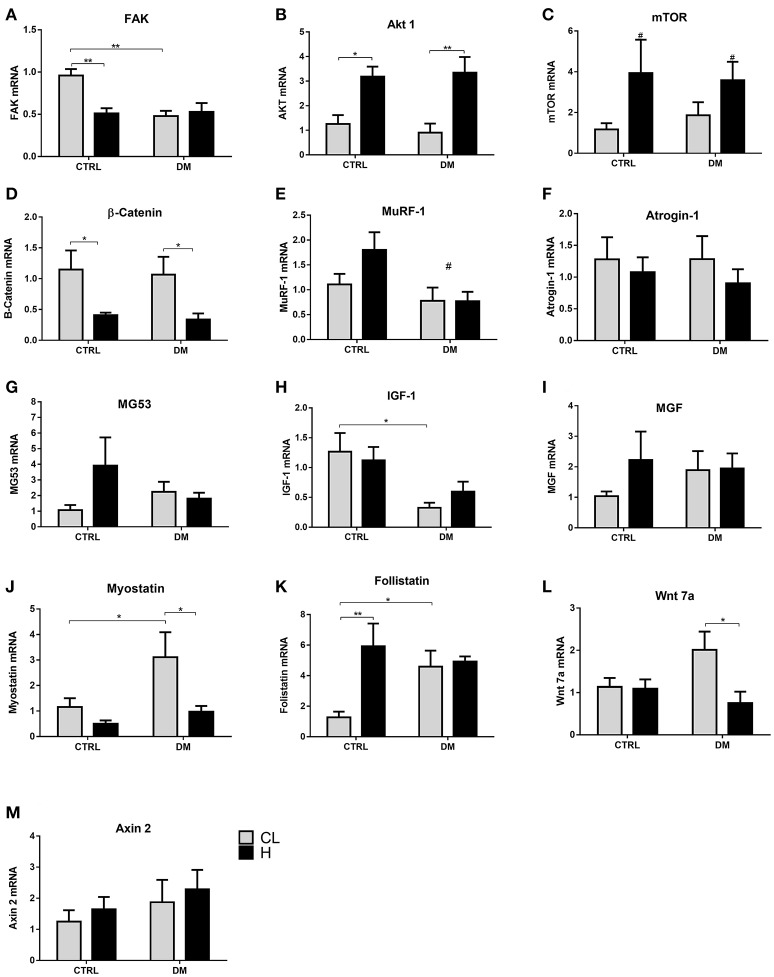
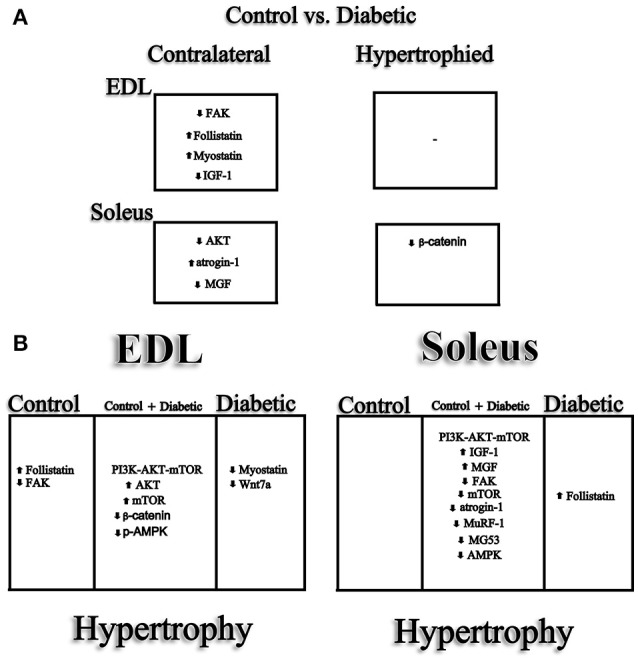
Diabetes mellitus induces a reduction in skeletal muscle mass and strength. Strength training is prescribed as part of treatment since it improves glycemic control and promotes increase of skeletal muscle mass. The mechanisms involved in overload-induced muscle hypertrophy elicited at the establishment of the type I diabetic state was investigated in Wistar rats. The purpose was to examine whether the overload-induced hypertrophy can counteract the hypotrophy associated to the diabetic state. The experiments were performed in oxidative (soleus) or glycolytic (EDL) muscles. PI3K/Akt/mTOR protein synthesis pathway was evaluated 7 days after overload-induced hypertrophy of soleus and of EDL muscles. The mRNA expression of genes associated with different signaling pathways that control muscle hypertrophy was also evaluated: mechanotransduction (FAK), Wnt/β-catenin, myostatin, and follistatin. The soleus and EDL muscles when submitted to overload had similar hypertrophic responses in control and diabetic animals. The increase of absolute and specific twitch and tetanic forces had the same magnitude as muscle hypertrophic response. Hypertrophy of the EDL muscle from diabetic animals mostly involved mechanical loading-stimulated PI3K/Akt/mTOR pathway besides the reduced activation of AMP-activated protein kinase (AMPK) and decrease of myostatin expression. Hypertrophy was more pronounced in the soleus muscle of diabetic animals due to a more potent activation of rpS6 and increased mRNA expression of insulin-like growth factor-1 (IGF-1), mechano-growth factor (MGF) and follistatin, and decrease of myostatin, MuRF-1 and atrogin-1 contents. The signaling changes enabled the soleus muscle mass and force of the diabetic rats to reach the values of the control group.
Keywords: electrostimulation; hyperglycemia; muscle mass regulation; muscle strength; protein synthesis; skeletal muscle.
Figures

Similar articles
-
Autophagy signaling in hypertrophied muscles of diabetic and control rats.FEBS Open Bio. 2023 Sep;13(9):1709-1722. doi: 10.1002/2211-5463.13677. Epub 2023 Jul 26. FEBS Open Bio. 2023. PMID: 37470707 Free PMC article.
-
Overload-induced skeletal muscle hypertrophy is not impaired in STZ-diabetic rats.Physiol Rep. 2015 Jul;3(7):e12457. doi: 10.14814/phy2.12457. Physiol Rep. 2015. PMID: 26197932 Free PMC article.
-
Regulation of Akt-mTOR, ubiquitin-proteasome and autophagy-lysosome pathways in response to formoterol administration in rat skeletal muscle.Int J Biochem Cell Biol. 2013 Nov;45(11):2444-55. doi: 10.1016/j.biocel.2013.07.019. Epub 2013 Aug 2. Int J Biochem Cell Biol. 2013. PMID: 23916784
-
PI3 kinase regulation of skeletal muscle hypertrophy and atrophy.Curr Top Microbiol Immunol. 2010;346:267-78. doi: 10.1007/82_2010_78. Curr Top Microbiol Immunol. 2010. PMID: 20593312 Review.
-
Glucocorticoid-induced skeletal muscle atrophy.Int J Biochem Cell Biol. 2013 Oct;45(10):2163-72. doi: 10.1016/j.biocel.2013.05.036. Epub 2013 Jun 24. Int J Biochem Cell Biol. 2013. PMID: 23806868 Review.
Cited by
-
Resistance Exercise Training as a New Trend in Alzheimer's Disease Research: From Molecular Mechanisms to Prevention.Int J Mol Sci. 2024 Jun 27;25(13):7084. doi: 10.3390/ijms25137084. Int J Mol Sci. 2024. PMID: 39000191 Free PMC article. Review.
-
Clinical impact of sarcopenia and dynapenia on diabetes.Diabetol Int. 2019 Jun 19;10(3):183-187. doi: 10.1007/s13340-019-00400-1. eCollection 2019 Jul. Diabetol Int. 2019. PMID: 31275784 Free PMC article.
-
Glutamine Enhances the Hypoglycemic Effect of Insulin in L6 Cells via Phosphatidylinositol-3-Kinase (PI3K)/Protein Kinase B (AKT)/Glucose Transporter 4 (GLUT4) Signaling Pathway.Med Sci Monit. 2018 Mar 1;24:1241-1250. doi: 10.12659/msm.909011. Med Sci Monit. 2018. PMID: 29491345 Free PMC article.
-
Tail suspension is useful as a sarcopenia model in rats.Lab Anim Res. 2021 Jan 13;37(1):7. doi: 10.1186/s42826-020-00083-9. Lab Anim Res. 2021. PMID: 33441192 Free PMC article.
-
Autophagy signaling in hypertrophied muscles of diabetic and control rats.FEBS Open Bio. 2023 Sep;13(9):1709-1722. doi: 10.1002/2211-5463.13677. Epub 2023 Jul 26. FEBS Open Bio. 2023. PMID: 37470707 Free PMC article.
References
LinkOut - more resources
Full Text Sources
Other Literature Sources
Miscellaneous