. 2017 Oct 24:8:2062.
doi: 10.3389/fmicb.2017.02062. eCollection 2017.

Utilizing Biotinylated Proteins Expressed in Yeast to Visualize DNA-Protein Interactions at the Single-Molecule Level

Affiliations

Utilizing Biotinylated Proteins Expressed in Yeast to Visualize DNA-Protein Interactions at the Single-Molecule Level

Huijun Xue et al. Front Microbiol. .

Abstract

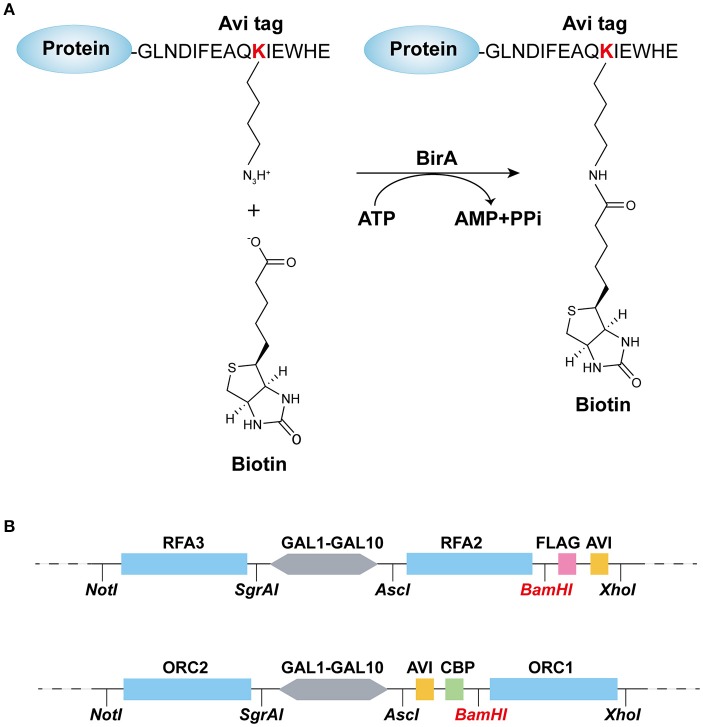
Much of our knowledge in conventional biochemistry has derived from bulk assays. However, many stochastic processes and transient intermediates are hidden when averaged over the ensemble. The powerful technique of single-molecule fluorescence microscopy has made great contributions to the understanding of life processes that are inaccessible when using traditional approaches. In single-molecule studies, quantum dots (Qdots) have several unique advantages over other fluorescent probes, such as high brightness, extremely high photostability, and large Stokes shift, thus allowing long-time observation and improved signal-to-noise ratios. So far, however, there is no convenient way to label proteins purified from budding yeast with Qdots. Based on BirA-Avi and biotin-streptavidin systems, we have established a simple method to acquire a Qdot-labeled protein and visualize its interaction with DNA using total internal reflection fluorescence microscopy. For proof-of-concept, we chose replication protein A (RPA) and origin recognition complex (ORC) as the proteins of interest. Proteins were purified from budding yeast with high biotinylation efficiency and rapidly labeled with streptavidin-coated Qdots. Interactions between proteins and DNA were observed successfully at the single-molecule level.

Keywords: BirA-Avi; DNA-protein interaction; biotin-streptavidin; budding yeast; quantum dots; total internal reflection fluorescence microscopy.


Figures

Figure 1
Figure 1
Recombination-protein biotinylated system established in budding yeast. (A) Avi-tagged target protein biotinylated by BirA. (B) Main elements and enzyme sites of (top) pC-AVI and (bottom) pN-AVI. The two plasmid maps are given in Figures S1, S2.
Figure 2
Figure 2
Detection and evaluation of biotinylation of Rfa2 and Orc1 using Western blotting. Whole-protein extracts of yFYV3, yFYV6, yFYV7, and yFYV8 were used to analyze the biotinylation of target proteins. (A) Rfa2 biotinylation by BirA in vivo was successfully detected using streptavidin-HRP in lane 3 (top). The bands in lanes 1–3 (top), which are most likely Arc1, are indicated by an asterisk. Biotinylated Rfa2 (Rfa2-biotin) was almost totally shifted in the presence of streptavidin in lane 4, which was analyzed using streptavidin-HRP (top) and anti-Flag antibody (bottom). (B) Orc1 biotinylation. Biotinylated Orc1 (biotin-Orc1) was detected successfully in lane 2 (top), and 91% Orc1 was shifted in the presence of streptavidin (SA) in lane 3 (bottom), which was quantified using Image J.
Figure 3
Figure 3
RPA purification and single-molecule visualization. (A) Single-molecule experiment platform. DNA was tethered on the coverslip through a biotin–streptavidin linkage. A protein bound on DNA is illustrated. Flow is from left to right. (B) Purified RPA and its biotinylation extent evaluation. Purified RPA (lane 1); RPA + unboiled streptavidin (SA) (lane 2); unboiled streptavidin (lane 3). Purified biotinylated-Rfa2 was shifted almost completely in the presence of streptavidin. (C) Illustration of streptavidin-coated-Qdot705 labeled RPA (RPA-Qdot705, red) binding on and stretching ssDNA (green), together with flow (top), 0.1 nM RPA-Qdot705 was pumped into flow cell (middle). 0.1 nM streptavidin-coated-Qdot705 was pumped into flow cell (bottom). Red arrows point out the two ends of RPA-ssDNA. (D) Length of ssDNA bound with RPA.
Figure 4
Figure 4
ORC purification and single-molecule visualization. (A) Purified ORC and its biotinylation efficiency evaluation. Purified ORC (lane 1); ORC + unboiled streptavidin (SA) (lane 2); unboiled streptavidin (lane 3). 90% Orc1 was shifted in the presence of streptavidin in lane 3, which was quantified using Image J. The band appearing between Orc3 and Orc4/5 in lane 1 of (A), indicated by a black arrow, was identified as the degradation band of Orc1 using MALDI-TOF mass spectrometry. (B) DNA substrates for ORC binding. An 838 bp DNA fragment containing ARS1 sequence was inserted into native lambda DNA at XbaI site (24, 508 bp) and named λ-ARS1; a 715 bp DNA fragment containing ARS609 sequence was inserted into at XhoI site (34, 336 bp) of λ-ARS1 and named λ-ARS1-ARS609. (C) ORC-Qdot705 binding on λ-ARS1/λ-ARS1-ARS609. DNA tethered on coverslip with the aid of the biotinylated oligonucleotide complementary to the left end of native λ DNA, together with flow in theory. (D) ORC-Qdot705 binding on λ-ARS1 (top) and λ-ARS1-ARS609 (bottom). 0.5 nM ORC-Qdot705 was pumped into a flow cell with binding buffer. (Left) DNA was stained using SYTOX Orange and excited using a 532 nm laser; (center) ORC-Qdot705 was excited using a 405 nm laser; (right) merged images. Three ORC binding positions at ARS1 and ARS609 inserted sites are indicated by red and black arrows, respectively.
Figure 5
Figure 5
Distributions of ORC binding positions on λ-ARS1 and λ-ARS1-609. (A) Histogram and Gaussian fitting of ORC binding distributions on λ-ARS1. The position of the ARS1 inserted site is indicated by a red arrow. Data were analyzed using R and GraphPad Prism, and an error was defined based on 1000 bootstrap samples and a 95% confidential interval. N stands for the number of ORC molecules. (B) Histogram and Gaussian fitting of ORC binding distribution on λ-ARS1-ARS609. The positions of ARS1 and ARS609 inserted sites are indicated by red and black arrows, respectively.
Figure 6
Figure 6
ORC binding on inverted λ-ARS1-ARS609. (A) ORC binding on inverted λ-ARS1-ARS609 together with flow in theory. DNA was biotinylated using the biotinylated oligonucleotide complementary to the right end of native λDNA. (B) ORC-Qdot705 binding on inverted λ-ARS1-ARS609. (left) DNA was stained using SYTOX Orange and excited using a 532 nm laser; (center) ORC-Qdot705 was excited using a 405 nm laser; (right) merged images. Three ORC binding positions at ARS1 and ARS609 are indicated by red and black arrows, respectively. (C) Distribution of ORC binding on inverted λ-ARS1-ARS609. Positions of ARS1 and ARS609 inserted sites are indicated by red and black arrows, respectively.

Similar articles

Cited by

References

    1. Alivisatos A. P., Gu W. W., Larabell C. (2005). Quantum dots as cellular probes. Annu. Rev Biomed. Eng. 7, 55–76. 10.1146/annurev.bioeng.7.060804.100432 - DOI - PubMed
    1. Beckett D., Kovaleva E., Schatz P. J. (1999). A minimal peptide substrate in biotin holoenzyme synthetase-catalyzed biotinylation. Protein Sci. 8, 921–929. 10.1110/ps.8.4.921 - DOI - PMC - PubMed
    1. Bell S. P., Labib K. (2016). Chromosome duplication in Saccharomyces cerevisiae. Genetics 203, 1027–1067. 10.1534/genetics.115.186452 - DOI - PMC - PubMed
    1. Billinton N., Knight A. W. (2001). Seeing the wood through the trees: a review of techniques for distinguishing green fluorescent protein from endogenous autofluorescence. Anal. Biochem. 291, 175–197. 10.1006/abio.2000.5006 - DOI - PubMed
    1. Boeke J. D., Lacroute F., Fink G. R. (1984). A positive selection for mutants lacking orotidine-5'-phosphate decarboxylase activity in yeast - 5-fluoro-orotic acid resistance. Mol. Gen. Genet. 197, 345–346. 10.1007/BF00330984 - DOI - PubMed

LinkOut - more resources