. 2017 Oct 26:8:1383.
doi: 10.3389/fimmu.2017.01383. eCollection 2017.

Toll-Like Receptor Ligands and Interferon-γ Synergize for Induction of Antitumor M1 Macrophages

Affiliations

Toll-Like Receptor Ligands and Interferon-γ Synergize for Induction of Antitumor M1 Macrophages

Elisabeth Müller et al. Front Immunol. .

Abstract

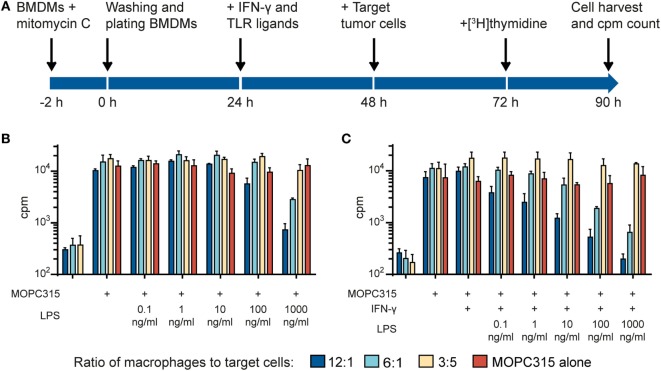
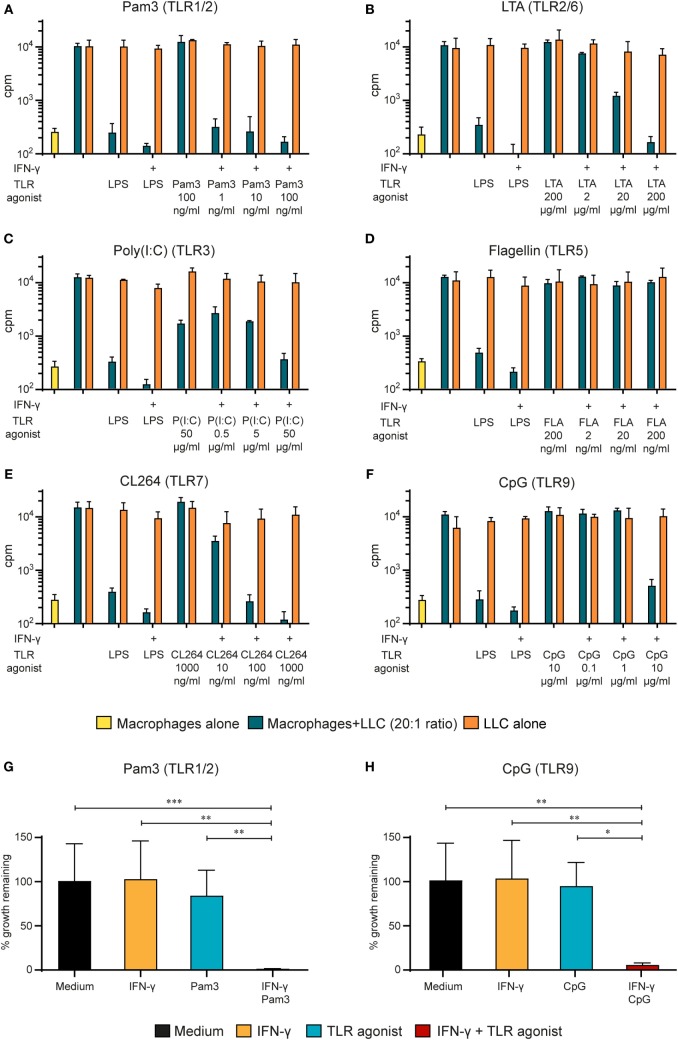
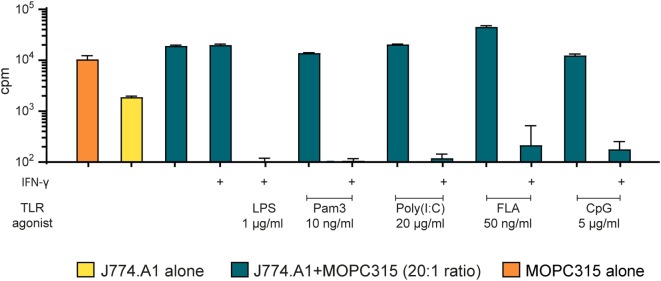
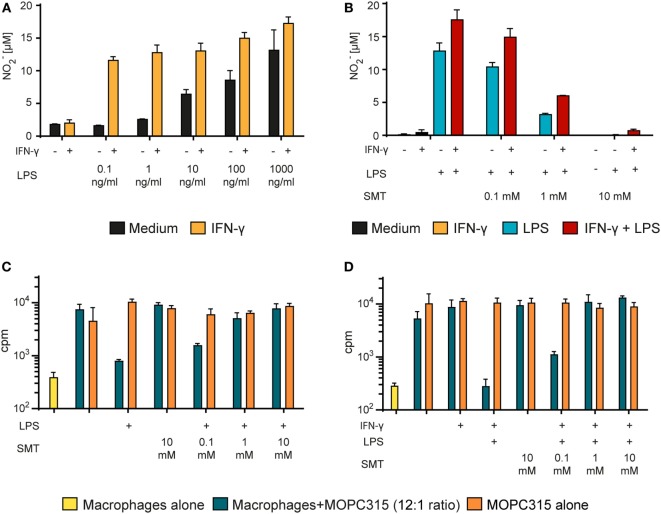
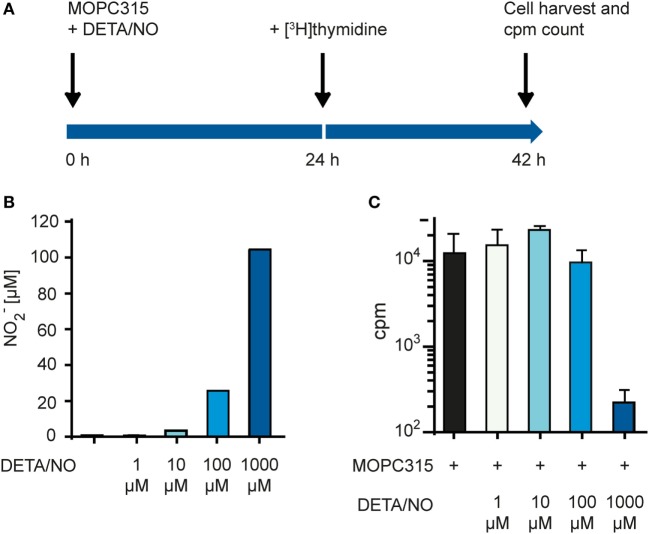
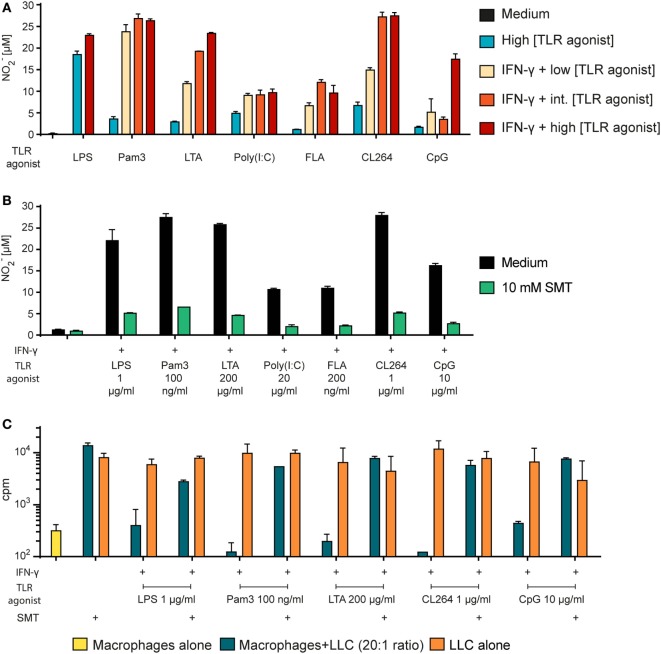
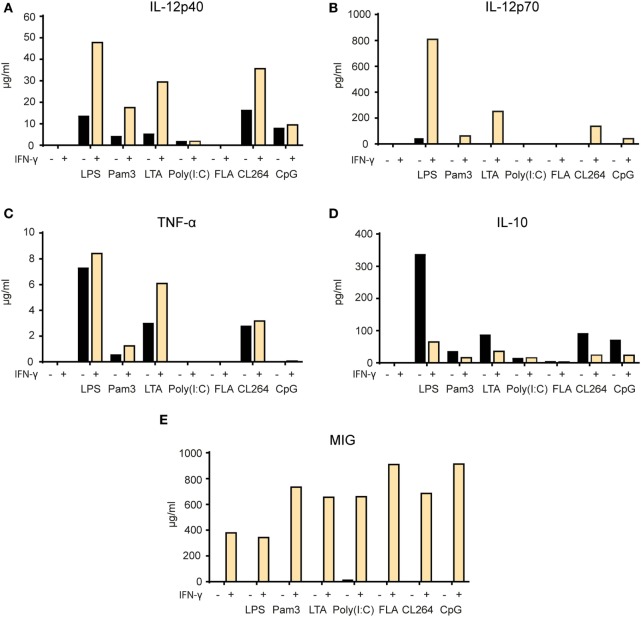
Tumor-associated macrophages may either promote or suppress tumor growth depending on their activation status. Interferon-γ (IFN-γ) has been identified as a key factor for inducing tumoricidal M1 phenotype in macrophages. However, it remains unclear whether IFN-γ is sufficient or if additional stimuli are required. Here, we tested IFN-γ and a panel of toll-like receptor (TLR) agonists for the ability to activate murine macrophages toward a tumoricidal M1 phenotype. The following TLR ligands were used: TLR1/TLR2 agonist Pam3CSK4, TLR2/TLR6 agonist lipotechoic acid, TLR3 agonist poly(I:C), TLR4 agonist lipopolysaccharide (LPS), TLR5 agonist flagellin, TLR7 agonist CL264, and TLR9 agonist CpG. We used an in vitro growth inhibition assay to measure both cytotoxic and cytostatic activity of mouse macrophages against Lewis lung carcinoma (LLC) and MOPC315 plasmacytoma tumor cells. Production of nitric oxide (NO) and cytokines by activated macrophages was quantified. We found that IFN-γ alone was not able to render macrophages tumoricidal. Similarly, macrophage activation with single TLR agonists was inefficient. In sharp contrast, IFN-γ was shown to synergize with TLR agonists for induction of macrophage tumoricidal activity and production of both NO and pro-inflammatory cytokines (TNF-α, IL-12p40, and IL-12p70). Furthermore, IFN-γ was shown to suppress macrophage IL-10 secretion induced by TLR agonists. NO production was necessary for macrophage tumoricidal activity. We conclude that two signals from the microenvironment are required for optimal induction of antitumor M1 macrophage phenotype. Combination treatment with IFN-γ and TLR agonists may offer new avenues for macrophage-based cancer immunotherapy.

Keywords: cancer; immunotherapy; interferon-γ; macrophages; nitric oxide; toll-like receptors; tumoricidal.


Figures

Figure 1
Figure 1
Lipopolysaccharide (LPS) and IFN-γ synergize to induce tumoricidal activity in macrophages. (A) Time-line for the growth inhibition assay used for measuring macrophage cytotoxic and cytostatic activity toward tumor cells. (B) Mitomycin C-treated bone marrow derived macrophages (BMDMs) were stimulated for 24 h with various LPS concentrations before addition of 5,000 MOPC315 tumor cells/well, resulting in the indicated macrophage to target cell ratios. The growth of the tumor cells was quantified by measuring incorporation of radiolabeled thymidine and is shown on the y-axis as mean counts per minute (cpm) values of triplicates ± SD. The three columns to the left show proliferation of BMDMs alone (tumor cells were not added). (C) BMDMs were stimulated with IFN-γ (40 ng/ml) in combination with different concentrations of LPS for 24 h before target cells were added. Radiolabeled thymidine incorporation in growing cells is shown on the y-axis as mean cpm values of triplicates ± SD. The three columns on the left show proliferation of BMDMs alone. (B,C) All experiments were performed three times and representative experiments are shown.
Figure 2
Figure 2
Synergy between IFN-γ and several TLR agonists for M1 macrophage activation. (A–F) Mitomycin C-treated bone marrow derived macrophages (BMDMs) (6 × 104 cells/well) were stimulated for 24 h with several TLR agonists at various concentrations in the presence or absence of IFN-γ (40 ng/ml) before addition of 3,000 LLC tumor cells/well, resulting in a 20:1 macrophage to target cell ratio. lipopolysaccharide (LPS) (1 µg/ml) + IFN-γ (40 ng/ml) was used as a positive control for macrophage activation. Radiolabeled thymidine incorporation in growing cells is shown on the y-axis as mean cpm values of triplicates ± SD. The first column on the left show proliferation of BMDMs alone. The following TLR agonists were tested at the indicated concentrations: (A) TLR1/2 agonist Pam3CSK4; (B) TLR2/6 agonist lipotechoic acid (LTA); (C) TLR3 agonist Poly(I:C); (D) TLR5 agonist Flagellin; (E) TLR7 agonist CL264; and (F) TLR9 agonist CpG. All experiments were performed three times and representative experiments are shown. (G,H) Statistical analysis of the pooled results from 5 (G) and 4 (H) growth inhibition assays performed as described above with the indicated TLR agonists. y-axis show % remaining growth calculated by dividing cpm20:1 by cpmLLC alone and multiplying with 100. p-values from multiple comparison test using one-way ANOVA is displayed as follows: *p-value < 0.05, **p-value < 0.01, ***p-value < 0.001.
Figure 3
Figure 3
The macrophage cell line J774.A1 inhibits tumor cell growth in a similar manner as bone marrow derived macrophages after two-signal activation. Growth inhibition assays. Mitomycin C-treated J774.A1 cells (1 × 105 cells/well) were stimulated with TLR agonists as indicated in the presence or absence of IFN-γ (40 ng/ml) for 18 h before addition of 5,000 MOPC315 tumor cells/well, resulting in a 20:1 effector to target cell ratio. Radiolabeled thymidine incorporation in growing cells is shown on the y-axis as mean cpm values of triplicates ± SD. The first column on the left shows proliferation of target cells alone and the second column shows proliferation of effector cells alone. This experiment was performed three times and a representative experiment is shown.
Figure 4
Figure 4
Tumor cell growth inhibition by activated macrophages is mediated by NO. (A) Bone marrow derived macrophages (BMDMs) (6 × 104 cells/well) were stimulated with different concentrations of lipopolysaccharide (LPS) alone or in combination with IFN-γ (40 ng/ml) for 24 h. The Griess assay was used to measure NO in the supernatants indirectly as nitrite (NO2). NO2 levels (μM) are presented as mean values of triplicates ± SD. (B) BMDMs (6 × 104 cells/well) were incubated with various concentrations of the inducible NO synthase inhibitor SMT (S-Methylisothiourea hemisulfate salt) and stimulated with LPS (1 µg/ml) alone or in combination with IFN-γ (40 ng/ml) for 24 h. NO2 concentration (μM) in the supernatants was measured using the Griess assay and presented as mean values of triplicates ± SD. (C,D) Growth inhibition assay. Mitomycin C-treated BMDMs (6 × 104 cells/well) were stimulated for 24 h with LPS alone (1 µg/ml) (C) or with LPS (1 µg/ml) + IFN-γ (40 ng/ml) (D) and treated with various concentrations of SMT before addition of 5,000 MOPC315 tumor cells/well, resulting in a 12:1 macrophage to target cell ratio. Radiolabeled thymidine incorporation in growing cells is shown on the y-axis as mean cpm values of triplicates ± SD. The first column on the left show proliferation of BMDMs alone. (A–D) All experiments were performed three times and representative experiments are shown.
Figure 5
Figure 5
Tumor cell proliferation is inhibited by high concentrations of NO. (A) Time-line for the growth inhibition assay used for measuring direct cytotoxic and cytostatic activity of NO released from diethylenetriamine/nitric oxide adduct (DETA/NO) toward tumor cells. (B) Varying concentrations of DETA/NO in media was analyzed for NO2 using the Griess assay. The y-axis shows the μM concentration of NO2 measured. (C) Growth inhibition assay. MOPC315 cells were cultured in varying concentrations of DETA/NO for 42 h before analysis. Radiolabeled thymidine incorporation in growing cells is shown on the y-axis as mean cpm values of triplicates ± SD. All experiments were performed three times and representative experiments are shown.
Figure 6
Figure 6
Tumor cell growth inhibition by macrophages activated by any TLR agonist requires NO. (A) Bone marrow derived macrophages (BMDMs) (6 × 104 cells/well) were stimulated with TLR agonists alone or in combination with IFN-γ (40 ng/ml) as indicated for 24 h. NO2 concentration (μM) in the supernatants was measured using the Griess assay and presented as mean values of triplicates ± SD. Each of the TLR agonists were tested at three concentrations (low/intermediate (int)/high): Pam3 (1/10/100 ng/ml); lipotechoic acid (LTA) (2/20/200 μg/ml); poly(I:C) (0.5/5/50 μg/ml); flagellin (FLA) (2/20/200 ng/ml); CL264 (10/100/1,000 ng/ml); CpG (0.1/1/10 μg/ml). (B) BMDMs (6 × 104 cells/well) were incubated in the absence or presence of the inducible NO synthase inhibitor s-methylisothiourea hemisulfate salt (SMT) (10 mM) and stimulated with TLR agonists as indicated and IFN-γ (40 ng/ml) for 24 h. NO2 concentration (μM) in the supernatants was measured using the Griess assay and presented as mean values of triplicates ± SD. (C) Growth inhibition assay. Mitomycin C-treated BMDMs (6 × 104 cells/well) were incubated in the absence or presence of SMT (10 mM) and IFN-γ (40 ng/ml) in combination with TLR agonists as indicated for 24 h before addition of 3,000 LLC tumor cells/well, resulting in a 20:1 macrophage to target cell ratio. The growth of the tumor cells was quantified by measuring incorporation of radiolabeled thymidine and is shown on the y-axis as mean cpm values of triplicates ± SD. The first column to the left show control wells with BMDMs alone (no tumor cells). (A–C) All experiments were performed three times and representative experiments are shown.
Figure 7
Figure 7
Synergy between IFN-γ and TLR agonists for induction of pro-inflammatory cytokine secretion by macrophages. (A–E) Mitomycin C-treated bone marrow derived macrophages (2.4 × 104 cells/well) were stimulated for 24 h with the following TLR agonists in the presence or absence of IFN-γ (40 ng/ml): lipopolysaccharide (LPS) (1 µg/ml), Pam3 (100 ng/ml), lipotechoic acid (LTA) (200 µg/ml), poly(I:C) (50 µg/ml), flagellin (200 ng/ml), CL264 (1 µg/ml), and CpG (10 µg/ml). Cell supernatants were analyzed by Luminex technology and the cytokine content is shown on the y-axis as mean pg/ml or ng/ml values of duplicates. The following cytokines were measured: (A) IL-12p40, (B) IL-12p70, (C) TNF-α, (D) IL-10, and (E) monokine-induced by IFN-γ (MIG). All experiments were performed three times and representative experiments are shown.

Similar articles

Cited by

References

    1. Biswas SK, Mantovani A. Macrophage plasticity and interaction with lymphocyte subsets: cancer as a paradigm. Nat Immunol (2010) 11(10):889–96.10.1038/ni.1937 - DOI - PubMed
    1. Mantovani A, Marchesi F, Malesci A, Laghi L, Allavena P. Tumour-associated macrophages as treatment targets in oncology. Nat Rev Clin Oncol (2017) 14(7):399–416.10.1038/nrclinonc.2016.217 - DOI - PMC - PubMed
    1. Mills CD, Kincaid K, Alt JM, Heilman MJ, Hill AM. M-1/M-2 macrophages and the Th1/Th2 paradigm. J Immunol (2000) 164(12):6166–73.10.4049/jimmunol.164.12.6166 - DOI - PubMed
    1. Mantovani A, Sozzani S, Locati M, Allavena P, Sica A. Macrophage polarization: tumor-associated macrophages as a paradigm for polarized M2 mononuclear phagocytes. Trends Immunol (2002) 23(11):549–55.10.1016/S1471-4906(02)02302-5 - DOI - PubMed
    1. Mantovani A, Sica A. Macrophages, innate immunity and cancer: balance, tolerance, and diversity. Curr Opin Immunol (2010) 22(2):231–7.10.1016/j.coi.2010.01.009 - DOI - PubMed