. 2017 Nov 7:3:17041.
doi: 10.1038/celldisc.2017.41. eCollection 2017.

The telomere bouquet facilitates meiotic prophase progression and exit in fission yeast

Affiliations

The telomere bouquet facilitates meiotic prophase progression and exit in fission yeast

Vera Moiseeva et al. Cell Discov. .

Abstract

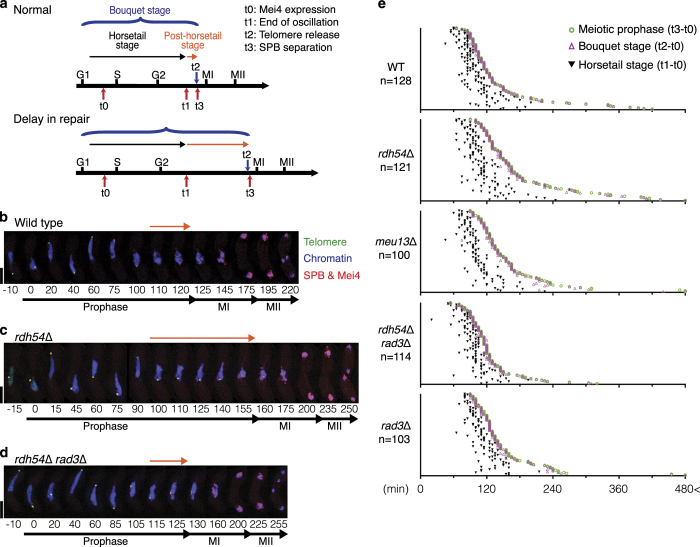
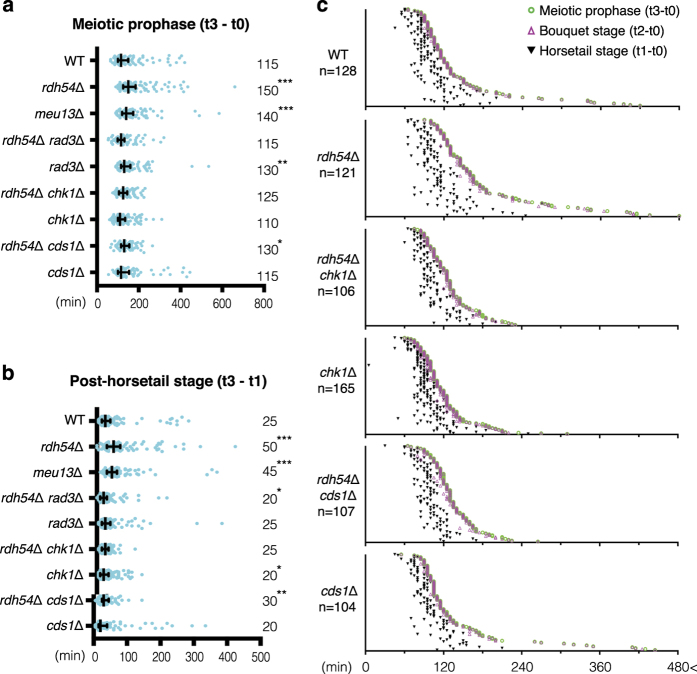
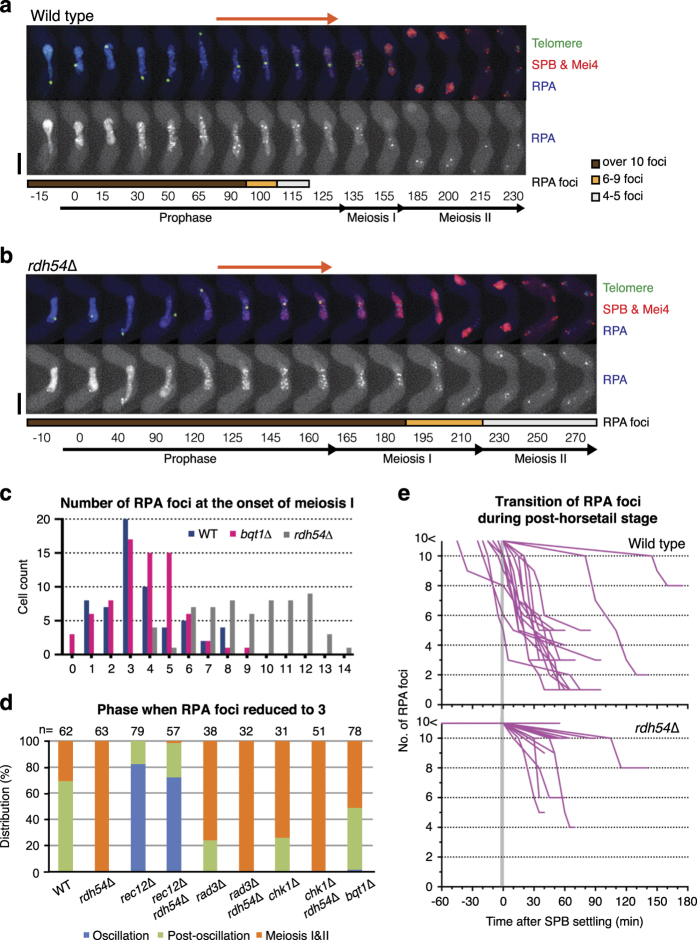
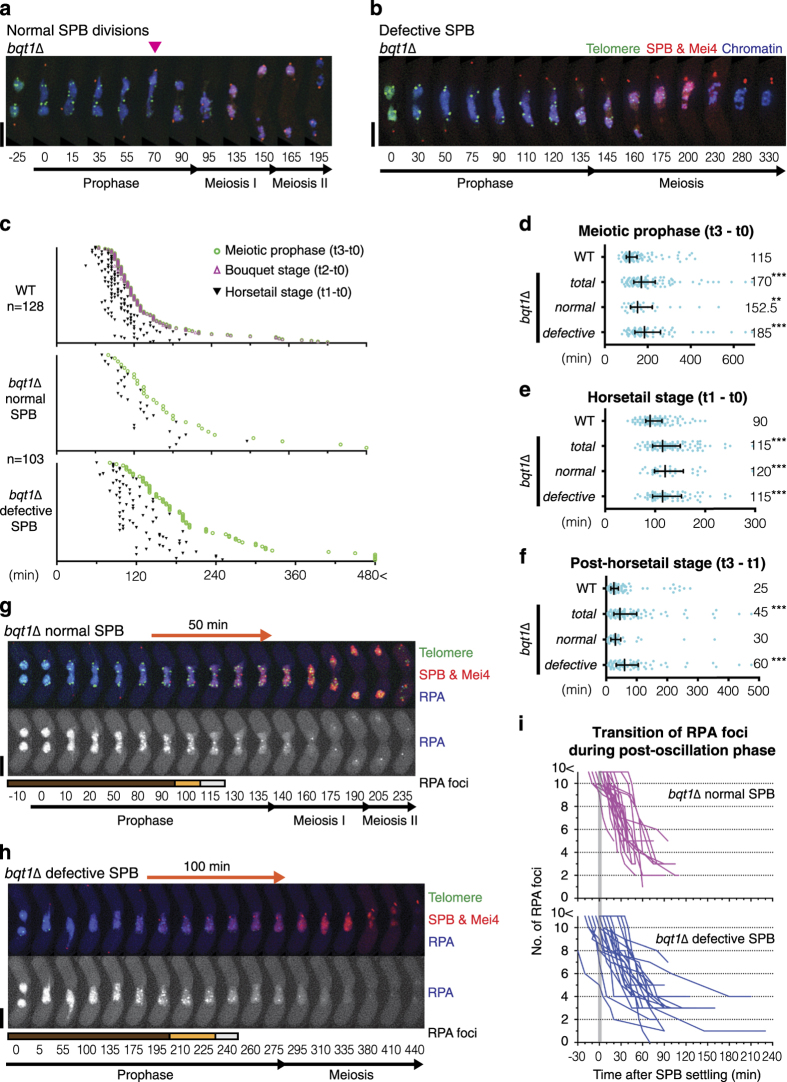
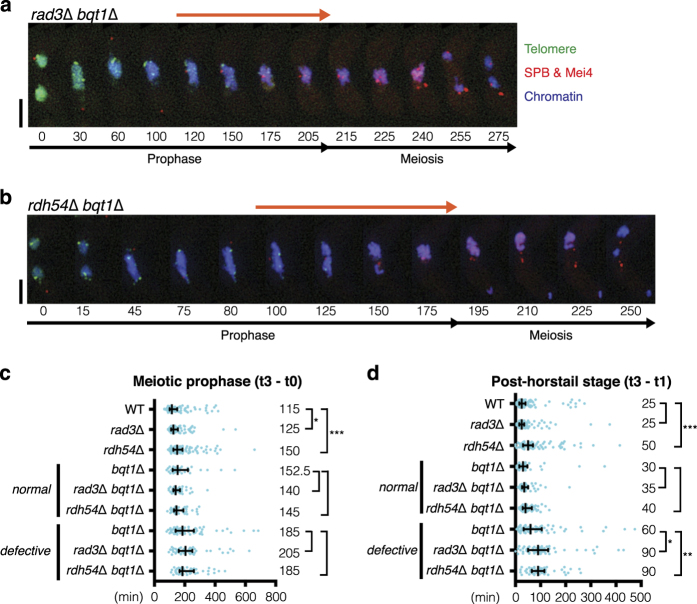
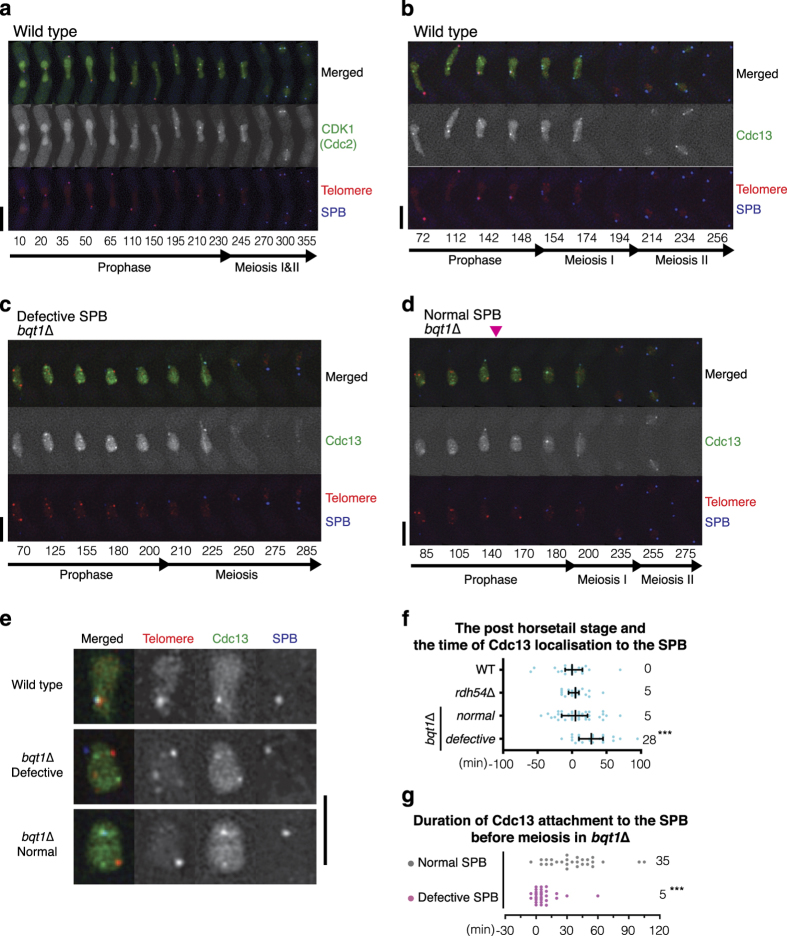
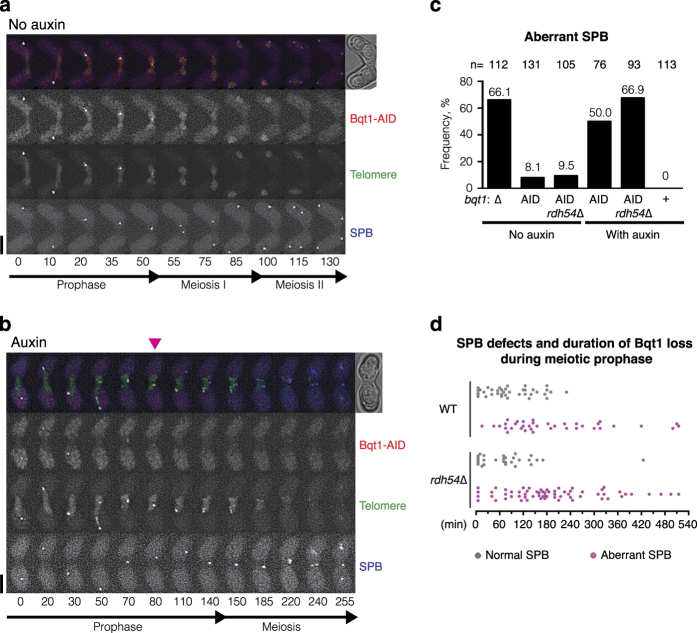
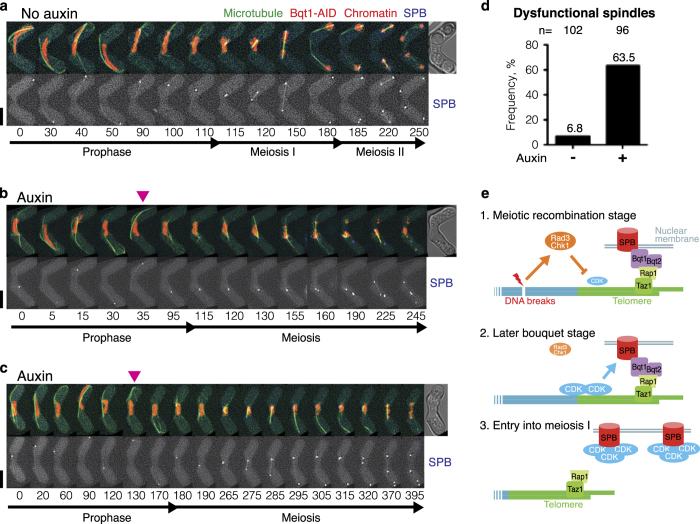
During meiotic prophase, chromosome arrangement and oscillation promote the pairing of homologous chromosomes for meiotic recombination. This dramatic movement involves clustering of telomeres at the nuclear membrane to form the so-called telomere bouquet. In fission yeast, the telomere bouquet is formed near the spindle pole body (SPB), which is the microtubule organising centre, functionally equivalent to the metazoan centrosome. Disruption of bouquet configuration impedes homologous chromosome pairing, meiotic recombination and spindle formation. Here, we demonstrate that the bouquet is maintained throughout meiotic prophase and promotes timely prophase exit in fission yeast. Persistent DNA damages, induced during meiotic recombination, activate the Rad3 and Chk1 DNA damage checkpoint kinases and extend the bouquet stage beyond the chromosome oscillation period. The auxin-inducible degron system demonstrated that premature termination of the bouquet stage leads to severe extension of prophase and consequently spindle formation defects. However, this delayed exit from meiotic prophase was not caused by residual DNA damage. Rather, loss of chromosome contact with the SPB caused delayed accumulation of CDK1-cyclin B at the SPB, which correlated with impaired SPB separation. In the absence of the bouquet, CDK1-cyclin B localised near the telomeres but not at the SPB at the later stage of meiotic prophase. Thus, bouquet configuration is maintained throughout meiotic prophase, by which this spatial organisation may facilitate local and timely activation of CDK1 near the SPB. Our findings illustrate that chromosome contact with the nuclear membrane synchronises meiotic progression of the nucleoplasmic chromosomes with that of the cytoplasmic SPB.

Keywords: Cdc2-Cdc13; Rad3–Chk1; S. pombe; bouquet; chromosome; meiosis; telomeres; the LINC complex.


Conflict of interest statement

The authors declare no conflict of interest.

Figures

Figure 1
Figure 1
Live imaging of fission yeast meiosis and measurement of bouquet stage extension. (a) Schematic diagram of meiotic progression. t0, t1, t2 and t3 indicate time of the beginning of Mei4 expression, the end of chromosome oscillation, the beginning of telomere release (the end of bouquet configuration) and SPB separation, respectively. The chromosomal bouquet is observed throughout meiotic prophase (highlighted with a blue curved bracket). This stage can be divided into the ‘horsetail stage’ (black arrow line flanked by t0 and t1) and the ‘post-horsetail stage’ (orange arrow line flanked by t1 and t3). Delayed DNA repair extends the post-horsetail stage within the bouquet stage. (bd) Series of frames from films of live fission yeast undergoing meiosis (b: wild type, c: rdh54Δ, D: rdh54Δ rad3Δ). The SPB, Mei4, telomeres and chromosomes were visualised via endogenously tagged Sid4-mCherry, Mei4-mCherry, Taz1-YFP and Hht1-Cerulean, respectively. Merged images are presented. Individual channels are shown in Supplementary Figure S2. Cell images were captured every 5 min, and selected time frames are shown. Numbers below the slides represent minutes since Mei4 stains nuclei (t0: see details in Supplementary Figure S1C). The end of meiotic prophase (t3) is defined by SPB separation and chromosome condensation. The period between t0 and t3 is defined as the 'meiotic prophase' in this system. The post-horsetail stage is highlighted with the orange arrow lines. Scale bars equal 5 μm. (b) An example of average wild-type meiosis. Telomeres cluster at the SPB, representing bouquet formation, during meiotic prophase SPB oscillation pulls chromosomes to exhibit chromosomal ‘horsetail’ movement until 110 min (t1). The SPB settles at the centre of a cell, and separates when telomeres dissociate from the SPB and disperse (telomere fireworks, t2: 125 min). (c) rdh54Δ cells extend the post-horsetail stage (t1: 100 min). Telomere dissociation is observed at 160 min (t2) when the SPB separates (t3). The SPB segregates equally twice through meiosis; however, chromosome segregation is defective. (d) rdh54Δ rad3Δ cells exhibit shortened post-horsetail stage and telomere dissociation (t2) is observed at 130 min. (e) The duration of the events for individual cells are shown. Dot plots represent time distributions of meiotic prophase [t3–t0] (green circle), the bouquet stage [t2–t0] (magenta triangle) and the horsetail stage [t1–t0] (black anti-triangle). Up to 20 cells were filmed per day and the total examined samples are summarised. The sample number (n=) is indicated below the genotype. For values in each sample, see Supplementary Table S2.
Figure 2
Figure 2
Rad3/ATR-dependent extension of the bouquet stage. (a, b) Distribution graphs calculated from dot plots in Figures 1e and 2c. Median durations are indicated on the right. The outside bars represent interquartile range. Significant differences over wild type are indicated as asterisks (the Mann–Whitney nonparametric test: * at P<0.05, ** at P<0.01 and *** at P<0.001). (a) Duration of meiotic prophase [t3–t0]. (b) Duration of the post-horsetail stage, which represents the time from SPB settling until entry into meiosis I [t3–t1]. (c) Individual dot plots of meiotic prophase time course in the DNA damage checkpoint mutants. Data for WT and rdh54Δ are taken from Figure 1e. See the graph in Figure 1e for details. For values in each sample, see Supplementary Table S2.
Figure 3
Figure 3
RPA foci diminishes before entry into meiosis I in wild type. (a, b) Series of frames from films of cells undergoing meiosis. The SPB, Mei4, telomeres and the RPA component Ssb2 were visualised via endogenously tagged Sid4-mCherry, Mei4-mCherry, Taz1-YFP and Ssb2-Cerulean. RPA foci represent sites of chromosome replication and DNA damage (separate channel is shown below merged image). Cell images were captured every 5 min, and selected time frames are shown. Numbers below the slides represent minutes after Mei4 staining became visible in the nuclei. The post-horsetail stage is highlighted with the orange arrow lines. The coloured bar below the RPA row indicates the number of RPA foci: over 10 foci (brown), 6–9 foci (orange) and 4–5 foci (light grey). Scale bars equal 5 μm. (a) An example image of a wild-type cell experiencing a long post-horsetail stage (45 min, highlighted above the frames) is shown. The number of distinct foci of RPA decreased when the SPB decelerates (85 min), and further decreased prior to meiosis I. Two RPA foci remained through meiosis. (b) rdh54Δ single mutant cells maintain more than 10 distinct foci of RPA throughout meiotic prophase and the number is reduced through meiosis. However, a few strong RPA foci were retained after meiosis. Sixty-three cells were examined and most of the cells retained 4–6 strong RPA foci at the end of meiosis. (c) Graph showing a number of RPA foci at entry into meiosis. Most of cells enter meiosis when RPA foci decreased to 3–4 foci in both wild type and bqt1Δ cells. Examined sample numbers are WT (n=60), bqt1Δ (n=74) and rdh54Δ (n=62). (d) Distribution graph showing the stage of meiosis where RPA foci are largely diminished. The sample number (n=) is showing above. (e) Graphs showing transition of the number of RPA foci through the post-horsetail stage. Eighteen wild-type cells that exhibited a prolonged post-horsetail stage (Top) and 18 rdh54Δ cells (Bottom) were selected and their RPA foci were counted and plotted until entry into meiosis I. The y-axis indicates a number of RPA foci. The x-axis indicates time after SPB settling (the post-horsetail stage). Most cells harbour more than 10 RPA foci during the horsetail stage (minus values of x-axis).
Figure 4
Figure 4
Meiotic prophase is prolonged in the absence of Bqt1. (a, b, g and h) Series of frames from a film of bqt1Δ cells undergoing meiosis. Cell images were captured every 5 min, and selected time frames are shown. Numbers below the slides represent minutes after Mei4 staining became visible in the nuclei (t0). Telomeres, the SPB and Mei4 were visualised via endogenously tagged Taz1-YFP, Sid4-mCherry and Mei4-mCherry, respectively. Chromosomes and RPA were visualised by Hht1-Cerulean (a, b) and by Ssb2-Cerulean (g, h), respectively. Scale bars=5 μm. (a) An example of a bqt1Δ cell that successfully underwent meiosis is shown. During meiotic prophase, telomeres form foci but do not associate with the SPB in bqt1Δ cells. The SPB moves back and forth without chromosomes during the horsetail stage. In these cells, a chromosome is eventually captured during the SPB movement (at the 70 min time point, highlighted by a pink arrowhead). Chromosome condensation and the SPB separation are observed at the 95th minute time point. The separated SPB successively segregates chromosomes through meiosis I and II. (b) An example of a bqt1Δ cell that exhibits an aberrant SPB is shown. Although the SPBs do not separate, it duplicates and chromosome condensation is observed at the 135 min time point, which represents entry into meiosis. Dynamic rearrangement of chromosomes without the SPB is observed through meiosis, and the SPB eventually becomes fragmented (at the 330 min time point). (c) Individual dot plots of meiotic prophase time course in bqt1Δ cells categorised by the SPB phenotypes. The sample number (n=) is indicated below the genotype. Among bqt1Δ cells, cells exhibited normal and defective SPB are 30 and 73, respectively, in this study. Data for WT is taken from Figure 1e. See the graph in Figure 1e for details. Proportion of the time distributions is reminiscent of that in rdh54Δ cells (Figure 1e). For values in each sample, see Supplementary Table S2. (df) Distribution graphs calculated from dot plots. Median durations are indicated on the right. The outside bars represent interquartile range. Statistically significant differences over wild type are indicated as asterisks (the Mann–Whitney nonparametric test: ** at P<0.01 and *** at P<0.001). Data from bqt1Δ cells are phenotypically categorised into normal SPB and defective SPB. Data for WT is taken from Figure 2a and b and Supplementary Figure S3b. (d) Duration of meiotic prophase (t3–t0). (e) Duration of the horsetail stage from Mei4 expression to SPB settling (t1–t0). (f) Duration of the post-horsetail stage, which represents the length of time from SPB settling until entry into meiosis I (t3–t1). (g, h) Remaining RPA foci during the post-horsetail stage (or SPB settling period) in bqt1Δ cells. The duration of the post-horsetail stage is highlighted with the orange arrow lines. Coloured bars below the RPA row indicate the number of RPA foci: over 10 foci (brown), 6–9 foci (orange) and 4–5 foci (light grey). bqt1Δ cells that complete meiosis (g) have diminished RPA foci before meiosis I. Cells that exhibit aberrant SPBs (h) experienced a long post-horsetail stage even though RPA foci are diminished. (i) The graph represents the transition of the number of RPA foci through the post-horsetail stage in bqt1Δ cells. See details of the graph in Figure 3e. Twenty-four of each bqt1Δ cell type, which exhibited normal or defective SPBs, were analysed and plotted until entry into meiosis I.
Figure 5
Figure 5
DNA damage checkpoint and repair independent extension of the post-horsetail stage in bqt1Δ. (a, b) Series of frames from a film of cells undergoing meiosis (a: rad3Δ bqt1Δ, b: rad3Δ bqt1Δ). Cell images were captured every 5 min, and selected time frames are shown. Numbers below the slides represent minutes after Mei4 staining became visible in the nuclei (t0). The post-horsetail stage is highlighted with the orange arrow lines. SPB, Mei4, telomeres and chromosomes were visualised via endogenously tagged Sid4-mCherry, Mei4-mCherry, Taz1-YFP and Hht1-Cerulean, respectively. Scale bars equal 5 μm. (c, d) Distribution graphs for (c) duration of meiotic prophase (t3–t0) and (d) duration of the post-horsetail stage (t3–t1). Median durations are indicated on the right. The outside bars represent interquartile range. Statistically significant differences between single and double mutants are indicated as asterisks (the Mann–Whitney nonparametric test: * at P<0.05, ** at P<0.01 and *** at P<0.001). Data from bqt1Δ cells are phenotypically categorised into normal SPB and defective SPB. Data for WT, rad3Δ and rdh54Δ and data for bqt1Δ are taken from Figures 2a,b and 4d,f. The sample number of the double mutants are; rad3Δ bqt1Δ normal (n=44), rdh54Δ bqt1Δ normal (n=54), rad3Δ bqt1Δ defective (n=55) and rdh54Δ bqt1Δ defective (n=55).
Figure 6
Figure 6
CDK1cyclin B localises at telomeres during meiotic prophase. (ad) Series of frames from films of wild type (a, b) and bqt1Δ (c, d) cells endogenously expressing Cdc2-YFP (a) or Cdc13-YFP (bd), a CDK1-cyclin B marker. Telomeres and the SPB were visualised via endogenously tagged Taz1-mCherry and Sid4-Cerulean, respectively. Cell images were captured every 2 min for (b) and 5 min for (a, c and d), and selected time frames are shown. Numbers below the slides represent minutes from the beginning of the film. Scale bars=5 μm. (a) Localisation of CDK1 (Cdc2) throughout meiosis in wild type. (b) Localisation of CDK1cdc13 throughout meiosis in wild type. CDK1cdc13 spreads throughout the entire nucleus including where the telomeres are positioned and punctuated CDK1cdc13 foci are observed throughout meiotic prophase. A weak CDK1cdc13 focus starts to appear at the SPB late in the horsetail stage, and CDK1cdc13 foci switch from nucleoplasm to the SPB and telomeres at the end of the pre-meiotic phase. Once CDK1cdc13 has accumulated, telomeres are released and SPB separation commences. CDK1cdc13 spreads onto the formed spindle until metaphase. Twenty-two wild-type cells were analysed and all exhibited similar CDK1cdc13 behaviour. (c) In bqt1Δ meiosis, some CDK1cdc13 foci stably adjust their localisation to some telomere foci, but not at the SPB (until 180 min). Nucleoplasmic CDK1cdc13 foci diffuse at the end of meiotic prophase when telomeres disperse (telomere foci resolve) (200 min). The SPB gradually accumulates CDK1cdc13 while microtubules (CDK1cdc13 filaments) appears from nuclei. CDK1cdc13 is eventually degraded and the SPB becomes aggregated and fragmented. (d) Among the bqt1Δ mutants, cells undergoing successful SPB divisions showed accumulation of CDK1cdc13 foci at the SPB during meiotic prophase. In this example, the SPB captured a punctuated CDK1cdc13 focus during the horsetail stage at the 140 min time point, highlighted by a pink arrowhead, where it was retained until entry into meiosis. Such SPBs successfully underwent two subsequent divisions throughout meiosis. CDK1cdc13 relocates once the SPB captures the CDK1cdc13 signal. (e) The nuclei images at the end of meiotic prophase (Top: b, 148 min; Middle: c, 180 min; Bottom: d, 170 min) are enlarged. (f) Distribution graph showing the timing of CDK1cdc13 localisation at SPB after the horsetail stage in wild type (n=24), rdh54Δ (n=26) and bqt1Δ (n=61) cells. The bqt1Δ cells were categorised according to their SPB phenotypes: normal SPB (n=37) and defective SPB (n=24). The x-axis indicates time after SPB settling. Median is indicated on the right. The outside bars represent interquartile range. Significant differences over wild type are indicated as asterisks (the Mann–Whitney nonparametric test: *** at P<0.001). (g) Distribution graph showing the duration of CDK1cdc13 foci at SPB prior to meiotic entry in the bqt1Δ cells. Median is indicated on the right. The outside bars represent interquartile range. A total of 58 bqt1Δ cells were analysed and categorised according to their SPB phenotypes. Among those, 31 cells exhibited defective SPBs and failed to stabilise CDK1cdc13 at the SPB before meiosis (statistical significance from ‘normal SPB’ at P<0.0001, the Mann–Whitney nonparametric test).
Figure 7
Figure 7
Loss of bouquet formation during meiotic prophase leads to aberrant SPB behaviour. (a, b) Series of frames from films (Supplementary Movies S1 and S2) of cells carrying AID-tagged Bqt1 and SCFTIR1 undergoing meiosis without (a) and with (b) auxin. Telomeres and the SPB were visualised via endogenously tagged Rap1-YFP (third panel) and Sid4-Cerulean (bottom panel), respectively. Cell images were captured every 5 min, and selected time frames are shown. Numbers below the slides represent minutes from the beginning of filming. Spore formation was photographed approximately 12 h after filming. Scale bars=5 μm. (a) Without auxin, Bqt1-AID foci (second panel) diminish when telomeres disperse and SPB divides. (b) Auxin-dependent loss of Bqt1-AID-mCherry signal (second panel) and premature termination of the bouquet, represented by dissociation of telomere foci from the SPB, were observed at the 70–80 min time point (arrowhead). Dissociated telomeres remained clustered and dispersed at the 150th minute time point. (c) Graph showing the frequency of dysfunctional SPBs observed with and without auxin and with and without AID tagging. Deletion of bqt1+ (Δ) is shown as a control. All other strains express SCFTIR1. The experiment was repeated in an rdh54Δ background. For auxin-induced Bqt1-AID destruction studies, only cells that exhibited loss of bouquet formation during meiotic prophase were counted (WT: n=76 out of 104, rdh54Δ: n=93 out of 105). Note that a small proportion of cells bearing Bqt1-AID exhibited bouquet defects even without auxin addition, implying that AID tagging can slightly destabilise Bqt1 in the presence of the SCFTIR ubiquitin ligase. (d) Distribution graph of the length of time between Bqt1 loss and the onset of meiosis. Samples from (c) were categorised by SPB phenotypes; WT with normal SPB (n=38), WT with aberrant SPB (n=38), rdh54Δ with normal SPB (n=28), rdh54Δ with aberrant SPB (n=65). Grey and magenta dots indicate normal (functional) and defective SPBs at meiosis, respectively.
Figure 8
Figure 8
Bouquet formation throughout meiotic prophase is crucial for meiotic spindle formation. (ac) Series of frames from films (Supplementary Movies S3, S4, S5, respectively) of rdh54Δ cells carrying Bqt1-AID and SCFTIR1 undergoing meiosis without (a) and with (b, c) auxin. Chromosomes, microtubules and the SPB were visualised via endogenously tagged Hht1-mCherry, GFP-Atb2 and Sid4-Cerulean (bottom panel), respectively. Cell images were captured every 5 min, and selected time frames are shown. Numbers below the slides represent minutes from the beginning of the film. Spore formation was photographed approximately 12 h after filming. Scale bars=5 μm. (a) An example of normal meiosis without auxin addition. Cytoskeleton microtubules promote the SPB and nuclear oscillation during meiotic prophase. Cytoplasmic microtubules depolymerise before spindle formation (at the 110 min time point). Bipolar spindles are established between divided SPBs. (b) Auxin-induced bouquet termination leads to monopolar spindle formation in meiosis I. In this example, disruption of the bouquet, represented by detachment of chromosomes from the SPB, is observed at the 35 min time point (arrowhead). Depolymerisation of cytoplasmic microtubules is observed at the 95 min time point, and a monopolar spindle is formed from a duplicated undivided SPB. One of the SPBs eventually dislodges and another SPB divides and establishes a bipolar spindle at the 225 min time point. (c) Auxin-induced bouquet termination leads to formation of a dysfunctional bipolar spindle (skipping metaphase). In this example, disruption of the bouquet is observed at the 120–130 min time points (arrowhead), followed by microtubule depolymerisation and chromosome condensation at the 180th minute time point. The spindle is not established until the 265 min time point. A monopolar spindle is initially formed and becomes bipolar. However, the established bipolar spindle does not capture chromosomes and immediately elongates and pushes one of the SPBs away. Another SPB, which contacted with chromosomes, establishes a second bipolar spindle at the 320 min time point. (d) Graph showing the frequency of dysfunctional spindles after premature termination of the bouquet stage initiated by addition of auxin. The sample number is indicated above (n=). (e) A model of the telomere checkpoint and spindle control. Our data indicate that chromosome contact with the SPB until a late stage of meiotic prophase is required for the formation of functional spindles. Completion of meiotic recombination is signalled from telomeres to the SPB (Sad1) via CDK to promote timely SPB separation. Therefore, the telomere bouquet synchronises recombination completion and SPB maturation for faithful meiotic progression. (1) During meiotic recombination, DNA breaks activate Rad3 and Chk1, which in turn suppress CDK-cyclin activity and retain bouquet formation. CDK-cyclin starts to localise near the telomeres. (2) Completion of the meiotic recombination stage terminates the Rad3–Chk1 checkpoint. CDK-cyclin accumulates at telomeres and the SPB. (3) Telomeres dissociate from the SPB and CDK initiates SPB separation and spindle formation.

Similar articles

Cited by

References

    1. Harper L, Golubovskaya I, Cande WZ. A bouquet of chromosomes. J Cell Sci 2004; 117: 4025–4032. - PubMed
    1. Scherthan H. A bouquet makes ends meet. Nat Rev Mol Cell Biol 2001; 2: 621–627. - PubMed
    1. Zickler D, Kleckner N. A few of our favorite things: pairing, the bouquet, crossover interference and evolution of meiosis. Semin Cell Dev Biol 2016; 54: 135–148. - PMC - PubMed
    1. Hiraoka Y, Dernburg AF. The SUN rises on meiotic chromosome dynamics. Dev Cell 2009; 17: 598–605. - PubMed
    1. Rog O, Dernburg AF. Chromosome pairing and synapsis during Caenorhabditis elegans meiosis. Curr Opin Cell Biol 2013; 25: 349–356. - PMC - PubMed