. 2017 Jun 30;6(10):e1344804.
doi: 10.1080/2162402X.2017.1344804. eCollection 2017.

Exogenous lipid uptake induces metabolic and functional reprogramming of tumor-associated myeloid-derived suppressor cells

Affiliations

Exogenous lipid uptake induces metabolic and functional reprogramming of tumor-associated myeloid-derived suppressor cells

Amir A Al-Khami et al. Oncoimmunology. .

Abstract

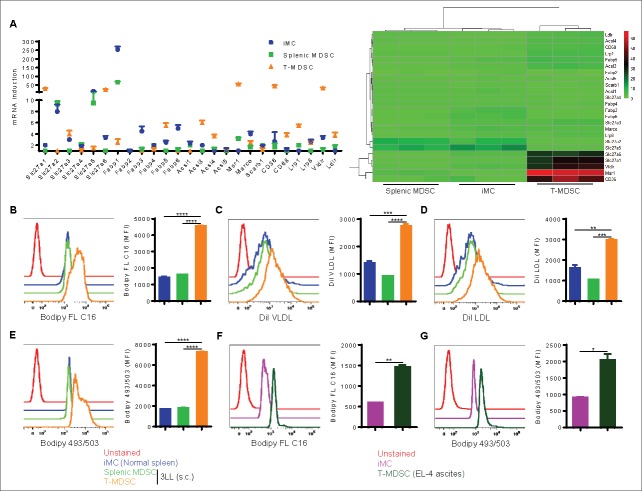
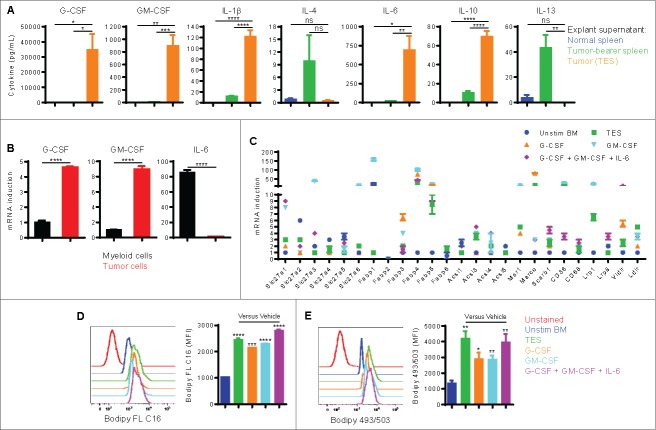
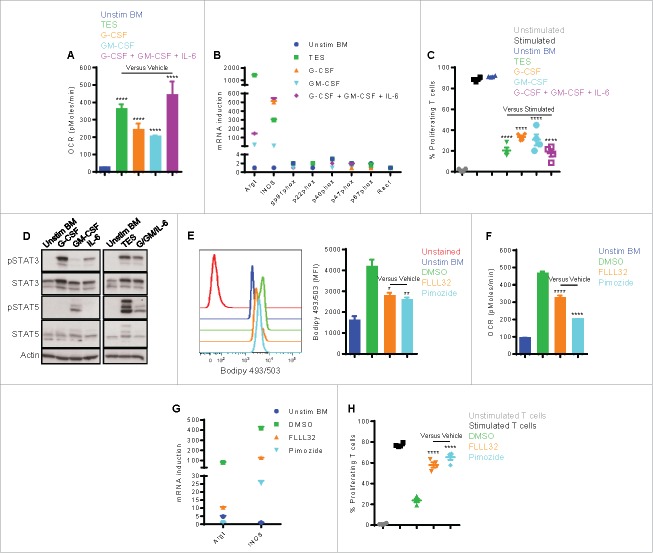
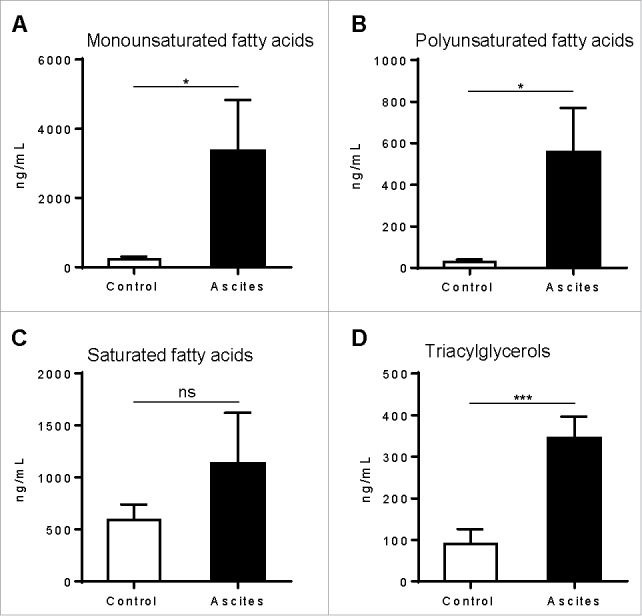
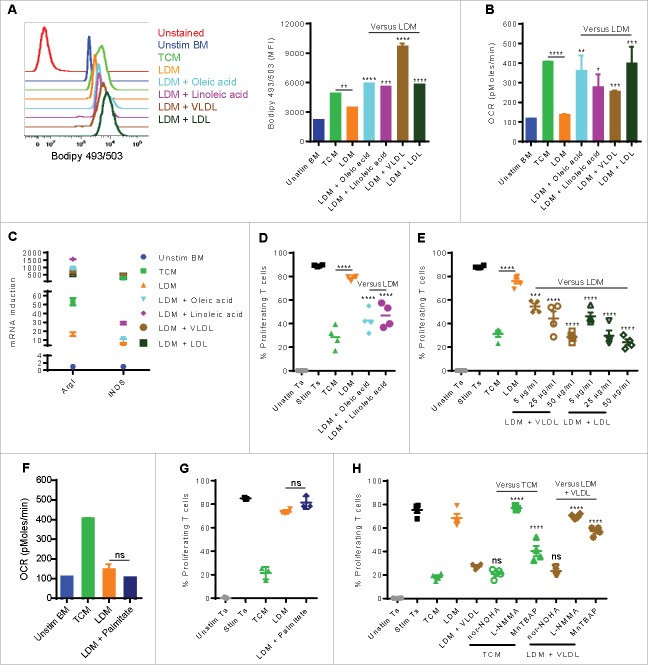
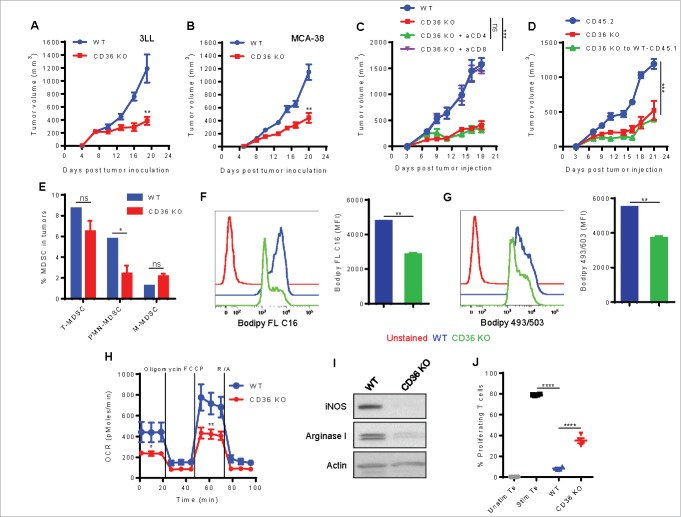
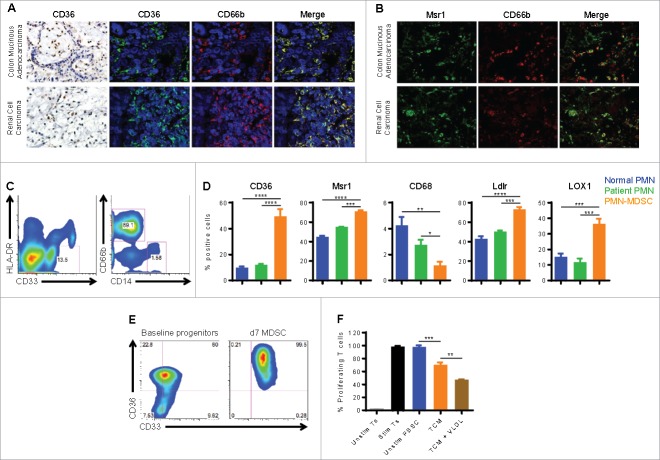
Myeloid-derived suppressor cells (MDSC) promote tumor growth by blocking anti-tumor T cell responses. Recent reports show that MDSC increase fatty acid uptake and fatty acid oxidation (FAO) to support their immunosuppressive functions. Inhibition of FAO promoted a therapeutic T cell-mediated anti-tumor effect. Here, we sought to determine the mechanisms by which tumor-infiltrating MDSC increase the uptake of exogenous lipids and undergo metabolic and functional reprogramming to become highly immunosuppressive cells. The results showed that tumor-derived cytokines (G-CSF and GM-CSF) and the subsequent signaling through STAT3 and STAT5 induce the expression of lipid transport receptors with the resulting increase in the uptake of lipids present at high concentrations in the tumor microenvironment. The intracellular accumulation of lipids increases the oxidative metabolism and activates the immunosuppressive mechanisms. Inhibition of STAT3 or STAT5 signaling or genetic depletion of the fatty acid translocase CD36 inhibits the activation of oxidative metabolism and the induction of immunosuppressive function in tumor-infiltrating MDSC and results in a CD8+ T cell-dependent delay in tumor growth. Of note, human tumor-infiltrating and peripheral blood MDSC also upregulate the expression of lipid transport proteins, and lipids promote the generation of highly suppressive human MDSC in vitro. Our data therefore provide a mechanism by which tumor-derived factors and the high lipid content in the tumor microenvironment can cause the profound metabolic and functional changes found in MDSC and suggest novel approaches to prevent or reverse these processes. These results could further enhance the efficacy of cancer immunotherapy.

Keywords: Immunometabolism; MDSC; immune suppression; lipids; tumor microenvironment.


Figures

Figure 1.
Figure 1.
Tumor-infiltrating MDSC upregulate the expression of lipid transport receptors and take up substantial amounts of exogenous lipids. C57BL/6J mice were subcutaneously injected with 1 × 10⁶ 3LL cells, and tumors and spleens were harvested 3 weeks later. Spleens were also harvested from control mice. (A) RT-PCR of genes that facilitate lipid uptake in sorted iMC, splenic MDSC, and tumor-infiltrating MDSC (T-MDSC), and relative expression heat map is also shown. A gene is differentially expressed when fold > 2 and P < 0.05. (B-D) Lipid uptake was determined in iMC, splenic MDSC, and tumor-infiltrating MDSC by staining single cell suspensions with CD11b and Gr1 followed by the incubation with Bodipy FL C16 (B), DiI VLDL (C), or DiI LDL (D). Histograms were gated on CD11b+Gr1+ cells, and average MFI is shown for each staining. (E) Similarly, intracellular lipid content was measured by staining with Bodipy 493/503, and average MFI is also depicted. (F-G) C57BL/6J mice were intraperitoneally injected with 5 × 10⁵ EL-4 cells, and malignant ascites or normal peritoneal lavage was harvested after 3 weeks. Bodipy FL C16 (F) and Bodipy 493/503 (G) staining were determined in T-MDSC from ascites or iMC from normal peritoneal lavage. Average MFI is shown. Data = mean ± SEM; representative of at least 3 independent experiments; *, P < 0.05; **, P < 0.01; ***, P < 0.001; ****, P < 0.0001.
Figure 2.
Figure 2.
Tumor-derived factors promote the expression of lipid transport receptors and lipid uptake in MDSC. (A) The indicated cytokines were measured in normal spleen explant supernatant, tumor-bearer spleen explant supernatant, or 3LL TES. (B) CD49f+ tumor cells and CD11b+ myeloid cells were sorted by flow cytometry from 3LL subcutaneous tumors. RT-PCR of the indicated genes was conducted. (C-E) BM precursors were cultured for 4 d with 20% TES, G-CSF, GM-CSF, or a combination of G-CSF, GM-CSF, and IL-6. Each cytokine was used at 40 ng/mL. Unstimulated freshly isolated BM cells were used as control. (C) RT-PCR of lipid uptake genes in BM-derived cells. Genes are differentially expressed when fold > 2 and P < 0.05. (D-E) Flow cytometric staining with Bodipy FL C16 (D) and Bodipy 493/503 (E) in CD11b+Gr1+ BM-derived cells. MFI averages are shown. Data = mean ± SEM; representative of at least 3 independent experiments; *, P < 0.05; **, P < 0.01; ***, P < 0.001; ****, P < 0.0001.
Figure 3.
Figure 3.
Tumor-derived factors and signaling through STAT3/5 are critical for inducing the metabolic and functional programming in MDSC. (A-C) BM precursors were cultured for 4 d with 20% TES, G-CSF, GM-CSF, or a combination of G-CSF, GM-CSF, and IL-6. Cytokines were used at 40 ng/mL each. Unstimulated freshly isolated BM cells served as control. (A) OCR (mean ± SD) measured by extracellular flux analysis. (B) RT-PCR of genes linked to MDSC immunosuppressive pathways. Genes are differentially expressed when fold > 2 and P < 0.05. (C) The suppressive function of BM-derived myeloid cells was measured. Activated CFSE-labeled CD3+ T cells were cocultured with BM-derived cells, and T cell proliferation was assessed by flow cytometry 3 d later. (D) STAT3 and STAT5 phosphorylation in BM cells stimulated with G-CSF, GM-CSF, IL-6, TES, a combination of G-CSF, GM-CSF, and IL-6, or vehicle for 30 minutes. (E-H) BM precursors were stimulated with a combination of G-CSF, GM-CSF, and IL-6 in the absence or presence of FLLL32 (3.5 μM) or pimozide (6.5 μM) for 4 d. Vehicle (DMSO) was included. (E) Flow cytometric staining with Bodipy 493/503 in CD11b+Gr1+ BM-derived cells. MFI average is depicted. (F) Mitochondrial respiration evaluated by OCR (mean ± SD). (G) RT-PCR of MDSC immunosuppressive genes. A gene is differentially expressed when fold > 2 and P < 0.05. (H) Suppressive function was assessed. Data = mean ± SEM; representative of at least 3 independent experiments; *, P < 0.05; **, P < 0.01; ****, P < 0.0001.
Figure 4.
Figure 4.
The tumor microenvironment is rich in lipids. C57BL/6J mice were intraperitoneally injected with 5 × 10⁵ EL-4 cells, and supernatants of malignant ascites or normal peritoneal fluid were harvested after 3 weeks using the same volume of PBS (1 mL). Fatty acids and triacylglycerols were extracted and quantitatively analyzed via LC-MS. Depicted are total monounsaturated (A) and polyunsaturated (B) fatty acids, saturated fatty acids (C), and triacylglycerols (D). Data = mean ± SEM; representative of 2 independent experiments; *, P < 0.05; ***, P < 0.001.
Figure 5.
Figure 5.
Exogenous lipids enhance the generation of immunosuppressive MDSC. BM precursors were stimulated with a combination of G-CSF, GM-CSF, and IL-6 for 4 d using TCM, LDM, or LDM supplemented with oleic acid (25 μM), linoleic acid (25 μM), palmitate (25 μM), VLDL (50 μg/mL), or LDL (50 μg/mL). (A) Flow cytometric staining with Bodipy 493/503 in CD11b+Gr1+ BM-derived cells. (B) OCR (mean ± SD) was determined. (C) RT-PCR of MDSC immunosuppressive genes. A gene is differentially expressed when fold > 2 and P < 0.05. (D-E) The immunosuppressive ability of BM-derived cells to suppress T cell proliferation was measured. For the experiment in (E) VLDL and LDL were used at 5, 25, or 50 μg/mL. (F-G) OCR (mean ± SD; F) and suppressive function (G) of BM-derived cells cultured in palmitate-supplemented LDM. (H) Cytokine-stimulated BM cells were cultured in TCM, LDM, or LDM supplemented with VLDL (50 μg/mL). After 4 d, the suppressive function of BM-derived cells was determined with the addition of nor-NOHA (200 μM), L-NMMA (500 μM), or MnTBAP (100 μM) to the T cell-MDSC coculture. Data = mean ± SEM; representative of at least 3 independent experiments; *, P < 0.05; **, P < 0.01; ***, P < 0.001; ****, P < 0.0001.
Figure 6.
Figure 6.
CD36 deletion delays tumor growth and alters the immunometabolic activity of tumor-infiltrating MDSC. (A-B) WT and CD36 KO mice were subcutaneously injected with 3LL cells (A) or MCA-38 cells (B), and tumor growth was recorded. (C) 3LL-bearing mice were injected with depleting antibodies for CD4+ or CD8+ T cells, and tumor growth was measured. (D) BM chimeras were constructed as described in Methods. Tumor growth is depicted. (E-J) WT and CD36 KO mice were subcutaneously injected with 3LL cells, and tumors were removed after 3 weeks for immunometaolic analyses. (E) The frequency of total MDSC, PMN-MDSC, and M-MDSC was determined in WT and CD36 KO tumor single cell suspensions by flow cytometry. (F-G) Flow cytometric staining with Bodipy FL C16 (F) or Bodipy 493/503 (G) in CD11b+Gr1+ tumor-infiltrating MDSC. (H) OCR (mean ± SD) of MDSC sorted from WT or CD36 KO tumors. (I) The expression of arginase I, iNOS, and β-actin was determined by western blot. (J) The immunosuppressive function of MDSC sorted from tumors. Data = mean ± SEM; representative of at least 2 independent experiments; *, P < 0.05; **, P < 0.01; ***, P < 0.001; ****, P < 0.0001.
Figure 7.
Figure 7.
Human cancer-associated MDSC express lipid transport proteins, and lipids promote the regulatory function of PBSC-derived MDSC. (A) Immunohistochemistry for CD36 in colon adenocarcinomas and renal cell carcinomas (left panels; original magnification is 400x). Double immunofluorescence labeling with anti-CD36 (fluorescein) and anti-CD66b (rhodamine) (right panels; nuclei are counterstained with DAPI; original magnification is 600x). (B) Double immunofluorescence labeling with anti-Msr1 (fluorescein) and anti-CD66b (rhodamine) (original magnification is 600x). Data in A-B represent 3 patients. (C) Phenotype of PMN-MDSC (CD33+ HLA-DR−/low CD14 CD66b+) and M-MDSC (CD33+ HLA-DRlow CD14+ CD66b) from the peripheral blood of cancer patients. (D) The percentage of PMN-MDSC expressing CD36, Msr1, CD68, Ldlr, or LOX1 was determined in 10 patients with cancer by flow cytometry. PMN from 10 normal donors and from the same patients were used as controls. (E-F) Human PBSC harvested from G-CSF-treated donors were cultured in TCM with 20 ng/mL GM-CSF and IL-6 for 7 d. (E) The percentage of CD33+CD36+ cells was determined by flow cytometry, compared with baseline peripheral blood progenitor cells. (F) Human PBSC were cultured in the absence or presence of VLDL (50 μg/mL), and the suppressive function was assessed. Data in E-F represent 2 PBSC donors. Data = mean ± SEM; **, P < 0.01; ***, P < 0.001; ****, P < 0.0001.

References

    1. Bronte V, Brandau S, Chen SH, Colombo MP, Frey AB, Greten TF, Mandruzzato S, Murray PJ, Ochoa A, Ostrand-Rosenberg S, et al.. Recommendations for myeloid-derived suppressor cell nomenclature and characterization standards. Nat Commun 2016; 7:12150; PMID:27381735; https://doi.org/10.1038/ncomms12150 - DOI - PMC - PubMed
    1. Macatangay BJ, Landay AL, Rinaldo CR. MDSC: A new player in HIV immunopathogenesis. AIDS 2012; 26:1567-9; PMID:22810370; https://doi.org/10.1097/QAD.0b013e328355e682 - DOI - PMC - PubMed
    1. Makarenkova VP, Bansal V, Matta BM, Perez LA, Ochoa JB. CD11b+/Gr-1+ myeloid suppressor cells cause T cell dysfunction after traumatic stress. J Immunol 2006; 176:2085-94; PMID:16455964; https://doi.org/10.4049/jimmunol.176.4.2085 - DOI - PubMed
    1. Marvel D, Gabrilovich DI. Myeloid-derived suppressor cells in the tumor microenvironment: Expect the unexpected. J Clin Invest 2015; 125:3356-64; PMID:26168215; https://doi.org/10.1172/JCI80005 - DOI - PMC - PubMed
    1. Parker KH, Beury DW, Ostrand-Rosenberg S. Myeloid-derived suppressor cells: Critical cells driving immune suppression in the tumor microenvironment. Adv Cancer Res 2015; 128:95-139; PMID:26216631; https://doi.org/10.1016/bs.acr.2015.04.002 - DOI - PMC - PubMed

Publication types