. 2017 Jul 5;6(10):e1345402.
doi: 10.1080/2162402X.2017.1345402. eCollection 2017.

Mutations in JAK2 and Calreticulin genes are associated with specific alterations of the immune system in myelofibrosis

Affiliations

Mutations in JAK2 and Calreticulin genes are associated with specific alterations of the immune system in myelofibrosis

Marco Romano et al. Oncoimmunology. .

Abstract

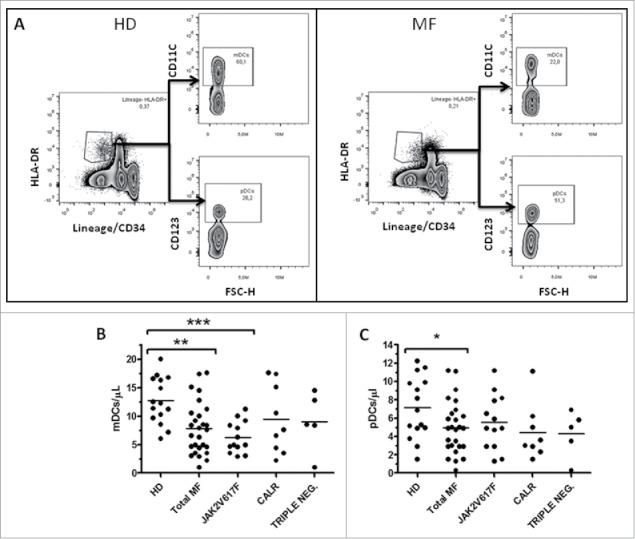
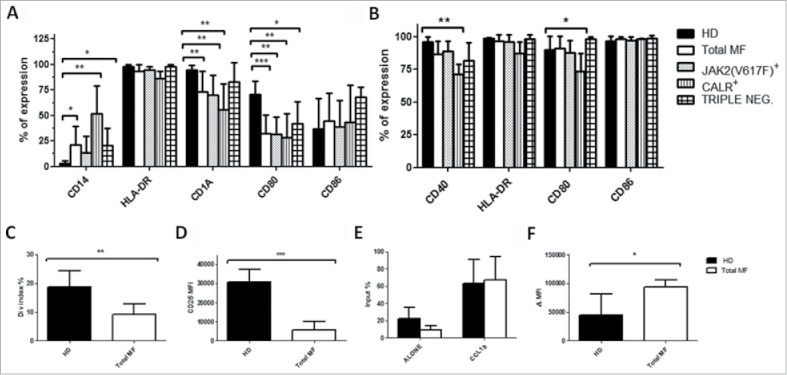
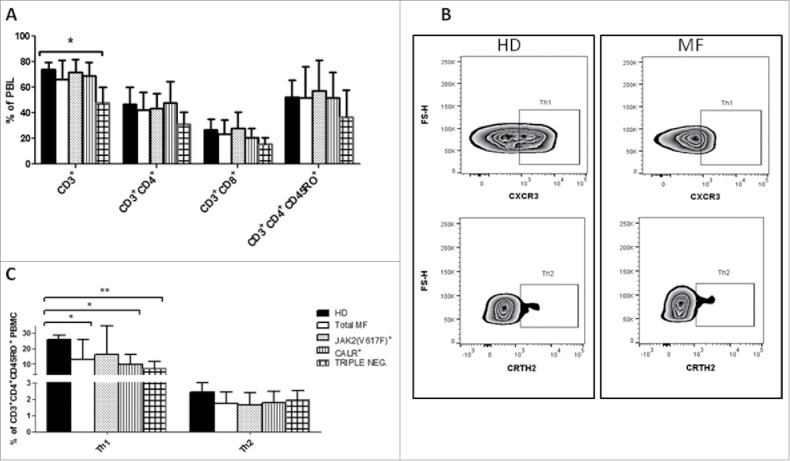
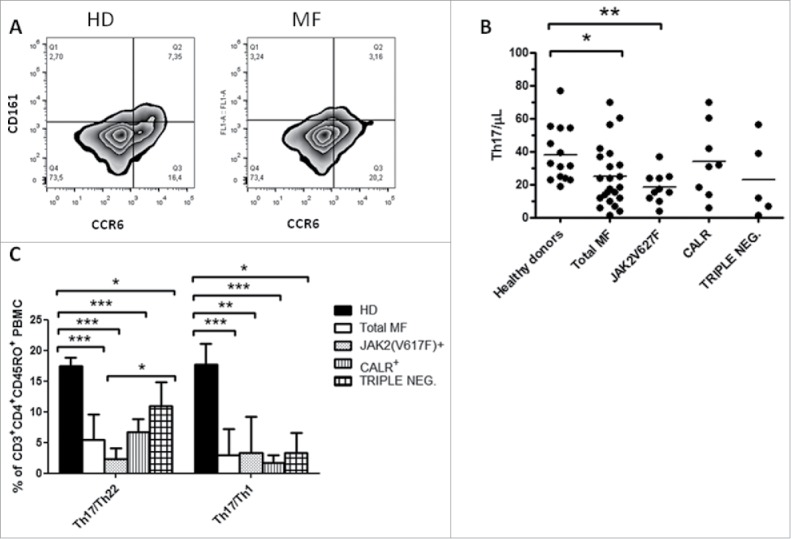
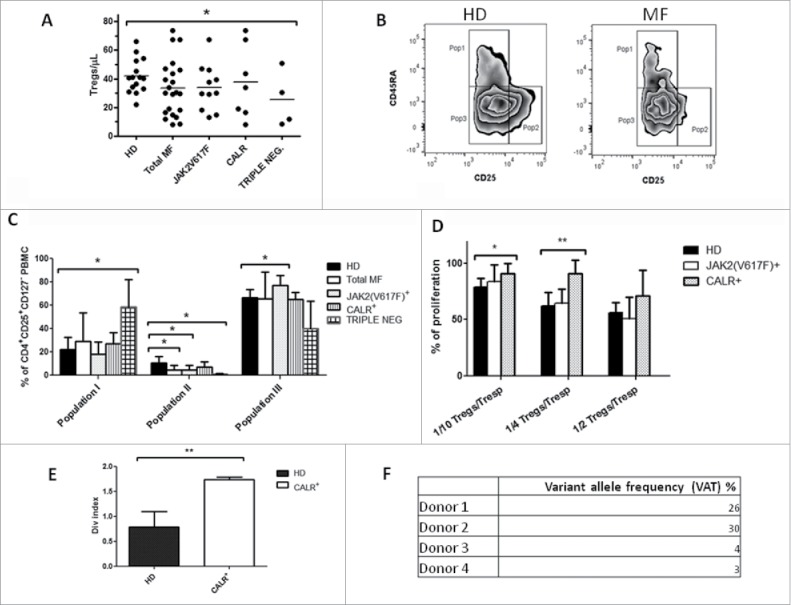
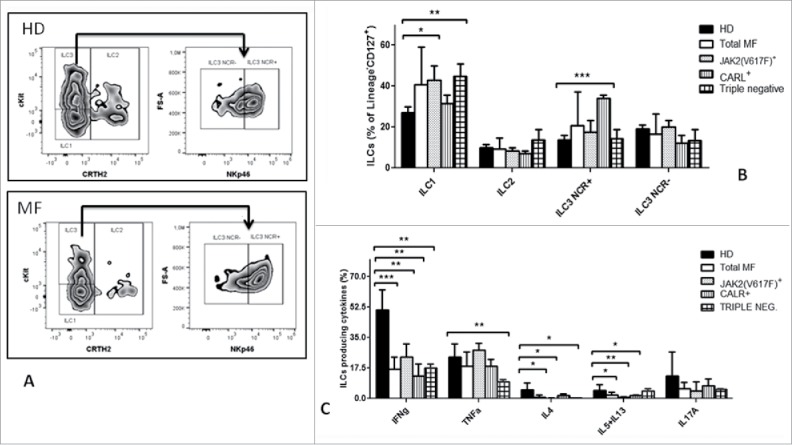
Myelofibrosis (MF) is a clonal neoplasia associated with chronic inflammation due to aberrant cytokine production. Mutations in Janus Kinase-2 (JAK2), calreticulin (CALR) and myeloproliferative leukemia protein (MPL) genes have been recently associated to MF and they all activate the JAK/STAT signaling pathway. Since this pathway is essential in shaping the immune response, we investigated the role of circulating immune subsets and cytokines in 38 patients (20 carrying JAK2(V617F),13 exon-9 CALR mutation and 5 triple negative). In comparison to healthy donors, patients presented a reduced amount of circulating dendritic cells (DCs) associated with a defective ability of monocytes in differentiating into DCs. In addition, we found a reduction in circulating T-helper (Th)1 and Th17 and hypo-functional innate lymphoid cells (ILC). Results analyzed according to the mutational status showed that patients carrying JAK2(V617F) mutation had a reduction in Th17, myeloid-DCs and effector Tregs as well as increased ILC1 and cytokine producing Tregs. The CALR mutated patients revealed high ILC3 levels, reduced Th1 and their monocytes had a reduced capacity to mature in vitro into fully committed DCs. Their Tregs were also less effective in inhibiting the proliferation of autologous effector T-cells due to an increased proliferative status induced by CALR mutation. Triple negative patients presented a reduced amount of total circulating CD3, effectors Tregs and Th1 with increased ILC1. Overall, we have demonstrated that in MF different mutations lead to phenotypic and functional alterations in different immune subsets that may have a potential role in disease progression and susceptibility to infections.

Keywords: Calreticulin; Immune dysregulation; JAK2(V617F); Myelofibrosis; chronic inflammation.


Figures

Figure 1.
Figure 1.
Reduced circulating mDCs in JAK2(V617F) mutated patients. A) Representative example of the gating strategy used to determine, in HD (left panels) and MF patients (right panels), the percentages used to calculate the circulating level of mDCs (identified as LinHLA-DR+CD11c+ cells) and pDCs (identified as LinHLA-DR+CD123+ cells). Circulating number of mDCs (B) and pDCs (C) in HD (n = 17), total MF (n = 27), JAK2(V617F) mutated (n = 13), CALR mutated (n = 9) and triple negative (n = 5) patients are shown; cell concentrations were calculated as follows: (percentage of positive cells) x (white blood cell count)/100. For all graphs one symbol represents one individual, and the height of the bar represents the mean (*p ≤ 0.05, **p ≤ 0.01, (***p ≤ 0.001).
Figure 2.
Figure 2.
Impaired DCs differentiation capacity of monocytes from MF patients. Immature (A) and mature (B) mo-DCs phenotype from HD (n = 10) total MF (n = 16), JAK2(V617F) mutated (n = 7), CALR mutated (n = 5) and triple negative (n = 4) patients. The expression of HLA-DR, CD14, CD1a, CD40, CD80 and CD86 was evaluated by flow cytometry. Histograms represent the mean percentage of expression ± SD; C) ability of mo-DCs from HD (n = 8), total MF (n = 8) to prime allogeneic T-cell responses in vitro. mo-DCs were cultured with allogeneic Tresp (mo-DCs/Tresp ratio 1:10) labeled with CFSE. The assays were performed over a period of 5 days and T cell proliferation was evaluated by division index. Histograms represent the mean ± SD of the division index expressed as percentages; D) mo-DCs were cultured with allogeneic Tresp (mo-DCs/Tresp ratio 1:10) labeled with CFSE. The assays were performed over a period of 5 days and CD25 expression was evaluated by flow cytometry. Histograms represent the mean MFI ± SD of CD25 from HD (n = 8) and total MF (n = 8) to prime allogeneic T-cell responses in vitro; E) evaluation of spontaneous and toward CCL19 (400 ng/mL) mature mo-DCs migratory capacity in HD (n = 6) and MF patients (n = 8). 1 × 10⁵ cells were seeded in a transwell chamber (diameter 6.5 mm, pore size 8 µm) for 4 hours. The amount of migrated cells is expressed as a percentage of the input: (number of migrated cells in the lower compartment/loaded cells in the upper compartment) X 100. Histograms represent the mean ± SD of the input; F) Immature mo-DCs dextran uptake in HD (n = 6) and MF patients (n = 8). Cells were incubated for 30 min at 37°C or on ice (used as a background control). After washing, fluorescence was analyzed by flow cytometry. Uptake of FITC-dextran was expressed as delta (Δ) mean fluorescence intensity (MFI): MFI (uptake at 37°C) – MFI (uptake on ice). Histograms represent the mean ± SD of dextran uptake (* p ≤ 0.05, ** p ≤ 0.01, *** p ≤ 0.001).
Figure 3.
Figure 3.
Reduced Th-1 compartment in CALR mutated patients A) Percentages of CD3+, CD3+CD4+, CD3+CD8+, CD3+CD4+ CD45RO+ cells on PBMC from HD (n = 14), total MF (n = 16), JAK2(V617F) mutated (n = 7), CALR mutated (n = 5) and triple negative (n = 4) patients evaluated by flow cytometry; B) Representative example of the gating strategy used to determine by flow cytometry, in HD (left panels) and MF patients (right panels), the percentages used to identify Th-1 and Th-2 (identified as CD3+CD4+CD45RO+CXCR3+CRTH2CCR6 and CD3+CD4+CD45RO+CXCR3CRTH2+ cells,respectively); C) Percentages of Th1 and Th2 cells on the CD3+CD4+CD45RO+ population from HD (n = 14), total MF (n = 16), JAK2(V617F) mutated (n = 7) and CALR mutated (n = 5) and triple negative (n = 4) patients. Histograms represent the mean percentages ± SD (* p ≤ 0.05, ** p ≤ 0.01).
Figure 4.
Figure 4.
JAK2(V617F) mutated patients show a reduced Th17 compartment. A) Representative example of the gating strategy used to determine by flow cytometry, in HD (left panels) and MF patients (right panels), the percentages used to calculate the circulating level of Th17 (identified as CD3+CD4+CCR6+CD161+ cells); B) PB circulating number of Th17 in HD (n = 19), total MF (n = 23), JAK2(V617F) mutated (n = 10) CALR mutated (n = 8) and triple negative (n = 5) patients; cell concentrations were calculated as follows: (percentage of positive cells) x (Lymphocyte count)/100. Each symbol represents one individual and the height of the bar represents the mean; C) Percentages of Th17/Th1 and Th17/Th22 (identified as CD3+CD4+CD45RO+CXCR3+CRTH2CCR6+ and CD3+CD4+CD45RO+CXCR3CRTH2CCR6+ cells, respectively) in HD (n = 14), total MF (n = 16), JAK2(V617F) mutated (n = 7) CALR mutated (n = 5) and triple negative (n = 4) patients. Histograms represent mean percentage expression on the CD3+CD4+CD45RO+ population ± SD (* p ≤ 0.05, **p ≤ 0.01, ***p ≤ 0.001).
Figure 5.
Figure 5.
JAK2(V617F) mutated patients present a different Tregs heterogeneity in periphery. A) PB circulating number of Tregs (identified as CD3+CD4+CD25+CD127low cells) in HD (n = 17), total MF (n = 22), JAK2(V617F) mutated (n = 11), CALR mutated (n = 7) and triple negative (n = 4) patients; cell concentrations were calculated as follows: (percentage of positive cells) x (lymphocyte count)/100. Each symbol represents one individual and the height of the bar represents the mean; B) Representative example of the gating strategy used to determine by flow cytometry, in HD (left panels) and MF patients (right panels), the percentages of CD3+CD4+CD45RA+CD25+CD127low (population I), CD3+CD4+CD45RACD25brightCD127low (population II) and CD3+CD4+CD45RACD25+CD127 (population III) cells; C) Percentages of Population I, II and III in HD (n = 14), total MF (n = 16), JAK2(V617F) mutated (n = 7) CALR mutated (n = 5) and triple negative (n = 4) patients.. Histograms represent mean percentage expression on the CD3+CD4+CD25+CD127 population ± SD; D) Co-colture (5 days) of autologous Treg from HD (n = 9), JAK2(V617F) mutated (n = 4) and CALR mutated (n = 4) patients with autologous CD4+CD25 (Tresp) stimulated with anti-CD3 and anti-CD28 (5µg/mL) and labeled with CFSE. Percentage of proliferation was calculated as: (ratio between the” upper generation proliferation index” of Tresp cultured in the presence of increasing Treg ratios and the” upper generation proliferation index” of CTR culture, where no Treg were added)x100; histograms represent mean ± SD; E) Proliferation of CD4+CD25 from CALR mutated patients (n = 4) and HD (n = 4) stimulated with anti-CD3 and anti-CD28. Proliferation is calculated using the division index (average number of cell divisions that a cell in the original population has undergone); histograms represent mean ± SD; F) CALR exon 9 sequencing performed by Next Generation Sequencing to evaluate the variant allele frequency (VAT) expressed as percentages. Data indicate the percentages of mutated reads analyzed. (* p ≤ 0.05, **p ≤ 0.01).
Figure 6.
Figure 6.
Selected subsets of ILCs with reduced functional capacity are expanded in MF patients. A) Representative example of the gating strategy used to determine by flow cytometry, in HD (upper panels) and MF patients (lower panels), the percentage of: ILC1 identified as LinCD127+CRTH2cKitCD56 cells; ILC2 identified as LinCD127+ CRTH2+cKit+/− cells; ILC3 identified as LinCD127+CRTH2 cKit+NKp46 cells that were further characterized by the expression of the natural cytotoxicity receptor(NCR). B) Histograms represent the percentages ± SD of selected ILC subpopulation in HD (n = 21), total MF (n = 23), JAK2(V617F) mutated (n = 12) and CALR mutated (n = 6) and triple negative (n = 5) patients. C) PBMCs were stimulated ex vivo for 3 hours, then an intracellular staining was performed. Histograms represent the mean ± SD of the percentage of ILCs (LinCD127+cells) producing IFN-γ, TNF-α, IL4, IL5 plus IL13, IL17A in HD (n = 21), total MF patients (n = 21), JAK2(V617F)+ (n = 12) CALR+ (n = 6) and triple negative patients (n = 4). (* p ≤ 0.05, **p ≤ 0.01, ***p ≤ 0.001).

Similar articles

Cited by

References

    1. Vardiman JW, Thiele J, Arber DA, Brunning RD, Borowitz MJ, Porwit A, Harris NL, Le Beau MM, Hellström-Lindberg E, Tefferi A, et al.. The 2008 revision of the World Health Organization (WHO) classification of myeloid neoplasms and acute leukemia: rationale and important changes. Blood 2009; 114:937-51; https://doi.org/10.1182/blood-2009-03-209262 - DOI - PubMed
    1. James C, Ugo V, Casadevall N, Constantinescu SN, Vainchenker W. A JAK2 mutation in myeloproliferative disorders: pathogenesis and therapeutic and scientific prospects. Trends Mol Med 2005; 11:546-54; https://doi.org/10.1016/j.molmed.2005.10.003 - DOI - PubMed
    1. Lavi N. Calreticulin mutations in myeloproliferative neoplasms. Rambam Maimonides Med J 2014; 5:e0035; PMID:25386351; https://doi.org/10.5041/RMMJ.10169 - DOI - PMC - PubMed
    1. Rampal R, Al-Shahrour F, Abdel-Wahab O, Patel JP, Brunel JP, Mermel CH, Bass AJ, Pretz J, Ahn J, Hricik T, et al.. Integrated genomic analysis illustrates the central role of JAK-STAT pathway activation in myeloproliferative neoplasm pathogenesis. Blood 2014; 123:e123-33; PMID:24740812; https://doi.org/10.1182/blood-2014-02-554634 - DOI - PMC - PubMed
    1. Passamonti F, Cervantes F, Vannucchi AM, Morra E, Rumi E, Pereira A, Guglielmelli P, Pungolino E, Caramella M, Maffioli M, et al.. A dynamic prognostic model to predict survival in primary myelofibrosis: a study by the IWG-MRT (International Working Group for Myeloproliferative Neoplasms Research and Treatment). Blood 2010; 115:1703-8; PMID:20008785; https://doi.org/10.1182/blood-2009-09-245837 - DOI - PubMed

Publication types