

Thirty Years of Sweat Chloride Testing at One Referral Center
- PMID: 29124052
- PMCID: PMC5662556
- DOI: 10.3389/fped.2017.00222
Thirty Years of Sweat Chloride Testing at One Referral Center
Abstract
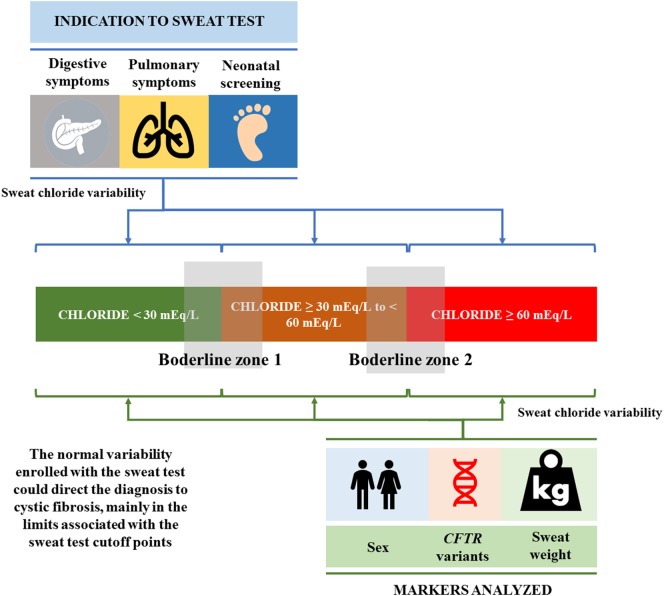
Objective: To conduct a descriptive analysis of the sweat test (ST), associating ST results with epidemiological data, CFTR (cystic fibrosis transmembrane conductance regulator) mutations and reasons to indicate the ST, as well as correlating sweat sodium and sweat chloride concentrations in subjects.
Methods: Retrospective survey and descriptive analysis of 5,721 ST at a university referral center.
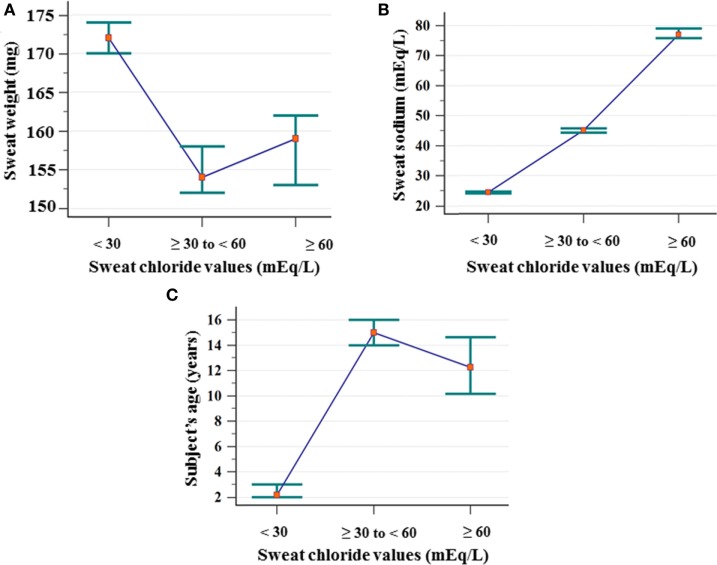
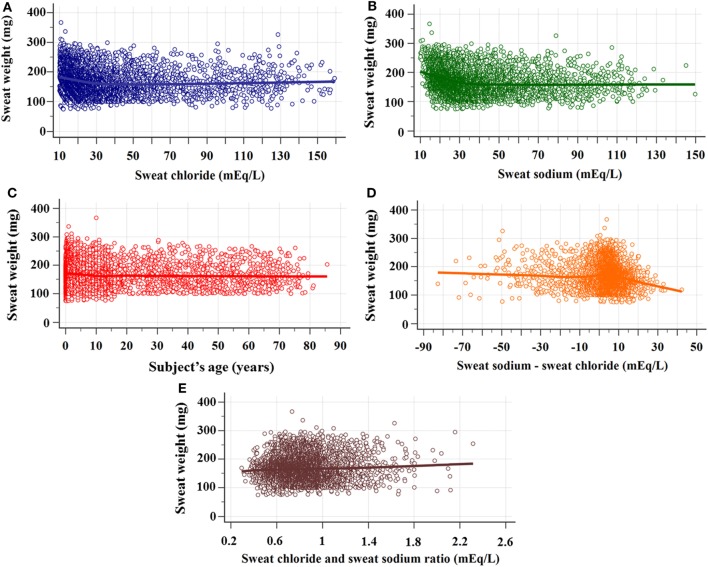
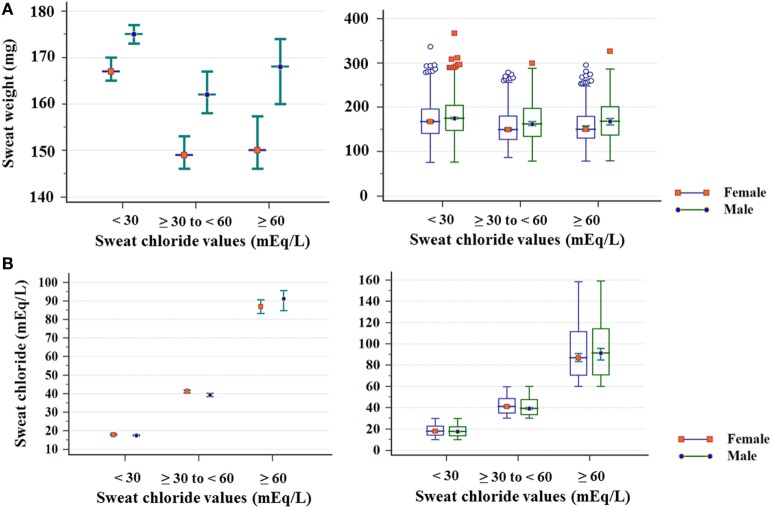
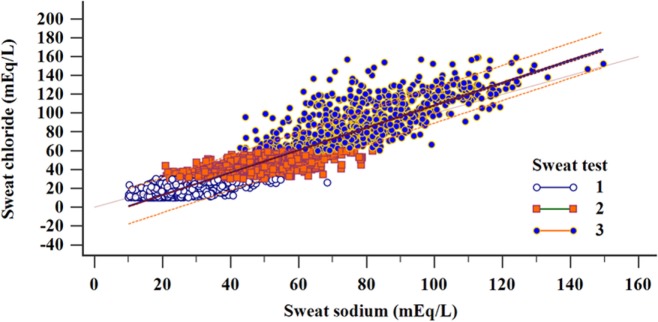
Results: The inclusion of the subjects was based on clinical data related with cystic fibrosis (CF) phenotype. The samples were grouped by (i) sweat chloride concentrations (mEq/L): <30: 3,249/5,277 (61.6%); ≥30 to <60: 1,326/5,277 (25.1%); ≥60: 702/5,277 (13.3%) and (ii) age: (Group A--GA) 0 to <6 months; (Group B--GB) ≥6 months to <18 years; (Group C--GC) ≥18 years. Digestive symptoms showed higher prevalence ratio for the CF diagnosis as well as association between younger age and higher values of sweat chloride, sweat sodium, and chloride/sodium ratio. The indication of ST due to respiratory symptoms was higher in GB and associated with greater age, lower values of sweat chloride, sweat sodium, and chloride/sodium ratio. There was higher prevalence of ST with sweat chloride levels <30 mEq/L in GB, ≥60 mEq/L in GC, and with borderline level in GB. There was positive correlation between sweat sodium and sweat chloride. Sweat chloride/sweat sodium and sweat sodium-sweat chloride indexes showed association with sex, reason for ST indication, and CFTR mutations. Sex alters some values presented in the ST. The number of ST/year performed before and after the newborn screening implementation was the same; however, we observed a higher number of borderlines values. A wide spectrum of CFTR mutation was found. Severe CFTR mutations and F508del/F508del genotype were associated with highest probability of ST chloride levels ≥60 mEq/L, and the absence of CFTR mutations identified was associated with borderline ST and respiratory symptoms.
Conclusions: ST data showed wide variability dependent on age, sex, reason for examination indication, CFTR mutations, and weight of the collected sweat sample. Sweat sodium concentration is directly correlated with sweat chloride levels and it could be used as a quality parameter.
Keywords: cystic fibrosis; diagnosis; sweat chloride; sweat sodium; sweat test.
Figures
Similar articles
-
Quality of sweat test (ST) based on the proportion of sweat sodium (Na) and sweat chloride (Cl) as diagnostic parameter of cystic fibrosis: are we on the right way?Diagn Pathol. 2016 Oct 26;11(1):103. doi: 10.1186/s13000-016-0555-6. Diagn Pathol. 2016. PMID: 27784314 Free PMC article.
-
CFTR genotype and clinical outcomes of adult patients carried as cystic fibrosis disease.Gene. 2014 May 1;540(2):183-90. doi: 10.1016/j.gene.2014.02.040. Epub 2014 Feb 26. Gene. 2014. PMID: 24583165
-
Chloride and sodium ion concentrations in saliva and sweat as a method to diagnose cystic fibrosis.J Pediatr (Rio J). 2019 Jul-Aug;95(4):443-450. doi: 10.1016/j.jped.2018.04.005. Epub 2018 May 19. J Pediatr (Rio J). 2019. PMID: 29782810
-
The diagnosis of cystic fibrosis.Presse Med. 2017 Jun;46(6 Pt 2):e97-e108. doi: 10.1016/j.lpm.2017.04.010. Epub 2017 May 31. Presse Med. 2017. PMID: 28576637 Review.
-
Genetic diagnosis in practice: From cystic fibrosis to CFTR-related disorders.Arch Pediatr. 2020 Feb;27 Suppl 1:eS25-eS29. doi: 10.1016/S0929-693X(20)30047-6. Arch Pediatr. 2020. PMID: 32172933 Review.
Cited by
-
Evaluation of continuous constant current and continuous pulsed current in sweat induction for cystic fibrosis diagnosis.BMC Pulm Med. 2018 Sep 14;18(1):153. doi: 10.1186/s12890-018-0696-3. BMC Pulm Med. 2018. PMID: 30217179 Free PMC article.
-
Novel, rare and common pathogenic variants in the CFTR gene screened by high-throughput sequencing technology and predicted by in silico tools.Sci Rep. 2019 Apr 17;9(1):6234. doi: 10.1038/s41598-019-42404-6. Sci Rep. 2019. PMID: 30996306 Free PMC article.
-
Use of ivacaftor in late diagnosed cystic fibrosis monozygotic twins heterozygous for F508del and R117H-7T - a case report.BMC Pulm Med. 2019 Apr 11;19(1):76. doi: 10.1186/s12890-019-0840-8. BMC Pulm Med. 2019. PMID: 30975115 Free PMC article.
-
Diagnosing Cystic Fibrosis in the 21st Century-A Complex and Challenging Task.Diagnostics (Basel). 2024 Apr 3;14(7):763. doi: 10.3390/diagnostics14070763. Diagnostics (Basel). 2024. PMID: 38611676 Free PMC article. Review.
-
Liver Failure in a Chinese Cystic Fibrosis Child With Homozygous R553X Mutation.Front Pediatr. 2019 Feb 20;7:36. doi: 10.3389/fped.2019.00036. eCollection 2019. Front Pediatr. 2019. PMID: 30842938 Free PMC article.
References
-
- Gibson LE, Cooke RE. A test for concentration of electrolytes in sweat in cystic fibrosis of the pancreas utilizing pilocarpine by iontophoresis. Pediatrics (1959) 23:23–5. - PubMed
LinkOut - more resources
Full Text Sources
Other Literature Sources
Miscellaneous