. 2017 Aug 30;3(4):481-486.
doi: 10.1016/j.trci.2017.08.004. eCollection 2017 Nov.

Measuring brain synaptic vesicle protein 2A with positron emission tomography and [18F]UCB-H

Affiliations

Measuring brain synaptic vesicle protein 2A with positron emission tomography and [18F]UCB-H

Mohamed Ali Bahri et al. Alzheimers Dement (N Y). .

Abstract

Introduction: Brain distribution of synaptic vesicle protein 2A was measured with fluorine-18 UCB-H ([18F]UCB-H) and positron emission tomography (PET).

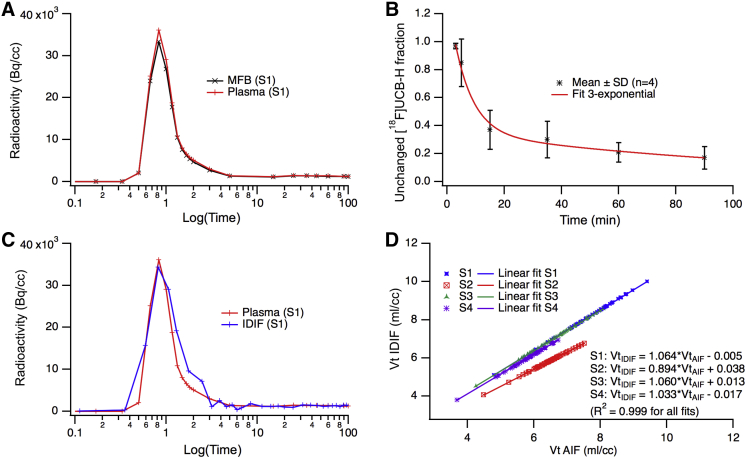
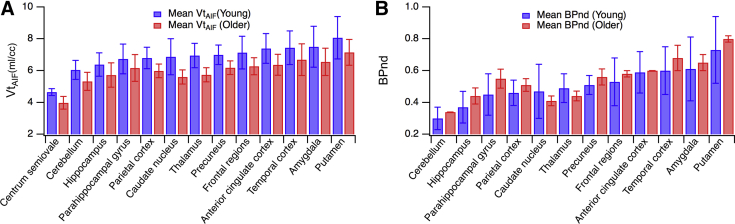
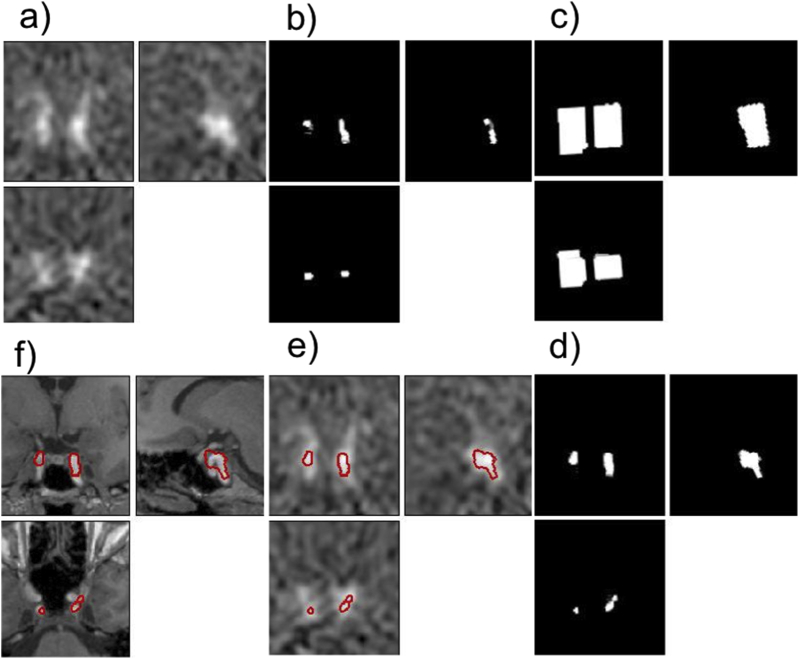
Methods: Images of synaptic density were acquired in healthy volunteers (two young participants and two seniors). Input function was measured by arterial blood sampling (arterial input function) and derived from PET images using carotid activity (image-derived input function). Logan graphical analysis was used to estimate regional synaptic vesicle protein 2A distribution volume.

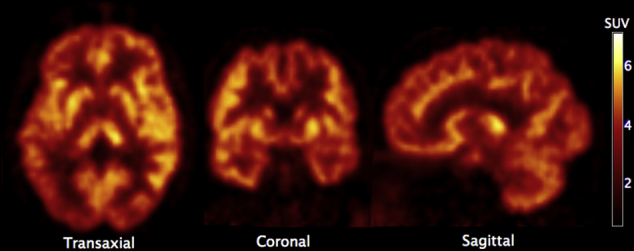
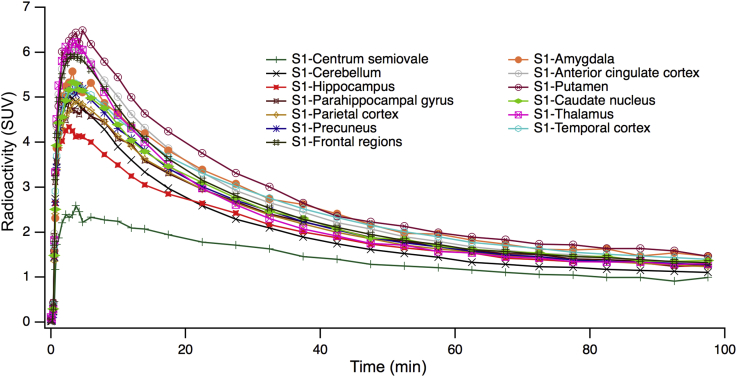
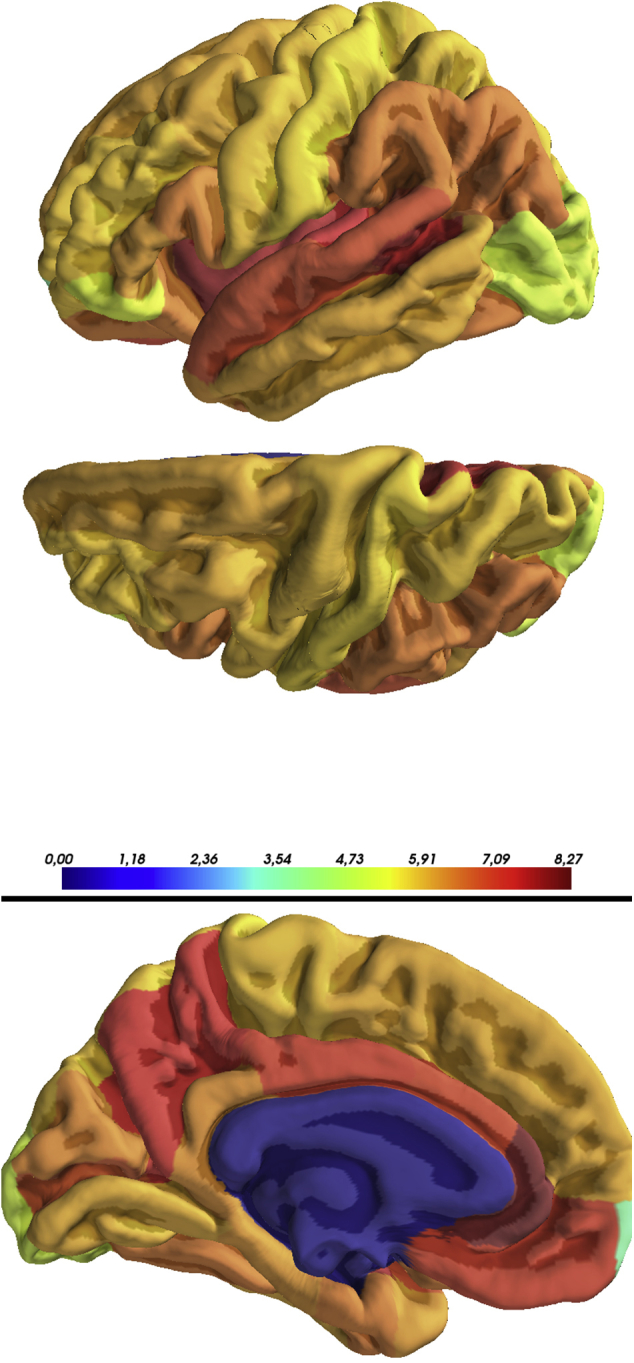
Results: [18F]UCB-H uptake was ubiquitous in cortical and subcortical gray matter. Arterial input function and image-derived input function provided regional distribution volume with a high linear relationship.

Discussion: The cerebral distribution of [18F]UCB-H is similar to that recently observed with carbon-11 UCB-J ([11C]UCB-J). An accurate [18F]UCB-H quantification can be performed without invasive arterial blood sampling when no suitable reference region is available, using dynamic PET carotid activity. Brain synaptic density can be studied in vivo in normal and pathological aging.

Keywords: Alzheimer's disease; Fluorine-18; Neuroimaging; PET; SV2A; Synapse density.


Figures

Fig. 1
Fig. 1
PET image of the synaptic vesicle protein 2A (SV2A)–specific tracer [18F]UCB-H in a healthy volunteer (average of dynamic images: subject 1, young participant). Radioactivity expressed as standardized uptake value (SUV, normalized to the injected dose and body weight).
Fig. 2
Fig. 2
Time activity curves (TACs) for the selected brain regions of subject 1 (mean left and right hemispheres). Activity expressed as standardized uptake value (SUV).
Fig. 3
Fig. 3
Input function (IF) evaluation for [18F]UCB-H tracer: (A) [18F]UCB-H in blood (MFB, measured full blood) and in plasma (S1, subject 1). Radioactivity in Becquerel per cubic centimeter (Bq/cc); (B) Mean unchanged [18F]UCB-H in plasma for the four participants. SD, standard deviation; (C) Image-derived input function (IDIF) scaled to match the plasma measures using the last three plasma values and measured plasma IF (plasma; subject 1); (D) Scatter plot representing distribution volumes obtained with image-derived IF (VtIDIF) versus distribution volumes obtained with arterial IF (VtAIF). S1 to S4 are participants. Distribution volumes were estimated using the Logan graphical analysis method for all Automated Anatomical Labeling brain atlas regions. We could not find any clinical or paraclinical information to explain the difference between S2 and the other volunteers.
Fig. 4
Fig. 4
PET quantitative data of [18F]UCB-H tracer in a healthy human brain: (A) regional volumes of distribution (Vt in mL per cubic centimeter) obtained by the Logan graphical analysis model applied to time-activity curves using arterial input function (AIF, means ± SD, n = 2 for each group); (B) BPND values (binding potential calculated using centrum semiovale region with “nondisplaceable” activity) calculated as Vt(region)/Vt(centrum_semiovale)−1.
Supplementary Fig. 1
Regional distribution volume (Vt) in the left hemisphere of the brain (subject 3). The Vt map was created in the subject space using a Logan model and registered to the corresponding structural magnetic resonance imaging (MRI) image. After segmentation of the structural MRI image using FreeSurfer processing, Vt values for all FreeSurfer regions of interest were extracted in a three-dimensional map.
Supplementary Fig. 2
(a) PET image (frame number 3) showing the carotids on which coordinates of the highest local maximum (one for each carotid) are automatically extracted and provided to the MATITK Connected Threshold Segmentation method to obtain the “seeding region”. This seeding region (b) is dilated to obtain “the subset mask” (c). (d) shows the mask of final voxels contributing to image-derived input function (IDIF). These voxels were extracted using Pearson Correlation method. (e) and (f) show the boundary of the extracted voxels superimposed on the PET and MRI images, respectively.

References

    1. Hyman B.T., Phelps C.H., Beach T.G., Bigio E.H., Cairns N.J., Carrillo M.C. National Institute on Aging-Alzheimer's Association guidelines for the neuropathologic assessment of Alzheimer's disease. Alzheimers Dement. 2012;8:1–13. - PMC - PubMed
    1. Spires-Jones T.L., Hyman B. The Intersection of amyloid beta and tau at synapses in Alzheimer's disease. Neuron. 2014;82:756–771. - PMC - PubMed
    1. Pozueta J., Lefort R., Shelanski M.L. Synaptic changes in Alzheimer's disease and its models. Neuroscience. 2013;251:51–65. - PubMed
    1. Jack C.R., Holtzman D.M. Biomarker modeling of Alzheimer's disease. Neuron. 2013;80:1347–1358. - PMC - PubMed
    1. Mendoza-Torreblanca J.G., Vanoye-Carlo A., Phillips-Farfán B.V., Carmona-Aparicio L., Gómez-Lira G. Synaptic vesicle protein 2A: Basic facts and role in synaptic function. Eur J Neurosci. 2013;38:3529–3539. - PubMed