. 2015 Mar 24:1:68-77.
doi: 10.1016/j.bbrep.2015.03.004. eCollection 2015 May.

Influence of chemical denaturants on the activity, fold and zinc status of anthrax lethal factor

Affiliations

Influence of chemical denaturants on the activity, fold and zinc status of anthrax lethal factor

Suet Y Lo et al. Biochem Biophys Rep. .

Abstract

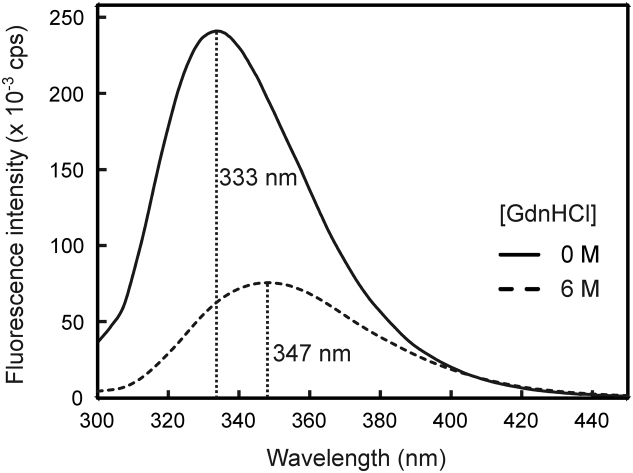
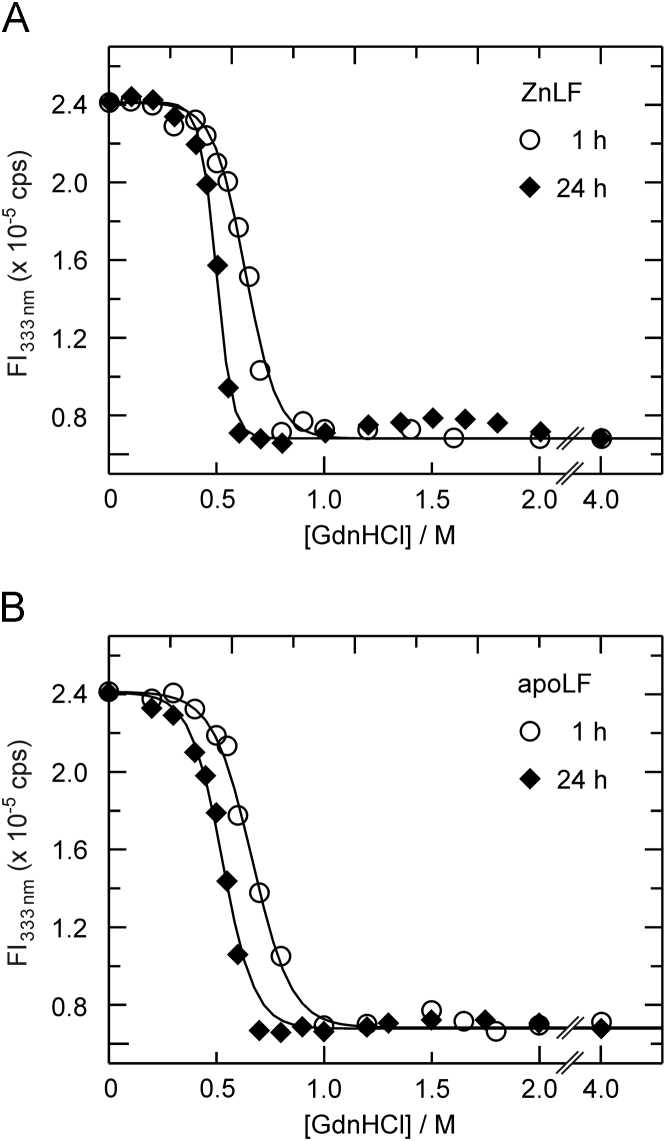
Anthrax lethal factor (LF) is a zinc-dependent endopeptidase which, through a process facilitated by protective antigen, translocates to the host cell cytosol in a partially unfolded state. In the current report, the influence of urea and guanidine hydrochloride (GdnHCl) on LF׳s catalytic function, fold and metal binding was assessed at neutral pH. Both urea and GdnHCl were found to inhibit LF prior to the onset of unfolding, with the inhibition by the latter denaturant being a consequence of its ionic strength. With the exception of demetallated LF (apoLF) in urea, unfolding, as monitored by tryptophan fluorescence spectroscopy, was found to follow a two-state (native to unfolded) mechanism. Analysis of the metal status of LF with 4-(2-pyridylazoresorcinol) (PAR) following urea or GdnHCl exposure suggests the enzyme to be capable of maintaining its metal ion passed the observed unfolding transition in a chelator-inaccessible form. Although an increase in the concentration of the denaturants eventually allowed the chelator access to the protein׳s zinc ion, such process is not correlated with the release of the metal ion. Indeed, significant dissociation of the zinc ion from LF was not observed even at 6 M urea, and only high concentrations of GdnHCl (>3 M) were capable of inducing the release of the metal ion from the protein. Hence, the current study demonstrates not only the propensity of LF to tightly bind its zinc ion beyond the spectroscopically determined unfolding transition, but also the utility of PAR as a structural probe.

Keywords: 4-(2-pyridylazo)resorcinol; CD, circular dichroism; Chemical denaturants; DPA, dipicolinic acid; EDTA, ethylenediaminetetraacetic acid; EF, edema factor; LF, anthrax lethal factor; Lethal factor; MWCO, molecular weight cut-off; PA, protective antigen; PAR, 4-(2-pyridylazo)resorcinol; Protein folding; S-pNA, lethal factor substrate; SASA, solvent-accessible surface area; SOD, superoxide dismutase; Tryptophan fluorescence; Zinc; ZnLF, zinc-containing lethal factor; cps, counts per second.


Figures

None
Graphical abstract
Fig. 1
Fig. 1
Stereoview of the spatial relationship between the active site of LF and vicinal tryptophan residues. The active site Zn2+ ion is depicted in magenta, whereas the 4α4 helix harboring the amino acid residues of the HExxH motif are shown in cyan. For the sake of clarity, the 4α7 helix containing the Zn2+-coordinating Glu735 residue has been omitted. The image was generated with Discovery Studio 3.5 (Accelrys, San Diego, CA) using coordinates deposited under the pdb entry 1J7N .
Fig. 2
Fig. 2
Tryptophan fluorescence spectra of LF in the absence and presence of 6 M GdnHCl. LF (0.5 µM) was incubated in the absence (solid line), and presence of 6 M GdnHCl (dashed line) for 24 h at room temperature prior to recording emission spectra. The excitation wavelength was set to 295 nm to allow for the selective excitation of LF׳s tryptophan residues.
Fig. 3
Fig. 3
Unfolding profiles for ZnLF, apoLF and Zn2+-supplemented apoLF in the presence of urea. Tryptophan fluorescence spectra of all LF samples (0.5 μM final concentration in Hepes buffer) were recorded at 20 °C following incubation of the protein in the absence and presence of urea at the indicated concentrations for 1 h (open circles) and 24 h (closed diamonds). The fluorescence intensity at 333 nm was obtained from each spectrum, and plotted as a function of the concentration of the denaturant. Lines denote the best fit of the data to either Eq. (1), (2). Panel A: Unfolding of ZnLF. The best fit of the data was obtained with Eq. (1) for both 1 h and 24 h samples. Panel B: Unfolding of apoLF (in the presence of 0.1 mM DPA). The best fit of the data was obtained with Eq. (2) for both 1 h and 24 h samples. Panel C: Unfolding of Zn2+-reconstituted apoLF. ApoLF (2 μM) was reconstituted with Zn2+ (5 μM) for 1 h before dilution (1:4) of the sample with Hepes buffer containing the desired amount of urea. The best fit of the data was obtained with Eq. (1) for both 1 h and 24 h samples. Panel D: Replot of the best fits for the 24 h samples (at equilibrium) of ZnLF (solid line), apoLF (dotted line), and Zn2+-reconstituted apoLF (dashed line).
Fig. 4
Fig. 4
Unfolding profiles for ZnLF (A) and apoLF (B) in the presence of GdnHCl. Fluorescence spectra of ZnLF and apoLF (each 0.5 μM) were recorded at 20 °C following incubation of the protein with GdnHCl for 1 h (open circles) and 24 h (closed diamonds), and the fluorescence intensities (at 333 nm) were plotted as a function of the concentration of the denaturant. Lines denote the best fit of the data to Eq. (1).
Fig. 5
Fig. 5
Influence of denaturants on the dissociation of Zn2+ from LF. LF (5 μM) in Hepes buffer (50 mM, pH 7.4) was incubated in the absence and presence of GdnHCl or urea at the concentrations indicated in the figure for 1 h (blue diamonds for GdnHCl) and 24 h (red squares for GdnHCl; black circles for urea) at room temperature prior to recovery of released Zn2+ by Amicon filtration. The concentration of Zn2+ in the filtrate was quantified spectrophotometrically (at 500 nm) with the aid of PAR. Values shown are based on the release of all LF-bound Zn2+ ions (i.e., 5 μM) taken as 100%, and depict the mean (±1 s.d.) of three independent experiments. The dotted lines depict the concentrations of GdnHCl at which the midpoints of Zn2+ release (50% value) were achieved.
Fig. 6
Fig. 6
Effect of denaturants on the accessibility of Zn2+ to chelation by PAR. LF (5 μM) in Hepes buffer (50 mM, pH 7.4) was exposed to GdnHCl (panel A) or urea (panel B) at the concentrations indicated in the figure for 1 h and 24 h at room temperature prior to the addition of PAR (50 μM final concentration). The progress of the reaction of Zn2+ with the chelator was followed spectrophotometrically at 500 nm for 60 min. Full complexation of LF׳s Zn2+ ion (i.e., 5 μM given the zinc content of 1.0 Zn2+ per LF molecule) denotes an accessibility of 100%. Values shown represent the mean (±1 s.d.) of three independent experiments. The dotted lines represent the concentrations of denaturants at which the midpoints of Zn2+ accessibility (50% value) were reached. Panel A: LF was exposed to GdnHCl for 1 h prior to the addition of PAR. The immediate degree of chelation (directly following the addition of PAR; t=0) is shown as blue diamonds, whereas that after 60 min of exposure to PAR is depicted as open circles. The Zn2+ accessibility of LF exposed to GdnHCl for 24 h before the addition of PAR is shown as red squares. The trace corresponding to the reaction with the chelator for 1 h is shown only since it is identical to that recorded immediately after the addition of PAR. The degree of Zn2+ chelation following incubation of LF in the presence of 2.0 M GdnHCl for 2 h is depicted as an open and a closed triangle for the t=0 and t=60 min exposure times (to PAR), respectively. Panel B: LF was exposed to urea for 1 h prior to the addition of PAR. The immediate degree of chelation (directly following the addition of PAR; t=0) is shown as blue diamonds, whereas that after 60 min of exposure to PAR is depicted as open circles. The Zn2+ accessibility of LF exposed to urea for 24 h before the addition of PAR is shown as red squares.

Similar articles

Cited by

References

    1. Mock M., Fouet A. Anthrax. Annu. Rev. Microbiol. 2001;55:647–671. - PubMed
    1. Collier R.J., Young J.A. Anthrax toxin. Annu. Rev. Cell Dev. Biol. 2003;19:45–70. - PubMed
    1. Young J.A., Collier R.J. Anthrax toxin: receptor binding, internalization, pore formation, and translocation. Annu. Rev. Biochem. 2007;76:243–265. - PubMed
    1. Petosa C., Collier R.J., Klimpel K.R., Leppla S.H., Liddington R.C. Crystal structure of the anthrax toxin protective antigen. Nature. 1997;385:833–838. - PubMed
    1. Thoren K.L., Krantz B.A. The unfolding story of anthrax toxin translocation. Mol. Microbiol. 2011;80:588–595. - PMC - PubMed

LinkOut - more resources