. 2018 May;75(9):1657-1670.
doi: 10.1007/s00018-017-2704-9. Epub 2017 Nov 9.

Gain of function of TMEM16E/ANO5 scrambling activity caused by a mutation associated with gnathodiaphyseal dysplasia

Affiliations

Gain of function of TMEM16E/ANO5 scrambling activity caused by a mutation associated with gnathodiaphyseal dysplasia

Eleonora Di Zanni et al. Cell Mol Life Sci. 2018 May.

Abstract

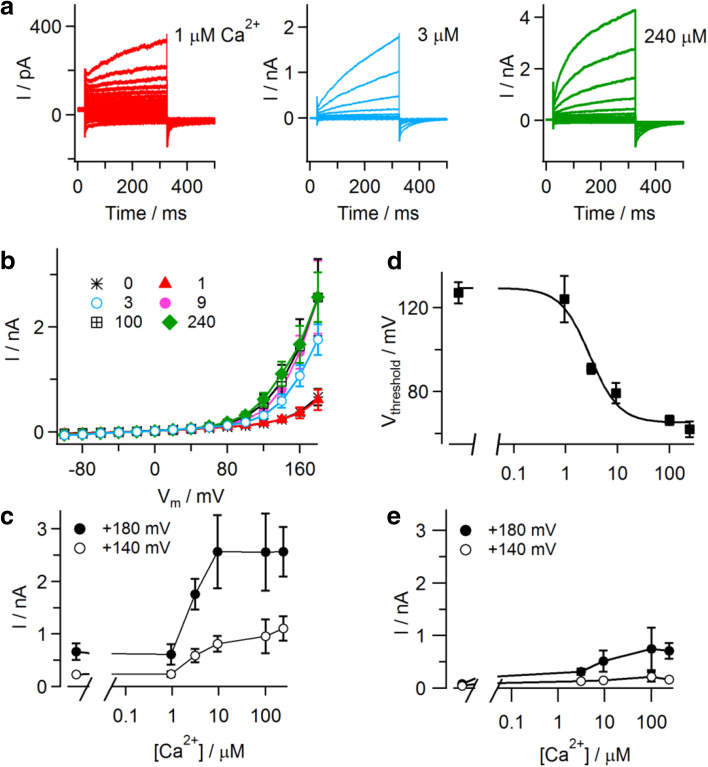
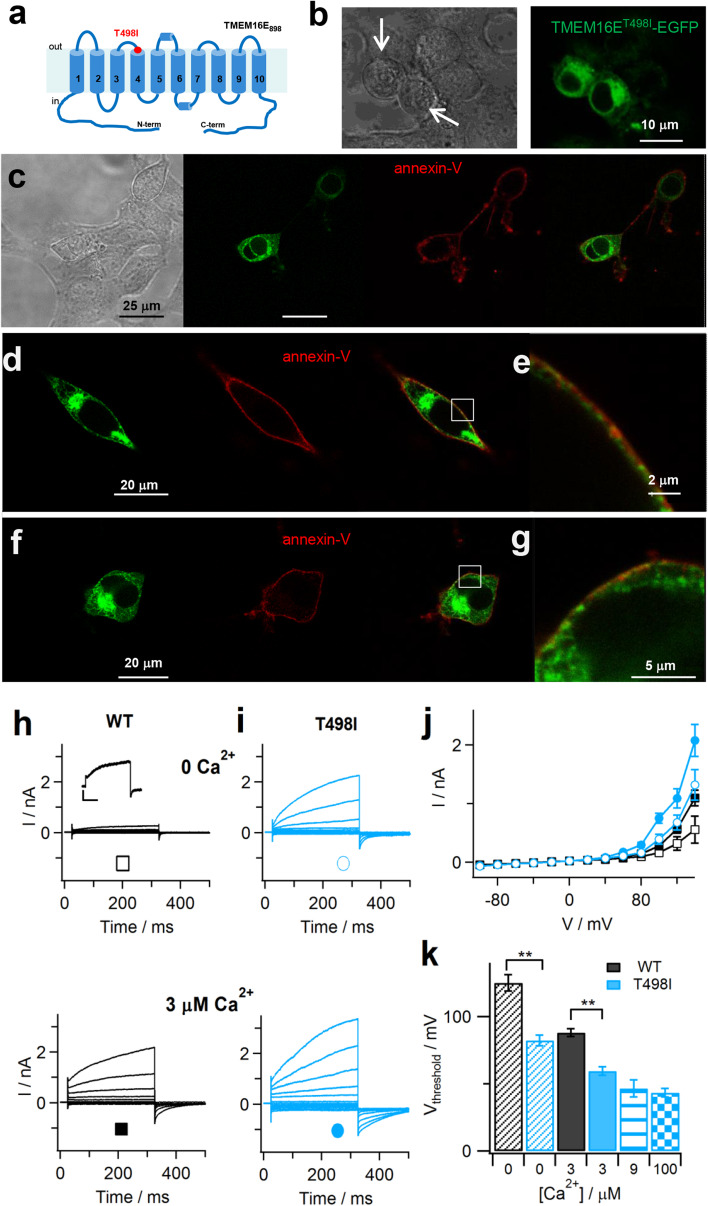
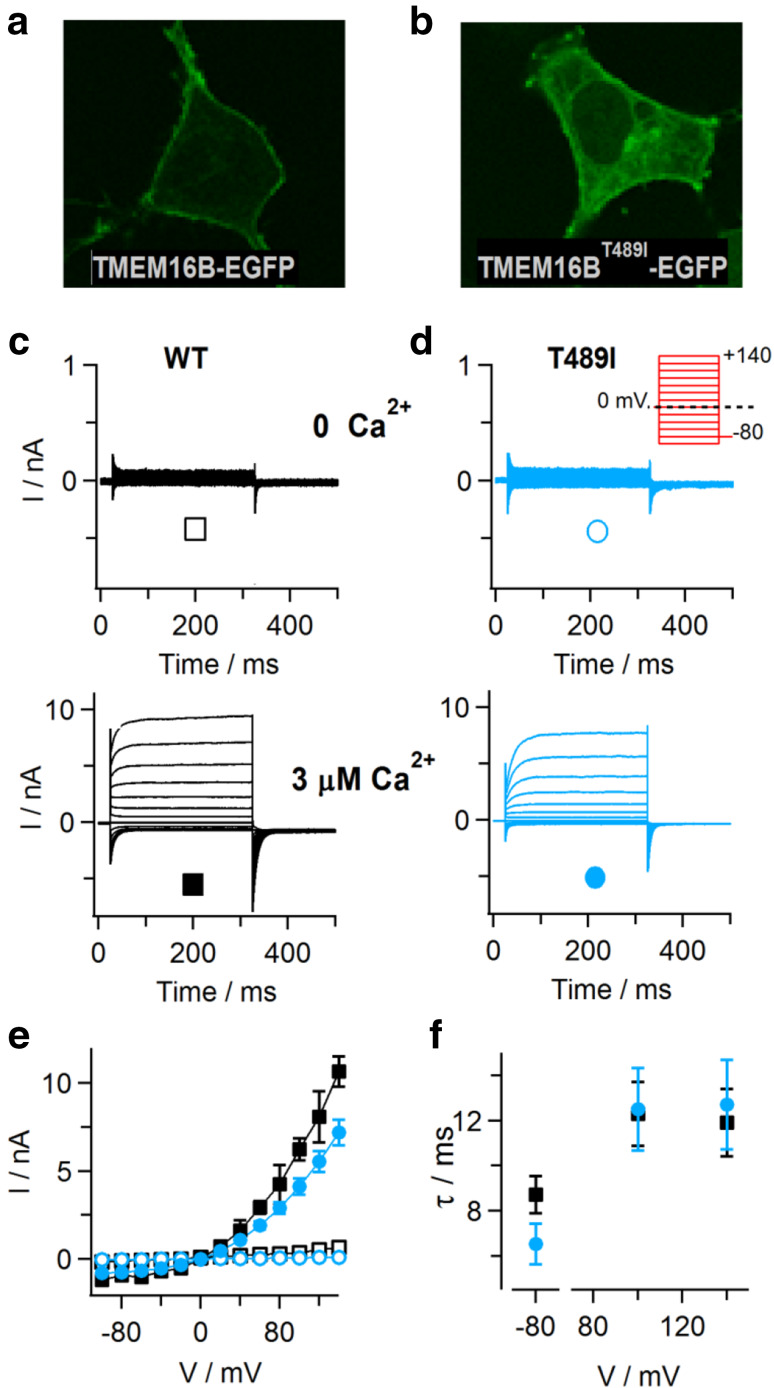
Mutations in the human TMEM16E (ANO5) gene are associated both with the bone disease gnathodiaphyseal dysplasia (GDD; OMIM: 166260) and muscle dystrophies (OMIM: 611307, 613319). However, the physiological function of TMEM16E has remained unclear. We show here that human TMEM16E, when overexpressed in mammalian cell lines, displayed partial plasma membrane localization and gave rise to phospholipid scrambling (PLS) as well as non-selective ionic currents with slow time-dependent activation at highly depolarized membrane potentials. While the activity of wild-type TMEM16E depended on elevated cytosolic Ca2+ levels, a mutant form carrying the GDD-causing T513I substitution showed PLS and large time-dependent ion currents even at low cytosolic Ca2+ concentrations. Contrarily, mutation of the homologous position in the Ca2+-activated Cl- channel TMEM16B paralog hardly affected its function. In summary, these data provide the first direct demonstration of Ca2+-dependent PLS activity for TMEM16E and suggest a gain-of-function phenotype related to a GDD mutation.

Keywords: Anoctamin5; Anoctamins; Calcium-activated chloride channels; Phosphatidylserine; Phospholipid scramblase; TMEM16E.


Conflict of interest statement

None of the authors have any competing interests.

Figures

Fig. 1
Fig. 1
Localization of TMEM16E-EGFP fusion proteins. a, b Confocal images of HEK293 cells transfected with the TMEM16E898-EGFP (a) or TMEM16E913-EGFP (b) fusion constructs and co-stained with the ER marker CellLight ER-RFP. Left, green channel (EGFP); middle, red channel (ER-RFP); right, merge. c–f Co-staining of HEK293 cells expressing TMEM16E898-EGFP (c, d) or TMEM16E913-EGFP (e, f) with the PM marker FM4-64. From left to right: in transmission light, in the green channel (EGFP), in the red channel (FM4-64), merge of green and red channels. d, f Close-up views of the squared regions indicated in c, e
Fig. 2
Fig. 2
Ion transport activity of TMEM16E proteins. a–f Whole-cell patch-clamp recordings with standard intracellular solution containing 3 µM calculated free Ca2+, in HEK293 cells transfected with TMEM16E898-EGFP (a), TMEM16E898 (b), TMEM16E913-EGFP (c) and in a non-transfected HEK293 cell (d); in a CHO cell transfected with TMEM16E898-EGFP (e) and a non-transfected CHO cell (f). The stimulation protocol (inset in d) consisted of 300-ms voltage steps ranging from − 100 to + 180 mV with 20-mV increments, followed by a 175-ms tail pulse to − 80 mV. Holding potential at 0 mV. g Average I–V relationships in HEK293 and CHO cells, non-transfected and transfected with TMEM16E-EGFP constructs. Symbols as indicated in af, n given in brackets. h Average relaxation time constants (τ) of membrane currents are plotted versus the applied membrane potential. Colors as indicated in ac, e, n given in brackets. i Average threshold potentials (V threshold) of TMEM16E current activation, for TMEM16E898-EGFP in CHO (n = 8; gray bar) and TMEM16E898-EGFP (n = 31; black bar), TMEM16E898 (n = 7; green bar), TMEM16E913-EGFP (n = 18; blue bar) in HEK293. Inset: current traces illustrating the first membrane potential at which time-dependent currents were observed, defined as V threshold. Error bars indicate sem in all panels
Fig. 3
Fig. 3
Ionic selectivity of TMEM16E-mediated currents. a Whole-cell patch-clamp recordings in a HEK293 cell transfected with TMEM16E898-EGFP, successively exposed to standard bath solution (140 NaCl), NMDG-Cl and Na-gluconate solution, as indicated. Stimulation protocol as in the inset of Fig. 2d. b Tail current recordings in a HEK293 cell transfected with TMEM16E898-EGFP, successively exposed to standard bath solution (140 mM NaCl; left traces) and bath solution containing 10 mM NaCl (right traces). The stimulation protocol (inset) consisted of a prepulse to + 140 mV followed by voltage steps between − 50 and + 50 mV with 10-mV increments. For clarity, only current traces in 20-mV steps are shown. c I–V relationships of the tail current recordings shown in b. d Current amplitudes at the +140 mV prepulse in 140 mM NaCl and 10 mM NaCl bath solution, for individual cells (n = 11) and average (red symbols; paired t test, P = 7.9 × 10−4). e Tail current recordings as in b, but in a HEK293 cell transfected with TMEM16B-EGFP and using a stimulation protocol (inset) with voltage steps between − 40 and + 80 mV with 10-mV increments. f I–V relationships of the tail current recordings shown in e. g Average reversal potentials (V rev) of tail current recordings in 140 mM NaCl (dark gray bars) and 10 mM NaCl bath solution (light gray bars), for TMEM16B-EGFP (n = 6; paired t test, **P = 2 × 10−7) and TMEM16E898-EGFP (n = 8; paired t test, P = 0.14, ns not significant). Error bars indicate sem in all panels
Fig. 4
Fig. 4
Calcium dependence of TMEM16E-mediated ionic currents. a Whole-cell patch-clamp recordings in CHO cells transfected with TMEM16E898-EGFP, in the presence of 1 µM (left), 3 µM (middle) and 240 µM (right) calculated free Ca2+ in the intracellular solution. Note the different current amplitude scales. Stimulation protocol as in the inset of Fig. 2d. b Average I–V relationships derived from current recordings at different intracellular free Ca2+ concentrations, as partly shown in a. c Ca2+ dependence of current amplitudes recorded at + 140 and + 180 mV (data from b). d Threshold potentials (V threshold) of TMEM16E current activation are plotted as a function of the intracellular free Ca2+ concentration (n = 7 for zero Ca2+, 9, 100, 240 µM; n = 5 for 1 µM; n = 10 for 3 µM). Data points were fitted with a Hill function (continuous line) yielding a half-maximal concentration of 2.9 µM Ca2+ and a Hill coefficient of 1.5. e Average current amplitudes recorded at different intracellular free Ca2+ concentrations in non-transfected CHO cells. Error bars indicate sem in all panels
Fig. 5
Fig. 5
Phospholipid scrambling activity of TMEM16E. a–c Confocal images of live HEK293 cells transfected with TMEM16F-EGFP (a) or TMEM16E898-EGFP (b, c) and treated with the Ca2+ ionophore A23187 (5 µM) for 4 min, in the presence of 5 mM extracellular Ca2+ and Cy3-conjugated annexin-V. From left to right, transmission light, green channel (EGFP), red channel (Cy3). In c, Cy3 fluorescence before and after A23187 treatment. d–g Activation of PLS activity in whole-cell patch-clamp recordings. In HEK293 cells expressing TMEM16E898-EGFP (d), membrane currents were elicited immediately after reaching the whole-cell configuration, applying voltage steps from − 100 to + 140 mV in 20-mV increments, from a holding potential of 0 mV (e). Fluorescence images (f) were recorded at the indicated whole-cell time points, with 3 μM free Ca2+ in the patch pipette and Alexa Fluor 555-conjugated annexin-V in the bath solution. g Average normalized fluorescence intensity change (∆F norm) of recordings shown in f, after background fluorescence subtraction, for TMEM16E898-EGFP expressing cells (n = 10; filled circles) and non-transfected control cells (n = 4; open circles). Error bars indicate sem
Fig. 6
Fig. 6
TMEM16E gain-of-function caused by the GDD-related T513I substitution. a Putative TMEM16E membrane topology, based on nhTMEM16 and mTMEM16A protein structures [6, 25]. The position of the T513I amino acid exchange, corresponding to T498I in TMEM16E898, is indicated. b Confocal images of HEK293 cells transfected with TMEM16E898T498I-EGFP showing impaired cell adhesion and round shape (arrows). Left, transmission light; right, green channel (EGFP). c–g Cy3-conjugated annexin-V binding to HEK293 cells transfected with TMEM16E898T498I-EGFP in the absence of Ca2+ ionophore. Live cell sample in c, fixed samples in d, f. From left to right: in transmission light, in the green channel (EGFP), in the red channel (Cy3), merge of green and red channels. e, g Close-up views of the squared regions indicated in d, f. h, i Whole-cell patch-clamp recordings in HEK293 cells expressing WT (h) or T498I mutant (i) TMEM16E898-EGFP, with intracellular solutions containing zero Ca2+ (upper traces) or 3 µM free Ca2+ (lower traces). The stimulation protocol consisted in 300-ms voltage steps ranging from − 100 to + 140 mV with 20-mV increments, followed by a 175-ms tail pulse to − 80 mV. Inset in h: current traces showing time-dependent currents at + 140 mV. Scale bars, 100 pA/100 ms. j Average I–V relationships derived from recordings as shown in h, i, for WT (n = 18 at zero Ca2+; n = 35 at 3 µM) and T498I mutant protein (n = 11 at zero Ca2+; n = 17 at 3 µM). k Threshold potentials (V threshold) of TMEM16E current activation at zero Ca2+ (n = 19 WT, n = 11 T498I), 3 µM (n = 31 WT, n = 12 T498I), 9 µM (n = 9 T498I) and 100 µM free Ca2+ (n = 12 T498I). Mann–Whitney U test, **P = 2 × 10−5 at zero Ca2+ and 3 × 10−7 at 3 µM Ca2+. Error bars indicate sem in all panels
Fig. 7
Fig. 7
Expression of TMEM16B carrying the GDD-related T489I substitution. a, b Confocal images of HEK293 cells transiently expressing TMEM16B-EGFP (a) and TMEM16BT489I-EGFP (b). c, d Whole-cell patch-clamp recordings with standard intracellular solution containing zero Ca2+ (upper traces) or 3 µM free Ca2+ (lower traces), in HEK293 cells expressing TMEM16B-EGFP (c) and TMEM16BT489I-EGFP (d). Inset in d, stimulation protocol. e Average steady-state I–V relationships of recordings as shown in c, d, for WT (n = 6 in each condition) and T489I mutant protein (n = 7 at zero Ca2+, n = 19 at 3 µM Ca2+). f Relaxation time constants (τ) of currents recorded at 3 µM free Ca2+ are plotted versus the applied membrane potential, for WT (n = 6) and T489I mutant protein (n = 16). Symbols in e, f as indicated in c, d. Error bars indicate sem in all panels

References

    1. Akasaka Y, Nakajima T, Koyama K, Furuya K, Mitsuka Y. Familial cases of a new systemic bone disease, hereditary gnatho-diaphyseal sclerosis. Nihon Seikeigeka Gakkai Zasshi. 1969;43:381–394. - PubMed
    1. Andreeva TV, Tyazhelova TV, Rykalina VN, Gusev FE, Goltsov AY, Zolotareva OI, Aliseichik MP, Borodina TA, Grigorenko AP, Reshetov DA, et al. Whole exome sequencing links dental tumor to an autosomal-dominant mutation in ANO5 gene associated with gnathodiaphyseal dysplasia and muscle dystrophies. Sci Rep. 2016;6:26440. doi: 10.1038/srep26440. - DOI - PMC - PubMed
    1. Arosio D, Ricci F, Marchetti L, Gualdani R, Albertazzi L, Beltram F. Simultaneous intracellular chloride and pH measurements using a GFP-based sensor. Nat Methods. 2010;7:516–518. doi: 10.1038/nmeth.1471. - DOI - PubMed
    1. Betto G, Cherian OL, Pifferi S, Cenedese V, Boccaccio A, Menini A. Interactions between permeation and gating in the TMEM16B/anoctamin2 calcium-activated chloride channel. J Gen Physiol. 2014;143:703–718. doi: 10.1085/jgp.201411182. - DOI - PMC - PubMed
    1. Bolduc V, Marlow G, Boycott KM, Saleki K, Inoue H, Kroon J, Itakura M, Robitaille Y, Parent L, Baas F, et al. Recessive mutations in the putative calcium-activated chloride channel Anoctamin 5 cause proximal LGMD2L and distal MMD3 muscular dystrophies. Am J Hum Genet. 2010;86:213–221. doi: 10.1016/j.ajhg.2009.12.013. - DOI - PMC - PubMed

Publication types

Supplementary concepts