

Perifoveal interdigitation zone loss in hydroxychloroquine toxicity leads to subclinical bull's eye lesion appearance on near-infrared reflectance imaging
- PMID: 29124422
- PMCID: PMC5811575
- DOI: 10.1007/s10633-017-9615-9
Perifoveal interdigitation zone loss in hydroxychloroquine toxicity leads to subclinical bull's eye lesion appearance on near-infrared reflectance imaging
Abstract
Purpose: To characterize the ultrastructural and functional correlates of hydroxychloroquine (HCQ)-induced subclinical bull's eye lesion seen on near-infrared reflectance (NIR) imaging.
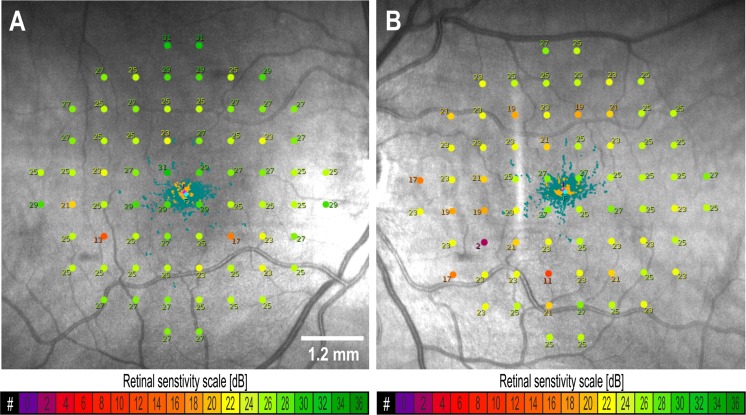
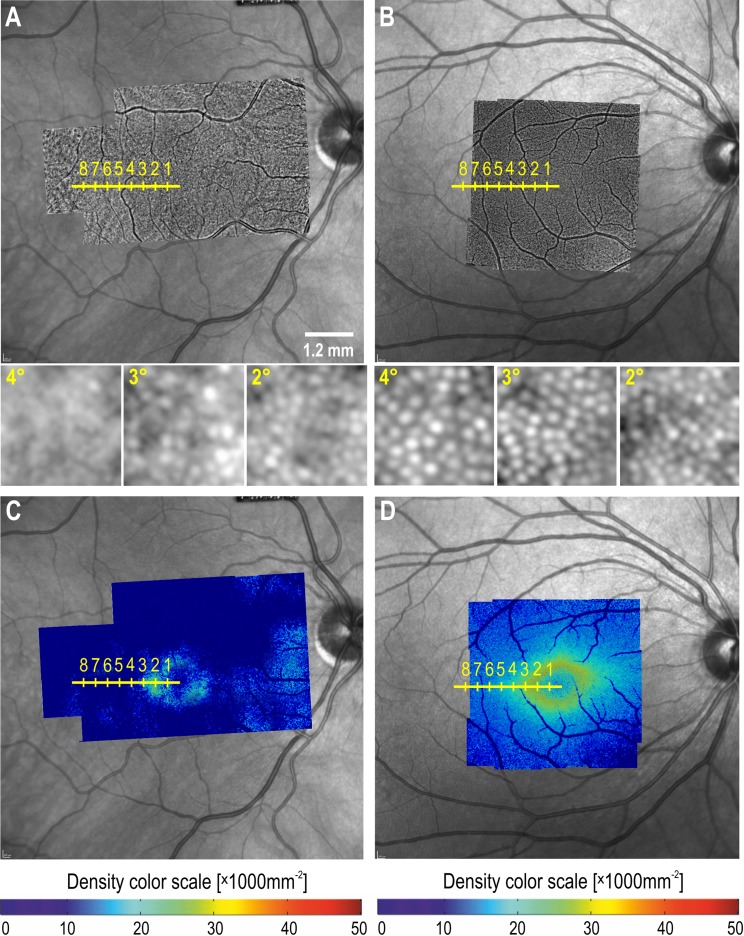
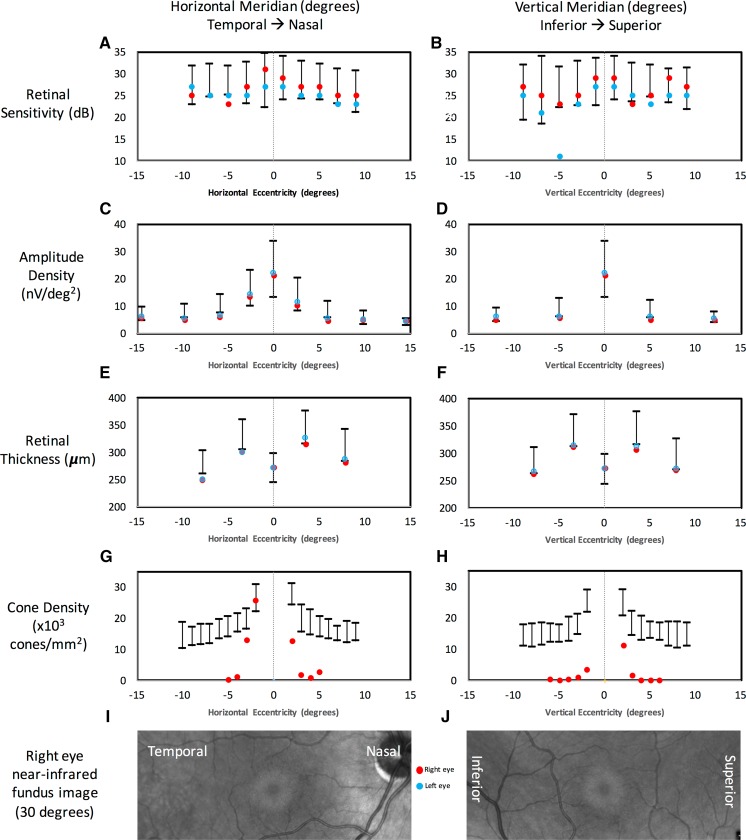
Methods: An asymptomatic 54-year-old male taking HCQ presented with paracentral ring-like scotoma, abnormal multifocal electroretinography (mfERG) and preserved ellipsoid zone on optical coherence tomography (OCT). Dense raster OCT was performed to create en face reflectivity maps of the interdigitation zone. Macular Integrity Assessment (MAIA) microperimetry and mfERG findings were compared with NIR imaging, en face OCT, retinal thickness profiles and wave-guiding cone density maps derived from flood-illumination adaptive optics (AO) retinal photography.
Results: The bull's eye lesion is an oval annular zone of increased reflectivity on NIR with an outer diameter of 1450 µm. This region corresponds exactly to an area of preserved interdigitation zone reflectivity in en face OCT images and of normal cone density on AO imaging. Immediately surrounding the bull's eye lesion is an annular zone (3°-12° eccentricity) of depressed retinal sensitivity on MAIA and reduced amplitude density on mfERG. Wave-guiding cone density at 2° temporal was 25,400 per mm2. This declined rapidly to 12,900 and 1200 per mm2 at 3° and 4°.
Conclusion: Multimodal imaging illustrated pathology in the area surrounding the NIR bull's eye, characterized by reduced reflectance, wave-guiding cone density and retinal function. Further studies are required to investigate whether the bull's eye on NIR imaging and en face OCT is prominent or consistent enough for diagnostic use.
Keywords: Adaptive optics; Bull’s eye maculopathy; En face optical coherence tomography; Fundus autofluorescence; Microperimetry; Multifocal electroretinography.
Conflict of interest statement
Conflicts of interest
All authors certify that they have no affiliations with or involvement in any organization or entity with any financial interest (such as honoraria; educational grants; participation in speakers’ bureaus; membership, employment, consultancies, stock ownership, or other equity interest; and expert testimony or patent-licensing arrangements), or non-financial interest (such as personal or professional relationships, affiliations, knowledge or beliefs) in the subject matter or materials discussed in this manuscript.
Ethical approval
All procedures performed in studies involving human participants were in accordance with the ethical standards of the institutional and/or national research committee and with the 1964 Helsinki Declaration and its later amendments or comparable ethical standards.
Informed consent
Informed consent was obtained from all individual participants included in the study.
Statement of human rights
All procedures performed in studies involving human participants were in accordance with the ethical standards of the institutional research committee (Sir Charles Gairdner Hospital Human Research Ethics Committee) and with the 1964 Helsinki declaration and its later amendments or comparable ethical standards.
Statement on the welfare of animals
This article does not contain any studies with animals performed by any of the authors.
Figures


References
-
- Hood DC, Bach M, Brigell M, Keating D, Kondo M, Lyons JS, Marmor MF, McCulloch DL, Palmowski-Wolfe AM. International society for clinical electrophysiology of vision. ISCEV standard for clinical multifocal electroretinography (mfERG) (2011 edition) Doc Ophthalmol. 2012;124:1–13. doi: 10.1007/s10633-011-9296-8. - DOI - PMC - PubMed
-
- Crawford JR, Howell DC. Comparing an individual’s test score against norms derived from small samples. Clin Neuropsychol. 1998;12:482–486. doi: 10.1076/clin.12.4.482.7241. - DOI
Publication types
MeSH terms
Substances
Grants and funding
LinkOut - more resources
Full Text Sources
Other Literature Sources
Medical
Research Materials
Miscellaneous
