. 2018 Jan;93(1):181-192.
doi: 10.1111/tpj.13767. Epub 2017 Dec 2.

Validation of an updated Associative Transcriptomics platform for the polyploid crop species Brassica napus by dissection of the genetic architecture of erucic acid and tocopherol isoform variation in seeds

Affiliations

Validation of an updated Associative Transcriptomics platform for the polyploid crop species Brassica napus by dissection of the genetic architecture of erucic acid and tocopherol isoform variation in seeds

Lenka Havlickova et al. Plant J. 2018 Jan.

Abstract

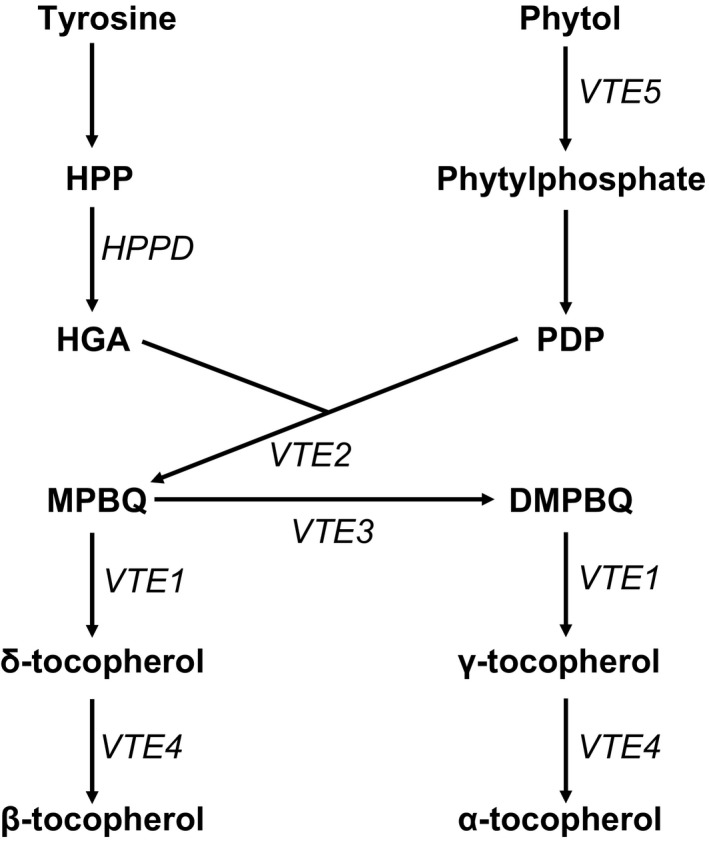
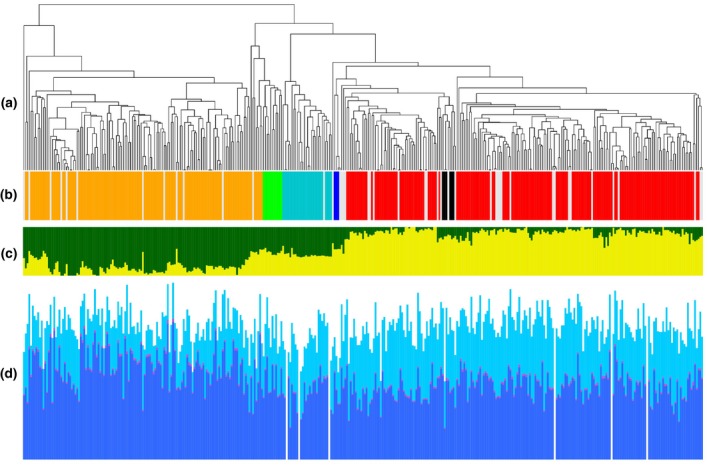
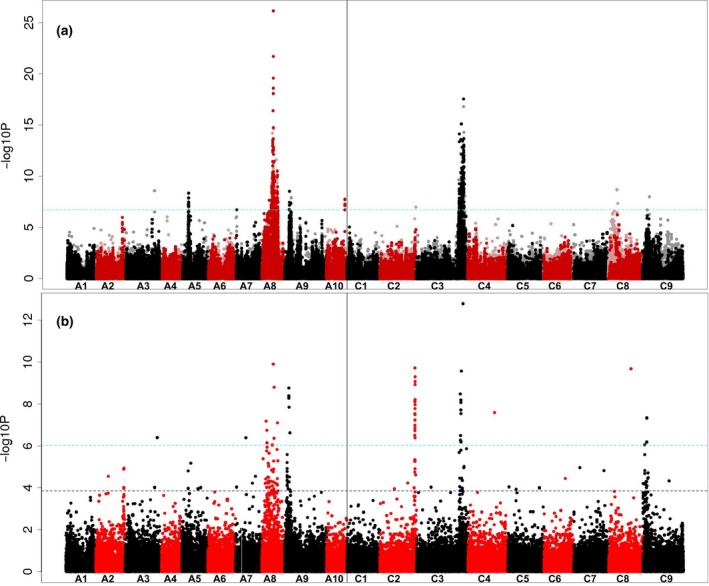
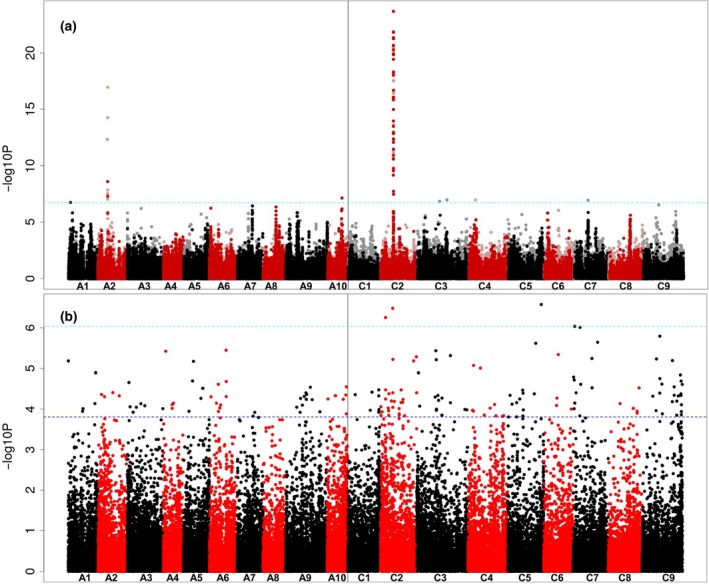
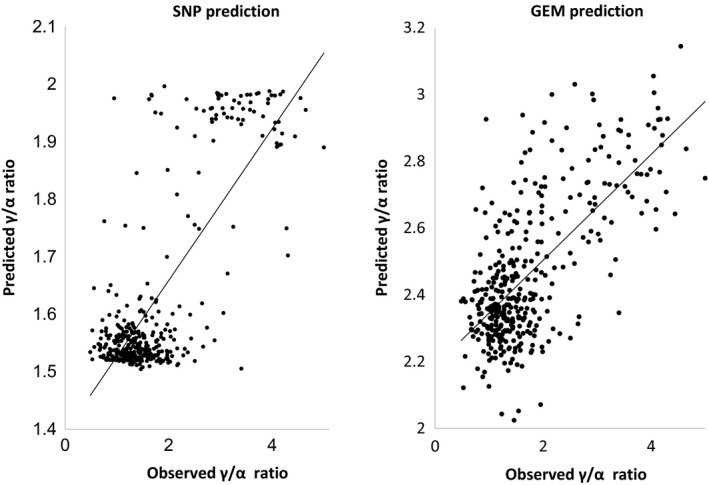
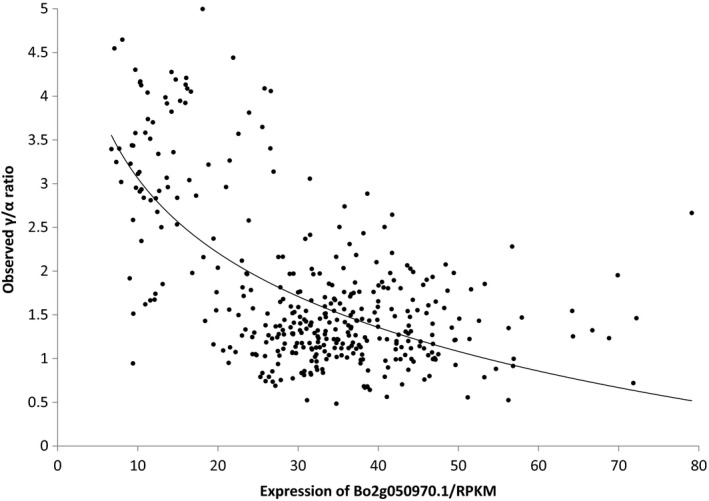
An updated platform was developed to underpin association genetics studies in the polyploid crop species Brassica napus (oilseed rape). Based on 1.92 × 10¹² bases of leaf mRNAseq data, functional genotypes, comprising 355 536 single-nucleotide polymorphism markers and transcript abundance were scored across a genetic diversity panel of 383 accessions using a transcriptome reference comprising 116 098 ordered coding DNA sequence (CDS) gene models. The use of the platform for Associative Transcriptomics was first tested by analysing the genetic architecture of variation in seed erucic acid content, as high-erucic rapeseed oil is highly valued for a variety of applications in industry. Known loci were identified, along with a previously undetected minor-effect locus. The platform was then used to analyse variation for the relative proportions of tocopherol (vitamin E) forms in seeds, and the validity of the most significant markers was assessed using a take-one-out approach. Furthermore, the analysis implicated expression variation of the gene Bo2g050970.1, an orthologue of VTE4 (which encodes a γ-tocopherol methyl transferase converting γ-tocopherol into α-tocopherol) associated with the observed trait variation. The establishment of the first full-scale Associative Transcriptomics platform for B. napus enables rapid progress to be made towards an understanding of the genetic architecture of trait variation in this important species, and provides an exemplar for other crops.

Keywords: Brassica napus; association genetics; erucic acid; tocopherol; transcriptomics.


Figures

Figure 1
Figure 1
Simplified tocopherol biosynthesis pathway in plants. Abbreviations: DMPBQ, 2,3‐dimethyl‐5‐phytyl‐1,4‐benzoquinone; HGA, homogentisic acid; HPP, p‐hydroxyphenylpyruvate; HPPD, HPP dioxygenase; MPBQ, 2‐methyl‐6‐phytyl‐1,4‐benzoquinone; PDP, phytyl‐diphosphate; VTE1, tocopherol cyclase; VTE2, homogentisate phytyltransferase; VTE3, MPBQ methyltransferase; VTE4, γ‐tocopherol methyltransferase; VTE5, phytol kinase.
Figure 2
Figure 2
Population structure and trait variation across the Renewable Industrial Products from Rapeseed (RIPR) panel. (a) Relatedness of accessions in the panel based on 355 536 scored single‐nucleotide polymorphisms (SNPs). (b) Main crop types in the panel, colour‐coded: orange for spring oilseed rape; green for semi‐winter oilseed rape; light blue for swede; dark blue for kale; black for fodder; red for winter oilseed rape; and grey for crop type not assigned. (c) Population structure for highest likelihood k = 2. (d) Variation for seed content of α‐tocopherol (light blue), γ‐tocopherol (dark blue) and δ‐tocopherol (magenta).
Figure 3
Figure 3
Association analysis. (a) Transcriptome single‐nucleotide polymorphism (SNP) markers with seed erucic acid content. The SNP markers are positioned on the x‐axis based on the genomic order of the gene models in which the polymorphism was scored, with the significance of the trait association, as –log10P, plotted on the y‐axis. A1–A10 and C1–C9 are the chromosomes of Brassica napus, shown in alternating black and red colours to permit boundaries to be distinguished. Hemi‐SNP markers (i.e. polymorphisms involving multiple bases called at the SNP position in one allele of the polymorphism) for which the genome of the polymorphism cannot be assigned are shown as light points, whereas simple SNP markers (i.e. polymorphisms between resolved bases) and hemi‐SNPs that have been directly linkage‐mapped, both of which can be assigned to a genome, are shown as dark points. The broken light‐blue horizontal line marks the Bonferroni‐corrected significance threshold of 0.05. (b) Transcript abundance with seed erucic acid content. The gene models are positioned on the x‐axis based on their genomic order, with the significance of the trait association, as –log10P, plotted on the y‐axis. The broken dark‐blue horizontal line marks the 5% false discovery rate.
Figure 4
Figure 4
Association analysis. (a) Transcriptome single‐nucleotide polymorphism (SNP) association analysis for seed γ/α‐tocopherol ratio. The SNP markers are positioned on the x‐axis based on the genomic order of the gene models in which the polymorphism was scored, with the significance of the trait association, as –log10P, plotted on the y‐axis. A1–A10 and C1–C9 are the chromosomes of Brassica napus, shown in alternating black and red colours to permit boundaries to be distinguished. Hemi‐SNP markers (i.e. polymorphisms involving multiple bases called at the SNP position in one allele of the polymorphism) for which the genome of the polymorphism cannot be assigned are shown as light points, whereas simple SNP markers (i.e. polymorphisms between resolved bases) and hemi‐SNPs that have been directly linkage‐mapped, both of which can be assigned to a genome, are shown as dark points. The broken light‐blue horizontal line marks the Bonferroni‐corrected significance threshold of 0.05. (b) Association analysis of transcript abundance with seed γ/α‐tocopherol ratio. The gene models are positioned on the x‐axis based on their genomic order, with the significance of the trait association, as –log10P, plotted on the y‐axis. The broken dark‐blue horizontal line marks the 5% false discovery rate.
Figure 5
Figure 5
Test of the predictive ability of single‐nucleotide polymorphisms (SNPs) and gene expression markers (GEMs) associated with γ/α‐tocopherol ratio by ‘take‐one‐out’ permutation. The allelic effects of each of 36 SNP markers associated with the γ/α‐tocopherol ratio was used to predict the γ/α‐tocopherol ratio for the missing accessions. For GEM data, reads per kilobase per million (RPKM) values for each of four GEMs were fitted to the regression line to predict the γ/α‐tocopherol ratio. The strong correlation between predicted and observed γ/α‐tocopherol ratio values (R 2 = 0.59, < 0.001 for SNPs; R 2 = 0.47, < 0.001 for GEMs) demonstrates excellent predictive ability.
Figure 6
Figure 6
Relationship between the expression of Bo2g050970.1 in leaves and the γ/α‐tocopherol ratio in seeds. The ratio of γ/α‐tocopherol measured in seeds was regressed against the transcript abundance in leaves of the VTE4 orthologue Bo2g050970.1 (R 2 = 0.26; < 0.001), measured as reads per kilobase per million aligned reads (RPKM).

References

    1. Arabidopsis Genome Initiative (2000) Analysis of the genome sequence of the flowering plant Arabidopsis thaliana. Nature, 408, 796–815. - PubMed
    1. Atwell, S. , Huang, Y.S. , Vilhjálmsson, B.J. et al. (2010) Genome‐wide association study of 107 phenotypes in a common set of Arabidopsis thaliana inbred lines. Nature, 465(7298), 627–631. - PMC - PubMed
    1. Bancroft, I. , Morgan, C. , Fraser, F. et al. (2011) Dissecting the genome of the polyploid crop oilseed rape by transcriptome sequencing. Nat. Biotechnol. 29, 762–766. - PubMed
    1. Bancroft, I. , Fraser, F. , Morgan, C. and Trick, M. (2015) Collinearity analysis of Brassica A and C genomes based on an updated inferred unigene order. Data Brief, 3, 51–55. - PMC - PubMed
    1. Bus, A. , Körber, N. , Snowdon, R.J. and Stich, B. (2011) Patterns of molecular variation in a species‐wide germplasm set of Brassica napus. Theor. Appl. Genet. 123(8), 1413–1423. - PubMed