Human Organ Tissue Identification by Targeted RNA Deep Sequencing to Aid the Investigation of Traumatic Injury
- PMID: 29125589
- PMCID: PMC5704232
- DOI: 10.3390/genes8110319
Human Organ Tissue Identification by Targeted RNA Deep Sequencing to Aid the Investigation of Traumatic Injury
Abstract
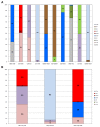
Molecular analysis of the RNA transcriptome from a putative tissue fragment should permit the assignment of its source to a specific organ, since each will exhibit a unique pattern of gene expression. Determination of the organ source of tissues from crime scenes may aid in shootings and other investigations. We have developed a prototype massively parallel sequencing (MPS) mRNA profiling assay for organ tissue identification that is designed to definitively identify 10 organ/tissue types using a targeted panel of 46 mRNA biomarkers. The identifiable organs and tissues include brain, lung, liver, heart, kidney, intestine, stomach, skeletal muscle, adipose, and trachea. The biomarkers were chosen after iterative specificity testing of numerous candidate genes in various tissue types. The assay is very specific, with little cross-reactivity with non-targeted tissue, and can detect RNA mixtures from different tissues. We also demonstrate the ability of the assay to successful identify the tissue source of origin using a single blind study.
Keywords: forensic science; human organ tissue; mRNA; massively parallel sequencing; tissue identification.
Conflict of interest statement
The authors declare no conflict of interest. The funding sponsors had no role in the design of the study; in the collection, analyses, or interpretation of data; in the writing of the manuscript, and in the decision to publish the results.
Figures


Similar articles
-
Messenger RNA biomarker signatures for forensic body fluid identification revealed by targeted RNA sequencing.Forensic Sci Int Genet. 2018 May;34:206-221. doi: 10.1016/j.fsigen.2018.02.020. Epub 2018 Mar 6. Forensic Sci Int Genet. 2018. PMID: 29549744
-
Highly specific mRNA biomarkers for the identification of vaginal secretions in sexual assault investigations.Sci Justice. 2013 Mar;53(1):14-22. doi: 10.1016/j.scijus.2012.03.007. Epub 2012 Apr 15. Sci Justice. 2013. PMID: 23380057
-
The beagle dog MicroRNA tissue atlas: identifying translatable biomarkers of organ toxicity.BMC Genomics. 2016 Aug 17;17:649. doi: 10.1186/s12864-016-2958-x. BMC Genomics. 2016. PMID: 27535741 Free PMC article.
-
Extended specificity studies of mRNA assays used to infer human organ tissues and body fluids.Electrophoresis. 2017 Dec;38(24):3155-3160. doi: 10.1002/elps.201700241. Epub 2017 Sep 20. Electrophoresis. 2017. PMID: 28862746
-
RNA Profiling for the Identification of the Tissue Origin of Dried Stains in Forensic Biology.Forensic Sci Rev. 2010 Jul;22(2):145-57. Forensic Sci Rev. 2010. PMID: 26242593 Review.
Cited by
-
Interpol review of forensic biology and forensic DNA typing 2016-2019.Forensic Sci Int Synerg. 2020 Feb 20;2:352-367. doi: 10.1016/j.fsisyn.2019.12.002. eCollection 2020. Forensic Sci Int Synerg. 2020. PMID: 33385135 Free PMC article. Review.
-
On the Identification of Body Fluids and Tissues: A Crucial Link in the Investigation and Solution of Crime.Genes (Basel). 2021 Oct 28;12(11):1728. doi: 10.3390/genes12111728. Genes (Basel). 2021. PMID: 34828334 Free PMC article. Review.
-
Potential applications of microRNA profiling to forensic investigations.RNA. 2020 Jan;26(1):1-9. doi: 10.1261/rna.072173.119. Epub 2019 Oct 28. RNA. 2020. PMID: 31658993 Free PMC article. Review.
-
Cell survival and DNA damage repair are promoted in the human blood thanatotranscriptome shortly after death.Sci Rep. 2021 Aug 16;11(1):16585. doi: 10.1038/s41598-021-96095-z. Sci Rep. 2021. PMID: 34400689 Free PMC article.
-
Next-generation RNA sequencing of spatially mapped material from human body donors for testing the impact of fetal environments on the liver transcriptome.Sci Rep. 2025 Aug 26;15(1):31353. doi: 10.1038/s41598-025-16432-4. Sci Rep. 2025. PMID: 40858696 Free PMC article.
References
-
- DiMaio V.J.M. Gunshot Wounds: Practical Aspects of Firearms, Ballistics and Forensic Techniques. CRC Press; Boca Raton, FL, USA: 2015. pp. 1–377.
-
- Prahlow J.A., Byard R.W. Atlas of Forensic Pathology. Springer; New York, NY, USA: 2012. pp. 1–85.
-
- Alberts B., Bray D., Lewis J., Raff M., Roberts K., Watson J.D. Molecular Biology of the Cell. Garland Science; New York, NY, USA: 1994. pp. 1–1352.
LinkOut - more resources
Full Text Sources
Other Literature Sources

