. 2018 Feb;12(2):531-543.
doi: 10.1038/ismej.2017.190. Epub 2017 Nov 10.

Phage mobility is a core determinant of phage-bacteria coexistence in biofilms

Affiliations

Phage mobility is a core determinant of phage-bacteria coexistence in biofilms

Emilia L Simmons et al. ISME J. 2018 Feb.

Abstract

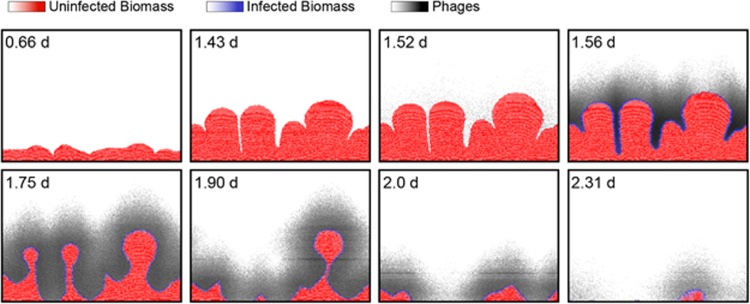
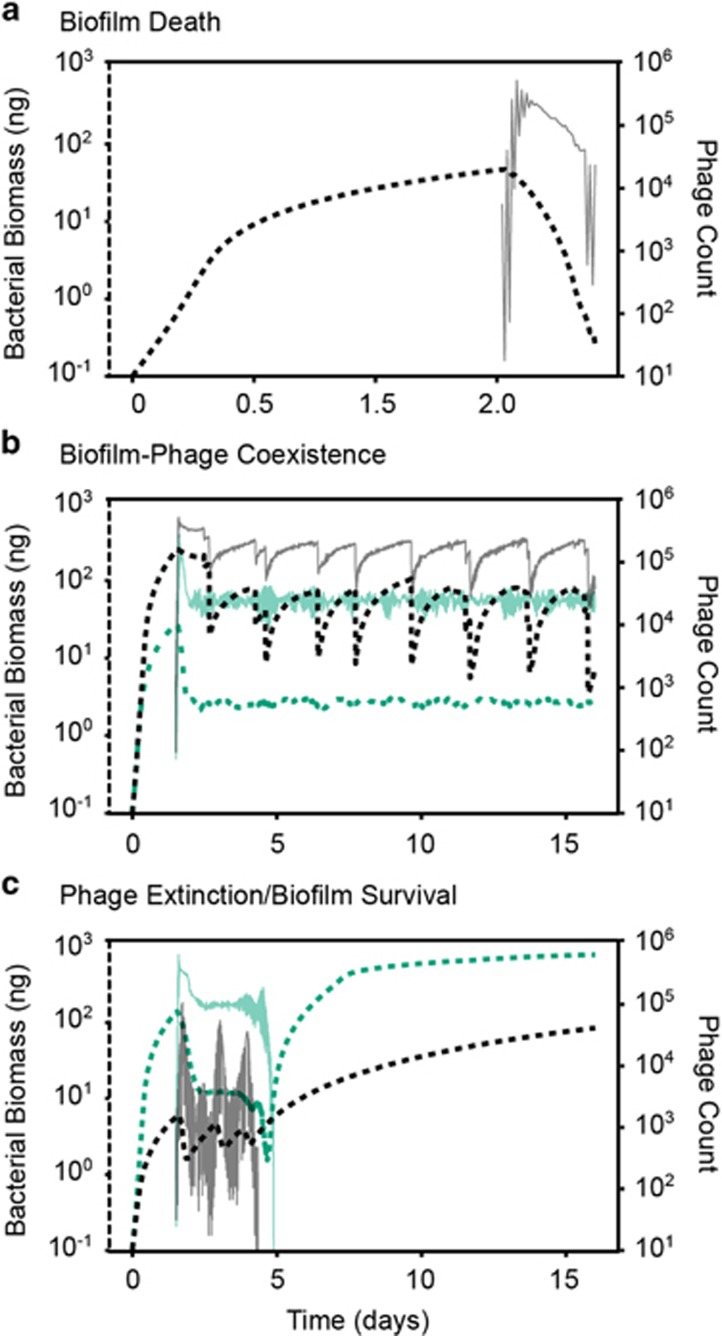
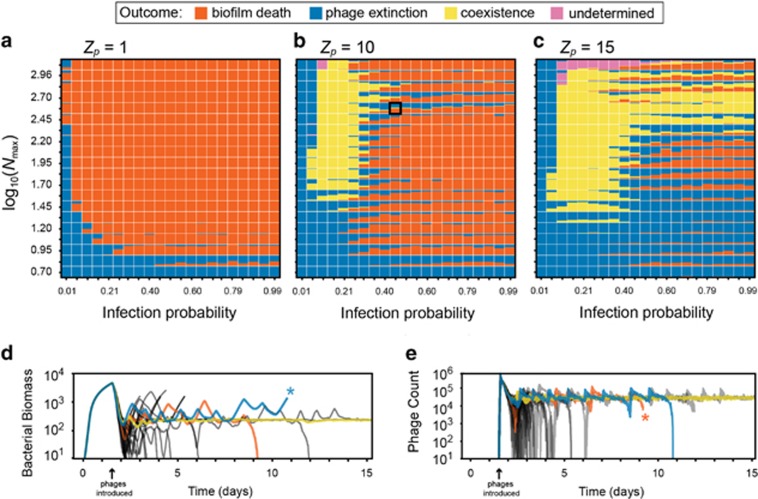
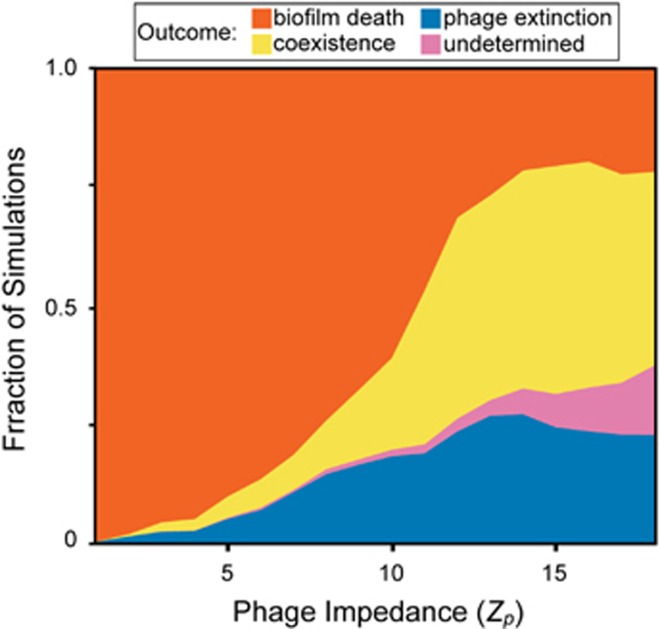
Many bacteria are adapted for attaching to surfaces and for building complex communities, termed biofilms. The biofilm mode of life is predominant in bacterial ecology. So too is the exposure of bacteria to ubiquitous viral pathogens, termed bacteriophages. Although biofilm-phage encounters are likely to be common in nature, little is known about how phages might interact with biofilm-dwelling bacteria. It is also unclear how the ecological dynamics of phages and their hosts depend on the biological and physical properties of the biofilm environment. To make headway in this area, we develop a biofilm simulation framework that captures key mechanistic features of biofilm growth and phage infection. Using these simulations, we find that the equilibrium state of interaction between biofilms and phages is governed largely by nutrient availability to biofilms, infection likelihood per host encounter and the ability of phages to diffuse through biofilm populations. Interactions between the biofilm matrix and phage particles are thus likely to be of fundamental importance, controlling the extent to which bacteria and phages can coexist in natural contexts. Our results open avenues to new questions of host-parasite coevolution and horizontal gene transfer in spatially structured biofilm contexts.


Conflict of interest statement

The authors declare no conflict of interest.

Figures

Figure 1
Figure 1
An example time-series of simulated biofilm growth and phage infection. For uninfected and infected biomass (red and blue, respectively), the color gradients are scaled to the maximum permissible biomass per grid node (see Supplementary Methods). For phages, the black color gradient is scaled to the maximum phage concentration in this run of the simulation. Any phages that diffuse away from the biofilm into the surrounding liquid are assumed to be advected out of the system in the next iteration cycle. Phages are introduced to the biofilm at 1.5 days. Phage infection proliferates along the biofilm front, causing biomass erosion and, in this example, complete eradication of the biofilm population. The simulation space is 250 μm long on its horizontal dimension.
Figure 2
Figure 2
Population dynamics of biofilm-dwelling bacteria and phages for several example cases. For each example simulation, bacterial biomass is plotted in the thick dotted line (left axis), and phage counts are plotted in the thin solid line (right axis). (a) Biofilm death: phages rapidly proliferate, and bacterial growth cannot compensate, resulting in clearance of the biofilm population (and halted phage proliferation thereafter). (b) Coexistence of bacteria and phages. We found two broad patterns of coexistence, one in which bacteria and phage populations remained at relative fixed population size (green lines), and one in which bacterial and phage populations oscillated as large biofilms clusters grew, sloughed and re-grew repeatedly over time (black lines). (c) Phage extinction and biofilm survival. In many cases, we found that phage populations extinguished while biofilms were relatively small, allowing the small population of remaining bacteria to grow unobstructed thereafter. Some of these cases involved phage population oscillations of large amplitude (black lines), while others did not (green lines).
Figure 3
Figure 3
Steady states of biofilm–phage population dynamics as a function of nutrient availability, phage infection rate and phage impedance. Each pixel square in each heatmap summarizes >30 simulation runs and shows the distribution of simulation outcomes. Phage extinction (biofilm survival) is denoted by blue, biofilm–phage coexistence is denoted by yellow and biofilm death is denoted by orange. Each map is a parameter sweep of nutrient availability (approximate biofilm growth rate) on the vertical axis, and infection probability per phage–bacterium contact event on the horizontal axis. The sweep was performed for three values of Zp, the phage impedance, where phage diffusivity within biofilm biofilms is equivalent to that in liquid for Zp=1 (a), and decreases with increasing Zp (b and c). For Zp=[10,15], there are regions of stable coexistence (pure-yellow squares) and unstable coexistence (bi-and tri-colored squares) between phages and bacteria. Traces of (d) bacterial biomass and (e) phage count are provided for one parameter combination at Zp=10 (identified with a black box in (b)) corresponding to unstable phage–bacterial coexistence. We have highlighted one example each of phage extinction (blue), biofilm death (orange) and coexistence (yellow), which in this case is likely transient. In the highlighted traces, asterisks denote that the simulations were stopped because either phages or the bacterial biomass had declined to zero. This was carried out to increase the overall speed of the parallelized simulation framework. Simulations were designated ‘undetermined’ if biofilms reached the ceiling of the simulation space before any of the other outcomes occurred (see main text).
Figure 4
Figure 4
The distribution of biofilm–phage population dynamic steady states as a function of increasing phage mobility impedance within the biofilm. Here we performed sweeps of nutrient and infection probability parameter space for values of phage impedance (Zp) ranging from 1 to 18. As the phage impedance parameter is increased, phage diffusion within the biofilm becomes slower relative to the surrounding liquid phase. The replication coverage was at least 6 runs for each combination of nutrient concentration, infection probability and phage impedance, totaling 96 000 simulations. Undetermined simulations are those in which biofilms reached the simulation height maximum before any of the other exit conditions occurred (see main text).

References

    1. Abedon S. (2017). Phage ‘delay’ toward enhancing bacterial escape from biofilms: a more comprehensive way of viewing resistance to bacteriophages. AIMS Microbiol 3: 186–226. - PMC - PubMed
    1. Abedon ST. (ed). (2008) Bacteriophage Ecology: Population Growth, Evolution, and Impact of Bacterial Viruses. Cambridge University Press: Cambridge, UK.
    1. Abedon ST. (2012). Spatial vulnerability: bacterial arrangements, microcolonies, and biofilms as responses to low rather than high phage densities. Viruses 4: 663–687. - PMC - PubMed
    1. Abedon ST. (2015). Ecology of anti-biofilm agents. II: Bacteriophage exploitation and biocontrol of biofilm bacteria. Pharmaceuticals 8: 559–589. - PMC - PubMed
    1. Ackermann M. (2015). A functional perspective on phenotypic heterogeneity in microorganisms. Nat Rev Microbiol 13: 497–508. - PubMed

Publication types