. 2018 Feb;25(2):368-379.
doi: 10.1038/cdd.2017.166. Epub 2017 Nov 10.

TM9SF4 is a novel factor promoting autophagic flux under amino acid starvation

Affiliations

TM9SF4 is a novel factor promoting autophagic flux under amino acid starvation

Lei Sun et al. Cell Death Differ. 2018 Feb.

Abstract

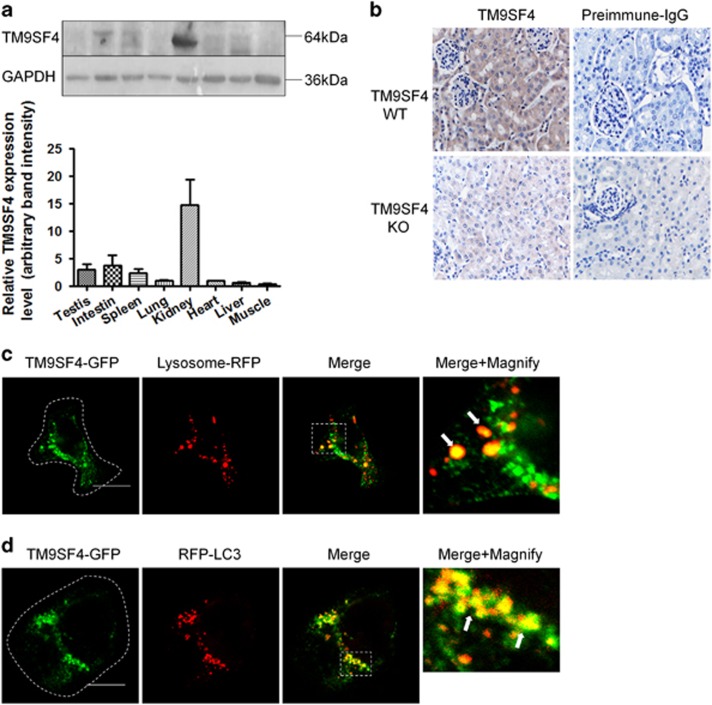
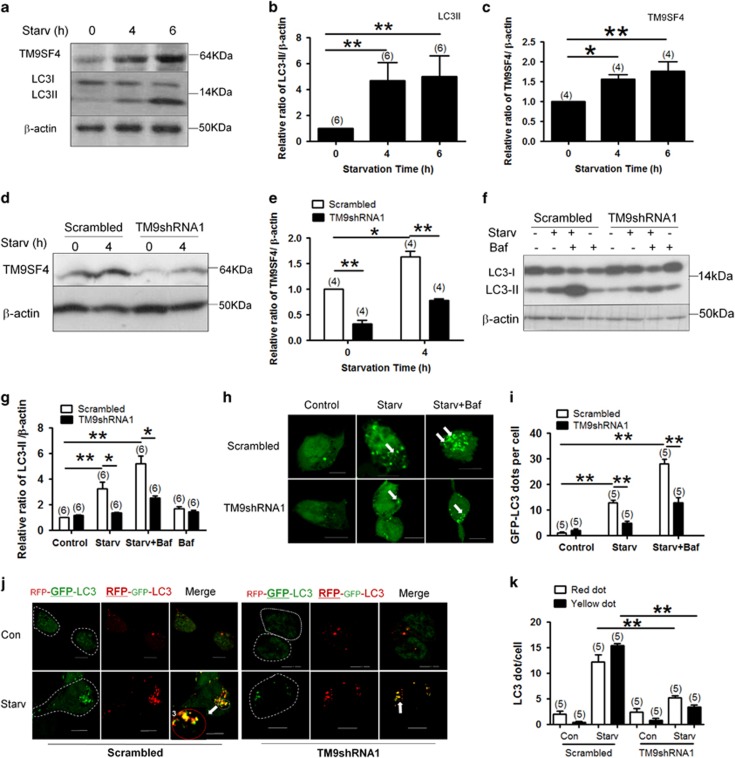
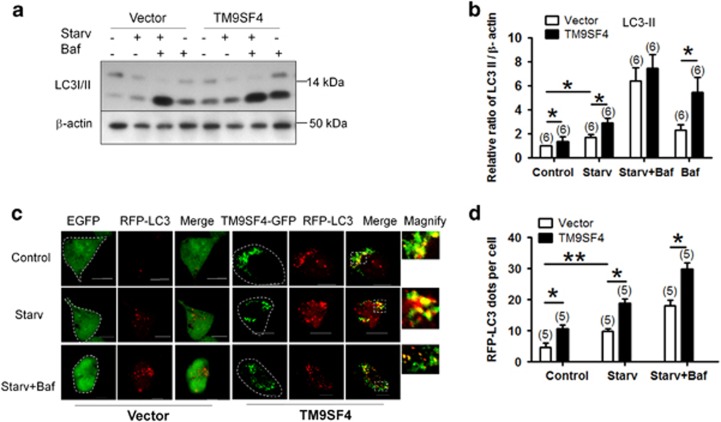
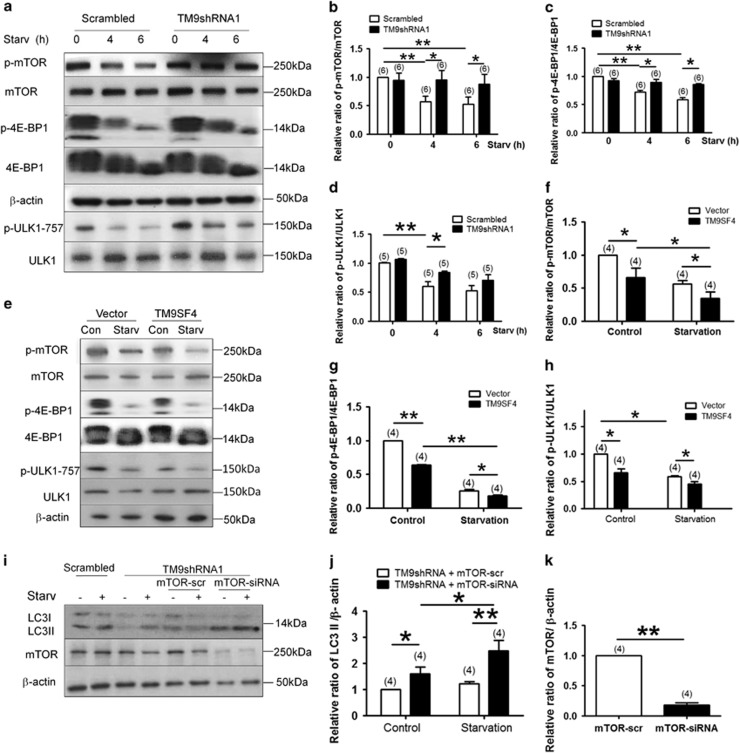
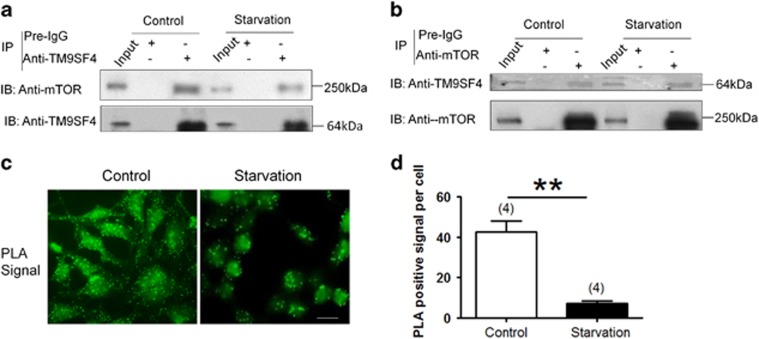
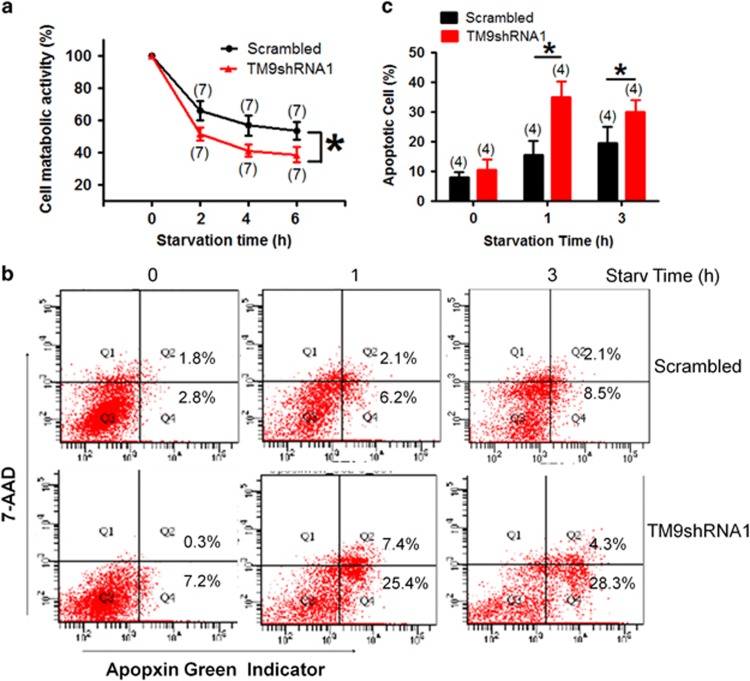
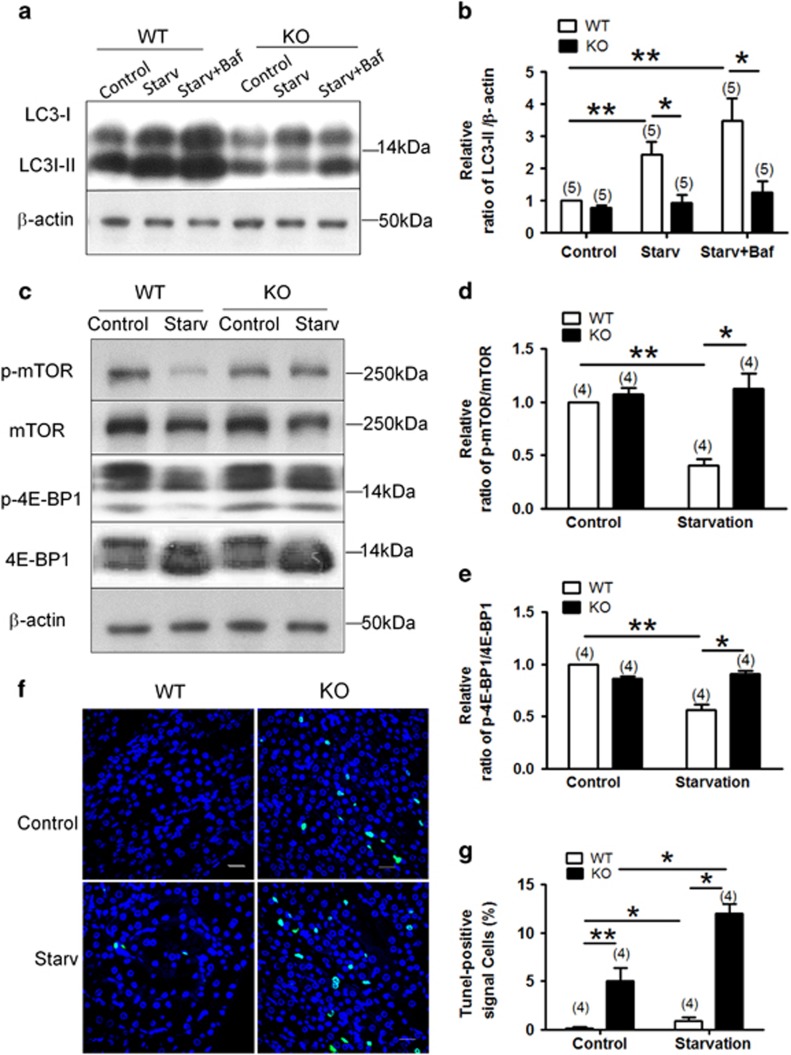
Autophagy is a highly complicated process with participation of large numbers of autophagy-related proteins. Under nutrient starvation, autophagy promotes cell survival by breaking down nonessential cellular components for recycling use. However, due to its high complexity, molecular mechanism of autophagy is still not fully understood. In the present study, we report a novel autophagy-related protein TM9SF4, which plays a functional role in the induction phase of autophagic process. TM9SF4 proteins were abundantly expressed in the kidney, especially in renal proximal tubular epithelial cells. At subcellular cells, TM9SF4 proteins were mostly localized in lysosome, Golgi, late endosome and autophagosome. Knockdown of TM9SF4 with TM9SF4-shRNAs markedly reduced the starvation-induced autophagy in HEK293 cells, the effect of which persisted in the presence of bafilomycin A1. TM9SF4-shRNAs also substantially attenuated the starvation-induced mTOR inactivation. In animal model, starvation was able to induce LC3-II accumulation and cause mTOR inactivation in renal cortical tissue in wild-type mice, the effect of which was minimal/absent in TM9SF4 knockout (TM9SF4-/-) mice. Co-immunoprecipitation and proximity ligation assay demonstrated physical interaction of TM9SF4 proteins with mTOR. In addition, knockdown or knockout of TM9SF4 reduced the starvation-induced cell death in HEK293 cells and animal model. Taken together, the present study identifies TM9SF4 as a novel autophagy-related protein. Under nutrient starvation, TM9SF4 functions to facilitate mTOR inactivation, resulting in an enhanced autophagic flux, which serves to protect cells from apoptotic cell death.


Conflict of interest statement

The authors declare no conflict of interest.

Figures

Figure 1
Figure 1
Tissue distribution and subcellular localization of TM9SF4 proteins. (a) Representative immunoblot images (top) and summary data (bottom) showing the expression of TM9SF4 proteins in mouse tissues. GAPDH was used as the house-keeping control gene. Summary data are presented as mean±S.E.M. (n=3). (b) Representative images of the renal cortex of wild-type (WT) and TM9SF4−/− (KO) mice, immunostained with preimmune IgG or anti-TM9SF4 antibody (× 400 magnifications). Brown color represents TM9SF4 signal, while blue color shows cell nuclei from hematoxylin counterstain. n=3. (c and d) Co-localization of TM9SF4 proteins with lysosomal marker lysosome-RFP (c) and autophagosome marker RFP-LC3 (d). Dashed lines in the left panels of (c and d) outline the cell boundary, which could be observed at high magnification in differential interference contrast mode. The right most panels in (c) and (d) were the magnified images of Merge. Scale bar=10 μm. Representatives from five experiments
Figure 2
Figure 2
Knockdown of TM9SF4 using lenti-TM9SF4-shRNA1 inhibited the starvation-induced autophagic flux in HEK293 cells. (ac) Amino acid starvation in EBSS for 4 and 6 h increased the expression of TM9SF4 and LC3-II in HEK293 cells. Shown are representative immunoblot images (a) and data summary (b and c). (d and e) Representative immunoblot images (d) and data summary (e) demonstrating the effectiveness of TM9SF4-shRNA1 in knocking-down TM9SF4 expression in HEK293 cells under basal and starvation conditions. Lenti-TM9SF4-shRNA1 or its scrambled control was stably transduced into HEK293. (f and g) Effect of TM9SF4-shRNA1 in reducing the LC3-II level in the presence or absence of bafilomycin A1 (Baf, 10 nM). Shown are representative immunoblot images (f) and data summary (g). (h and i) Effect of TM9SF4-shRNA1 in reducing GFP-LC3 puncta formation in the presence or absence of bafilomycin A1 (Baf, 10 nM). Shown are LC3 fluorescent signals from representative single cells (h) and data summary (i). (j and k) HEK293 cells were transfected with a tandem reporter RFP-GFP-LC3. Shown are the effect of TM9SF4-shRNA1 on the formation of autophagosome (yellow dots in merged images) and autolysosome (red dots in merged images) with representative images (j) and data summary (k). In (fk), amino acid starvation was carried out in EBSS for 2 h. In (hk), quantification of autophagosome and autolysosome were performed using ImageJ. Scale bar=10 μm. Summary data are presented as mean±S.E.M. (n as labeled in the figures; >100 cells per experiment in (i and k). *P<0.05; **P<0.01. The values in (b,c,e and g) were normalized to β-actin level
Figure 3
Figure 3
Overexpression of TM9SF4 promoted autophagic flux in HEK293 cells. (a and b) Effect of TM9SF4 overexpression on LC3-II level in the presence or absence of bafilomycin A1 (Baf, 10 nM). Shown are representative immunoblot images (a) and data summary (b). (c and d) Effect of TM9SF4 overexpression on RFP-LC3 puncta formation. Shown are LC3 fluorescent signals from representative single cells (c) and data summary (d). The right most panels in (c) were the magnified images of Merge. Scale bar=10 μm. The quantification of RFP-LC3-positive autophagosome was performed using ImageJ. Amino acid starvation was carried out in EBSS for 2 h. Summary data are presented as mean±S.E.M. (n=6 in B; n=5 and >100 cells per experiment in (d). The values in (b) were normalized to β-actin level. *P<0.05; **P<0.01
Figure 4
Figure 4
TM9SF4 inhibited mTOR activity in HEK293 cells. (a–d) Representative immunoblot images (a) and data summary (bd) showing the effect of TM9SF4-shRNA1 on the expressional levels of phospho-mTOR/mTOR, phospho-4E-BP1/4E-BP1 and phospho-ULK1-S757/ULK1. (e–h) Representative immunoblot images (e) and data summary (f–h) showing the effect of TM9SF4 overexpression on the expressional levels of phospho-mTOR/mTOR, phospho-4E-BP1/4E-BP1 and phospho-ULK1-S757/ULK1. (i and j) Representative immunoblot images (i) and data summary (j) showing that mTOR-siRNA caused LC3-II re-accumulation in lenti-TM9SF4-shRNA1-expressing cells. mTOR-siRNA could effectively knockdown the expression level of mTOR proteins (i and k). Amino acid starvation was carried out in EBSS for 4 and 6 h in (ad), 4 h in (ek). Summary data are presented as mean±S.E.M. (n as labeled in the figures). The values in summary data were normalized to total protein levels of mTOR, 4E-BP1 and β-actin, respectively. *P<0.05; **P<0.01
Figure 5
Figure 5
Physical interaction of TM9SF4 with mTOR in HEK293 cells. (a and b) Representative immunoblot images of co-immunoprecipitation experiments. The pulling antibodies (anti-TM9SF4 antibody in a and anti-mTOR antibody in b) and the blotting antibodies were indicated. Control immunoprecipitation was performed using preimmune IgG (labeled as pre-IgG). The cell lysates were displayed as input. n=5. (c and d) Representative images (c) of TM9SF4/mTOR interaction together quantification (d) of fluorescent spots using proximity ligation assay (PLA). Summary data are presented as mean ± S.E.M. (n=4 experiments). **P<0.01. Scale bar=20 μm
Figure 6
Figure 6
TM9SF4-shRNA1 aggravated the starvation-induced cell death in HEK293 cells. HEK293 cells were stably transfected with lenti-scrambled-shRNA or lenti-TM9SF4-shRNA1. Amino acid starvation was carried out in EBSS for 2−6 h in (a), or 1−3 h in (b and c). (a) Cell viability assay by MTT. The data are expressed as the percent of metabolic activity relative to non-starved cells. (b and c) Cell death assay based on Apopxin green indicator and 7-amino-actinomycin (7-AAD) using Flow Cytometry. Apopxin green(−)/7-AAD (+) cells (Q1) were considered necrotic; Apopxin green(+)/7-AAD(+) double-positive cells (Q2) were considered late apoptotic; Apopxin green(−)/7-AAD(−) cells (Q3) were considered alive; and Apopxin green(+)/7-AAD(−) cells (Q4) were considered early apoptotic. Quantitative analysis of the apoptotic (Q2+Q4) cells by fluorescence-activated cell sorting (FACS) analysis is summarized in (c). Summary data are presented as mean±S.E.M. (n=7 in a; n=4 in c). *P<0.05
Figure 7
Figure 7
TM9SF4 promoted autophagy in mouse renal tissues in vivo. (a and b) Representative immunoblots (a) and data summary (b) showing LC3-II protein level in the renal cortex of wild-type (WT) and TM9SF4−/− (KO) mice. (c–e) Representative immunoblots (c) and data summary (d and e) showing the protein levels of phospho-mTOR (d) and phosphor`E-BP1 (e) in the renal cortex of wild-type and TM9SF4−/− mice. (f and g) Representative pictures (f) and summary data (g) of TUNEL-positive cells in renal cortical tissue sections prepared from wild-type and TM9SF4−/− mice. The nuclei were stained blue with DAPI. Green signal indicate apoptotic nuclei. Animals were starved for 24 h with or without bafilomycin A1 (Baf, 25 ng/g body weight). Control had no starvation. Summary data are presented as mean±S.E.M. (n=5 in B; n=4 in (d,e and g). The values in (b) were normalized to β-actin, and those in (d and e) were normalized to total protein levels of mTOR and 4E-BP1, respectively. *P<0.05; **P<0.01. Scale bar=20 μm

Similar articles

Cited by

References

    1. Chluba-de Tapia J, de Tapia M, Jaggin V, Eberle AN. Cloning of a human multispanning membrane protein cDNA: evidence for a new protein family. Gene 1997; 197: 195–204. - PubMed
    1. Fais S, Fauvarque MO. TM9 and cannibalism: how to learn more about cancer by studying amoebae and invertebrates. Trends Mol Med 2012; 18: 4–5. - PubMed
    1. Froquet R, Cherix N, Birke R, Benghezal M, Cameroni E, Letourneur F et al. Control of cellular physiology by TM9 proteins in yeast and Dictyostelium. J Biol Chem 2008; 283: 6764–6772. - PubMed
    1. Gao C, Cai Y, Wang Y, Kang BH, Aniento F, Robinson DG et al. Retention mechanisms for ER and Golgi membrane proteins. Trends Plant Sci 2014; 19: 508–515. - PubMed
    1. Woo CH, Gao C, Yu P, Tu L, Meng Z, Banfield DK et al. Conserved function of the lysine-based KXD/E motif in Golgi retention for endomembrane proteins among different organisms. Mol Biol Cell 2015; 26: 4280–4293. - PMC - PubMed

Publication types