. 2017 Nov 1;10(11):1353-1369.
doi: 10.1242/dmm.030536.

Comprehensive analysis of gene expression patterns in Friedreich's ataxia fibroblasts by RNA sequencing reveals altered levels of protein synthesis factors and solute carriers

Affiliations

Comprehensive analysis of gene expression patterns in Friedreich's ataxia fibroblasts by RNA sequencing reveals altered levels of protein synthesis factors and solute carriers

Jill Sergesketter Napierala et al. Dis Model Mech. .

Abstract

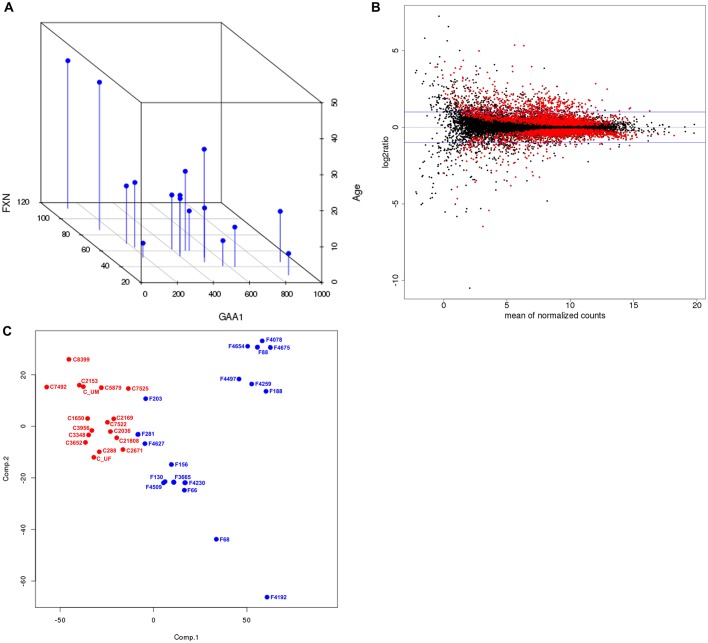
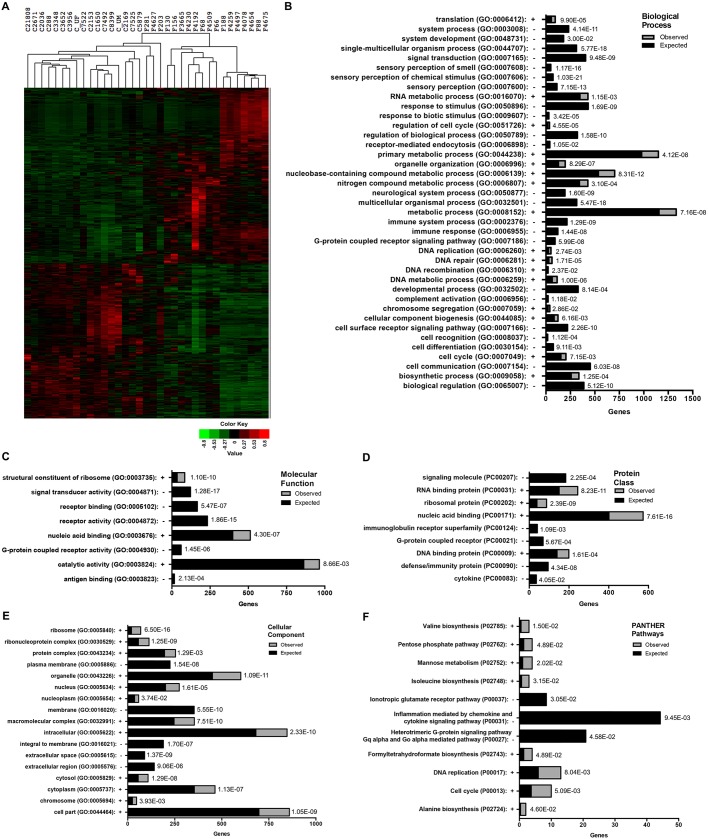
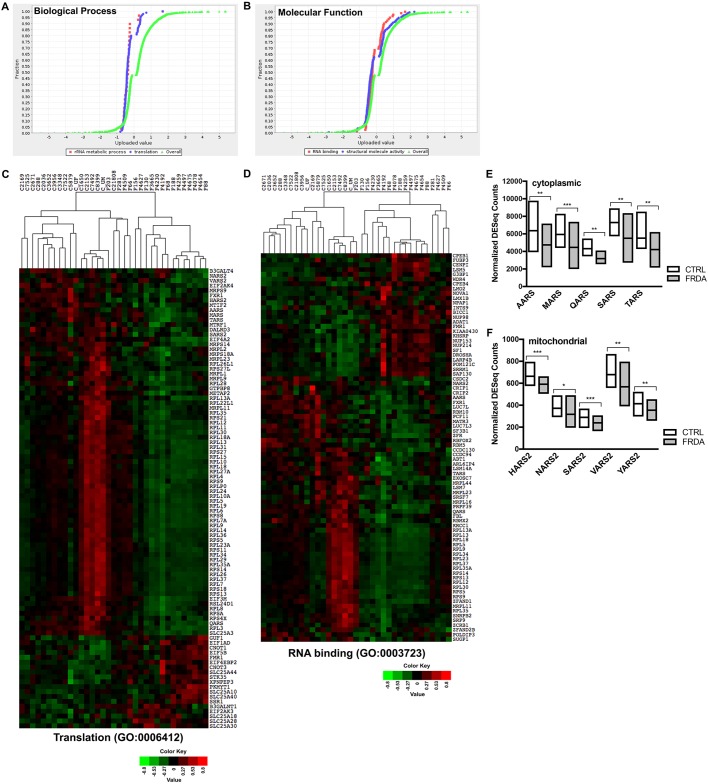
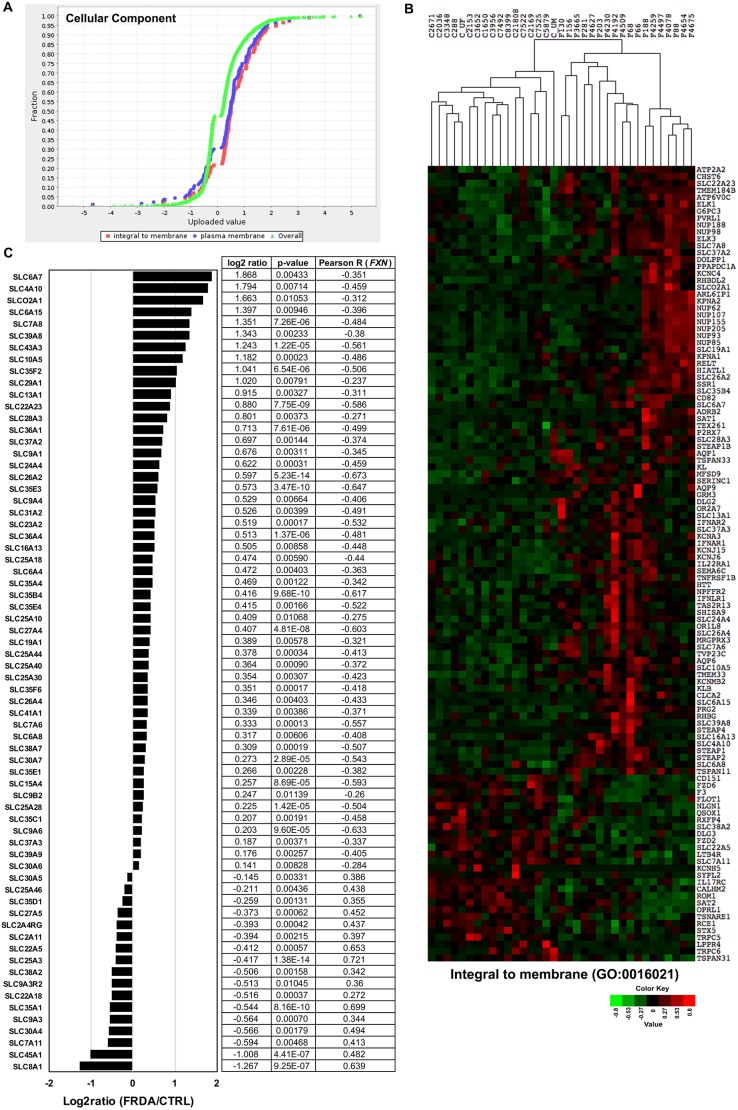
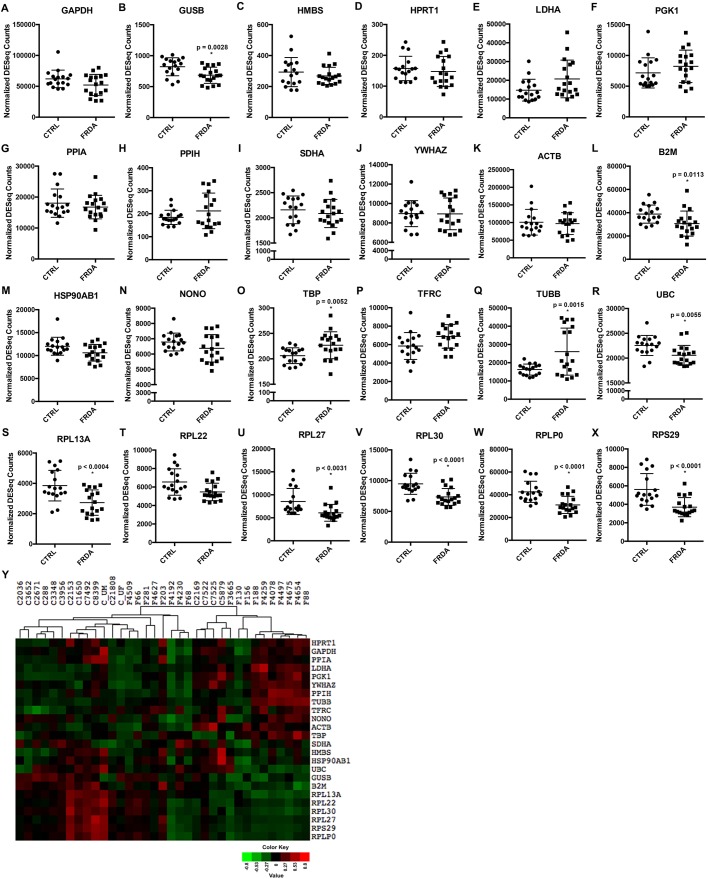
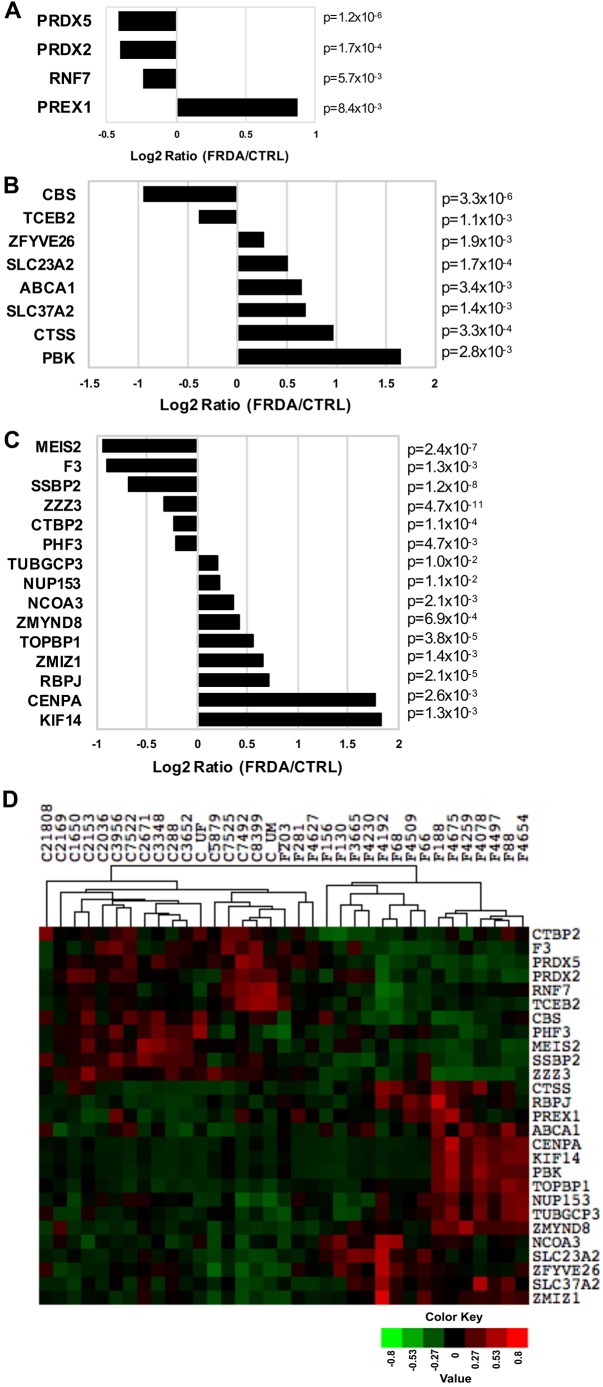
Friedreich's ataxia (FRDA) is an autosomal recessive neurodegenerative disease usually caused by large homozygous expansions of GAA repeat sequences in intron 1 of the frataxin (FXN) gene. FRDA patients homozygous for GAA expansions have low FXN mRNA and protein levels when compared with heterozygous carriers or healthy controls. Frataxin is a mitochondrial protein involved in iron-sulfur cluster synthesis, and many FRDA phenotypes result from deficiencies in cellular metabolism due to lowered expression of FXN Presently, there is no effective treatment for FRDA, and biomarkers to measure therapeutic trial outcomes and/or to gauge disease progression are lacking. Peripheral tissues, including blood cells, buccal cells and skin fibroblasts, can readily be isolated from FRDA patients and used to define molecular hallmarks of disease pathogenesis. For instance, FXN mRNA and protein levels as well as FXN GAA-repeat tract lengths are routinely determined using all of these cell types. However, because these tissues are not directly involved in disease pathogenesis, their relevance as models of the molecular aspects of the disease is yet to be decided. Herein, we conducted unbiased RNA sequencing to profile the transcriptomes of fibroblast cell lines derived from 18 FRDA patients and 17 unaffected control individuals. Bioinformatic analyses revealed significantly upregulated expression of genes encoding plasma membrane solute carrier proteins in FRDA fibroblasts. Conversely, the expression of genes encoding accessory factors and enzymes involved in cytoplasmic and mitochondrial protein synthesis was consistently decreased in FRDA fibroblasts. Finally, comparison of genes differentially expressed in FRDA fibroblasts to three previously published gene expression signatures defined for FRDA blood cells showed substantial overlap between the independent datasets, including correspondingly deficient expression of antioxidant defense genes. Together, these results indicate that gene expression profiling of cells derived from peripheral tissues can, in fact, consistently reveal novel molecular pathways of the disease. When performed on statistically meaningful sample group sizes, unbiased global profiling analyses utilizing peripheral tissues are critical for the discovery and validation of FRDA disease biomarkers.

Keywords: Fibroblasts; Friedreich's ataxia; RNA sequencing; Solute carriers; Translation.


Conflict of interest statement

Competing interestsThe authors declare no competing or financial interests.

Figures

Fig. 1.
Fig. 1.
Analysis of RNA-Seq data generated from fibroblast lines derived from 18 FRDA and 17 unaffected CTRL individuals. (A) A three-dimensional plot of GAA1 repeat length on the x-axis (GAA1), age of disease onset on the y-axis (Age) and FXN expression by RNA-Seq on the z-axis (FXN) for each FRDA fibroblast sample is shown with a view angle of 140°. Pearson's correlation coefficients were determined for each comparison and are as follows: age versus GAA1: R=−0.49, P=0.05; age versus FXN: R=0.81, P=0.0001; GAA1 vs FXN: R=−0.76, P=0.0007. (B) The MA plot illustrates log2 ratio (y-axis) versus the mean normalized counts (x-axis) for transcripts detected by RNA-Seq. The red dots represent differentially expressed genes with FDR≤0.05 and the horizontal blue lines indicate cutoff points for two-fold changes in expression. (C) PCA of CTRL (C; red) and FRDA (F; blue) samples based on expression of significantly changed genes only.
Fig. 2.
Fig. 2.
GO analysis of significantly changed genes in FRDA fibroblasts. (A) The CTRL (C) and FRDA (F) patient samples are organized by hierarchical clustering based on the normalized DESeq values for 3788 genes found to be significantly changed (FDR≤0.05) between the two groups. The expression levels of these genes are shown as a heatmap. Downregulated genes are shown in green and upregulated genes are shown in red, with the color intensity corresponding to the degree of change. (B-F) The PANTHER statistical over-representation test tool was used to determine over- and under-representation of defined GO classifications for the 3788 significantly changed genes in FRDA samples: (B) biological process; (C) molecular function; (D) protein class; (E) cellular component; (F) PANTHER pathways. Expected frequencies for each category are shown by black bars, whereas observed frequencies are indicated by gray shading. The over-representation (+) or under-representation (−) status is also indicated along each y-axis next to the GO term, which are listed alphabetically starting from the x-axis. The number of genes assigned to each category from the list of 3788 can be determined from the x-axis, and significance (P-value) for each category is given to the right of each bar.
Fig. 3.
Fig. 3.
Expression enrichment analysis reveals that genes required for protein synthesis are significantly under-expressed in FRDA fibroblasts. (A,B) The list of 3788 significantly changed genes along with the calculated log2 ratio (FRDA/CTRL) for each gene was used as the input file for the PANTHER statistical enrichment test tool. The uploaded expression value (log2 ratio) for genes assigned to the plotted categories are indicated by the x-axis, whereas the fraction of genes assigned to each category is indicated by the y-axis. The distribution of expression values for all 3788 genes is given by the central green curve and shifts to the left or right indicate lower or higher expression levels, respectively, of the genes assigned to the plotted category. Each gene is indicated by a dot. Plots are shown for selected categories for the major GO terms (A) biological process and (B) molecular function. (C,D) The normalized DESeq counts were used to generate expression heatmaps for the significantly changed genes assigned to GO categories selected from enrichment analyses shown in A and B. The CTRL and FRDA fibroblast samples were arranged by unsupervised hierarchical clustering. Downregulated genes are shown in green and upregulated genes are shown in red, with the color intensity corresponding to the degree of change. (E,F) The normalized DESeq counts for the indicated cytoplasmic aaRS genes (E) or mitochondrial aaRS genes (F) are shown for the CTRL and FRDA sample groups. The central line in each bar denotes the mean, and the upper and lower limits denote the maximum and minimum expression values for the gene in each sample group. The level of statistical significance is indicated by asterisks as follows: ***P≤0.0001; **P≤0.001; *P≤0.01.
Fig. 4.
Fig. 4.
Expression enrichment analysis reveals altered expression of genes encoding membrane solute carriers in FRDA fibroblasts. (A) The list of 3788 significantly changed genes along with the calculated log2 ratio (FRDA/CTRL) for each was used as the input file for the PANTHER statistical enrichment test tool. The uploaded expression value (log2 ratio) for genes assigned to the plotted categories are indicated by the x-axis, whereas the fraction of genes assigned to each category is indicated by the y-axis. The distribution of expression values for all 3788 genes is given by the central green curve and shifts to the left or right indicate lower or higher expression levels, respectively, of the genes assigned to the plotted category. Each gene is indicated by a dot. Plots are shown for selected categories for the major GO term cellular component. (B) The normalized DESeq counts were used to generate expression heatmaps for the significantly changed genes assigned to the category ‘integral to membrane’ (GO:0016021). The CTRL and FRDA fibroblast samples were arranged by unsupervised hierarchical clustering. Downregulated genes are shown in green and upregulated genes are shown in red, with the color intensity corresponding to the degree of change. (C) The bar plot shows the expression [log2 ratio (FRDA/CTRL)] for all SLC family genes significantly changed in FRDA cells. The log2 ratio, P-value and Pearson correlation coefficient (R; determined for correlation with FXN expression across all 35 samples) are given for each gene to the right of the plot.
Fig. 5.
Fig. 5.
Assessment of expression levels of common endogenous control genes in CTRL and FRDA fibroblasts. (A–X) The normalized DESeq counts are plotted for each CTRL and FRDA fibroblast sample for the indicated gene. Outer horizontal bars represent s.d. and the middle bar indicates the mean. Where applicable, statistical significance is denoted by an asterisk and associated P-value above the FRDA data points. (Y) The normalized DESeq counts were used to generate expression heatmaps for all 24 normalizer genes. The CTRL and FRDA samples were arranged by hierarchical clustering.
Fig. 6.
Fig. 6.
Overlapping gene expression signatures in FRDA peripheral tissue samples. The list of 3788 significantly changed genes in fibroblasts was compared to previously published gene expression datasets generated from control and FRDA lymphoblasts or lymphocytes. The bar plots depict the log2 ratio (FRDA/CTRL) for gene expression in fibroblast samples with associated P-values indicated to the right of each bar. (A) The expression ratios are plotted for four genes found to be significantly changed in both adult FRDA fibroblast and lymphoblast samples (Hayashi and Cortopassi, 2016). (B) The expression ratios of eight genes found to be significantly changed in both adult FRDA fibroblast and PBMC samples are plotted [P77 set (Coppola et al., 2011)]. (C) The expression ratios of 15 genes found to be significantly changed in adult FRDA fibroblast samples and a targeted set of genotoxic stress genes identified as differentially expressed in CTRL and FRDA PBMC samples are plotted (Haugen et al., 2010). (D) The normalized DESeq counts from the fibroblast RNASeq experiment were used to generate an expression heatmap for the 27 significantly changed genes identified in panels A-C. The CTRL and FRDA samples were arranged by hierarchical clustering.

Similar articles

Cited by

References

    1. Abeti R., Parkinson M. H., Hargreaves I. P., Angelova P. R., Sandi C., Pook M. A., Giunti P. and Abramov A. Y. (2016). Mitochondrial energy imbalance and lipid peroxidation cause cell death in Friedreich's ataxia. Cell Death Dis. 7, e2237 10.1038/cddis.2016.111 - DOI - PMC - PubMed
    1. Anders S. and Huber W. (2010). Differential expression analysis for sequence count data. Genome Biol. 11, R106 10.1186/gb-2010-11-10-r106 - DOI - PMC - PubMed
    1. Babcock M., de Silva D., Oaks R., Davis-Kaplan S., Jiralerspong S., Montermini L., Pandolfo M. and Kaplan J. (1997). Regulation of mitochondrial iron accumulation by Yfh1p, a putative homolog of frataxin. Science 276, 1709-1712. 10.1126/science.276.5319.1709 - DOI - PubMed
    1. Bhalla A. D., Khodadadi-Jamayran A., Li Y., Lynch D. R. and Napierala M. (2016). Deep sequencing of mitochondrial genomes reveals increased mutation load in Friedreich's ataxia. Ann. Clin. Transl. Neurol. 3, 523-536. 10.1002/acn3.322 - DOI - PMC - PubMed
    1. Busi M. V., Maliandi M. V., Valdez H., Clemente M., Zabaleta E. J., Araya A. and Gomez-Casati D. F. (2006). Deficiency of Arabidopsis thaliana frataxin alters activity of mitochondrial Fe-S proteins and induces oxidative stress. Plant J. 48, 873-882. 10.1111/j.1365-313X.2006.02923.x - DOI - PubMed

Publication types