Review
. 2018 Apr:49:8-15.
doi: 10.1016/j.conb.2017.10.012. Epub 2017 Nov 7.

Contextual modulation of sound processing in the auditory cortex

Affiliations
Review

Contextual modulation of sound processing in the auditory cortex

C Angeloni et al. Curr Opin Neurobiol. 2018 Apr.

Abstract

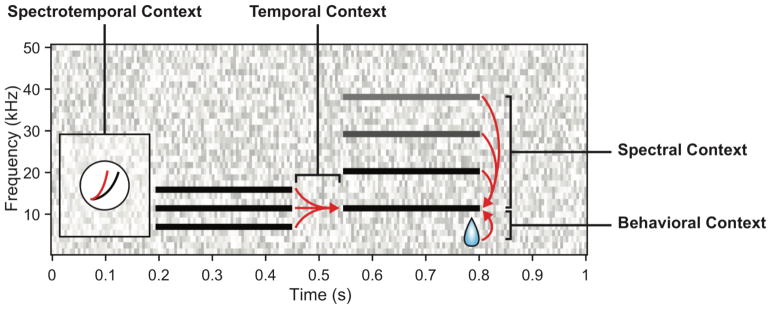
In everyday acoustic environments, we navigate through a maze of sounds that possess a complex spectrotemporal structure, spanning many frequencies and exhibiting temporal modulations that differ within frequency bands. Our auditory system needs to efficiently encode the same sounds in a variety of different contexts, while preserving the ability to separate complex sounds within an acoustic scene. Recent work in auditory neuroscience has made substantial progress in studying how sounds are represented in the auditory system under different contexts, demonstrating that auditory processing of seemingly simple acoustic features, such as frequency and time, is highly dependent on co-occurring acoustic and behavioral stimuli. Through a combination of electrophysiological recordings, computational analysis and behavioral techniques, recent research identified the interactions between external spectral and temporal context of stimuli, as well as the internal behavioral state.


Conflict of interest statement

The authors declare that they have no conflicts of interest with respect to the work described in the manuscript.

Figures

Figure 1
Figure 1
Schematic of auditory context effects. Spectral context. The effects of spectral energy in near and distant frequency bands on characteristic frequency responses, as demonstrated with two-tone suppression and harmonic facilitation. Temporal context. The effects of preceding tones on a probe stimulus, as demonstrated by forward suppression and related to SSA. Spectrotemporal context. The joint effects of energy distributed across frequency and time, often resulting in adaptation of nonlinear response properties to suit persistent environmental statistics. Behavioral context. The effects of reward contingency on auditory responses.
Figure 2
Figure 2
Examples of spectral and temporal context. A) Two-tone suppression. Top: schematic of stimuli used in two-tone suppression experiments, consisting of a reference tone presented at characteristic frequency (CF; S1, black bar) presented alone and in the presence of a competing tone (S2, grey bars). Bottom: Change in firing rate of an example neuron between presentations of S1 alone (S1: 1.47 kHz, 50 dB SPL) relative to S1 presented with S2 stimuli of varying frequencies (S2:.12–5.88 kHz, 70 dB SPL). Note suppressive effects at nearby frequencies, but facilitative effects near the first harmonic (3 kHz). Dotted and dashed lines represent the response to S1 alone, and the characteristic frequency, respectively. Figure adapted from Kadia and Wang, 2003 [12]. B) Forward suppression. Top: schematic of stimuli used in forward suppression experiments, consisting of masker tones of varying frequency (grey bars) followed by a probe tone typically presented at CF (black bar) at variable delays. Bottom: Frequency response areas (FRAs) of an example neuron in response to the masker (left) and the probe (right) as a function of masker frequency relative to CF and masker level. Note the suppression of spiking in response to the probe when preceded by masker tones that elicited strong responses, such that forward suppression roughly resembles the FRA of the neuron. Figure adapted from Scholl et al., 2008 [30].
Figure 3
Figure 3
Gain adaptation to spectrotemporal context. A) Spectrograms of dynamic random chord (DRC) stimuli used to manipulate stimulus contrast. σL and c denote the width of the uniform distributions from which tone levels were sampled, analogous to the spectrotemporal contrast in each DRC stimulus. Contrast increases from left to right, and the level of each tone in dB SPL is denoted by the color bar on the right. B) Nonlinear fits (grey lines) to predicted linear responses versus the observed rate responses to stimuli presented at low (blue), medium (green), and high (red) contrast levels. X·v denotes the convolution of the corresponding stimulus spectrogram (X) above with the normalized STRF (v) of the neuron. Note that the slopes of the nonlinear fits scale to maximize sensitivity in the range of intensity values present at each contrast level, demonstrating adaptation of neural dynamic range to account for the stimulus dynamic range. C) Spectrograms of DRCs generated with different levels of temporal correlation (TC) across adjacent chords. D) Nonlinear fits (solid lines) to predicted versus observed responses in low (blue) and high TC conditions (red). Response gain is high for stimuli with low TC, and low for stimuli with high TC. A and B adapted from Rabinowitz et al., 2011 [47], C and D adapted from Natan et al., 2017 [49].
Figure 4
Figure 4
STRF plasticity during behavior. A) Approach task. During behavior, animals received rewards when licking during a target tone. Left: Population averaged STRF changes between active and passive conditions. STRFs were aligned to the frequency of the target tone. Blue indicates a suppression relative to the passive condition, while red indicates excitation. Note that during the approach task, there is a prominent suppression at the target frequency. Right: Cell counts indicating the population level STRF change at the target frequency. Blue bars indicate suppressed responses while red bars indicate enhanced responses. Filled bars indicate units showing significant modulation by behavioral context. Arrows denote the median change in significant units. B) Avoidance task. During behavior, animals received rewards when licking during reference noise bursts, but not during the target stimulus. Plots as in A). Note that during the approach task, there is significant suppression at the target, while during the avoidance task, there is significant enhancement at the target. Figures adapted from David et al., 2012 [73].

References

    1. von Békésy G. Experiments in hearing. McGraw-Hill; 1960.
    1. Ruggero MA. The Mammalian Auditory Pathway: Neurophysiology. Springer; New York, NY: 1992. Physiology and Coding of Sound in the Auditory Nerve; pp. 34–93.
    1. Rhode WS. Some observations on two-tone interaction measured with the Mössbauer effect. Psychophys Physiol Hear. 1977
    1. Robles L, Ruggero MA, Rich NC. Cochlear Mechanisms: Structure, Function, and Models. Springer; US: 1989. Nonlinear Interactions in the Mechanical Response of the Cochlea to Two-Tone Stimuli; pp. 369–375.
    1. Ruggero MA, Robles L, Rich NC. Two-Tone Suppression in the Basilar Membrane of the Cochlea: Mechanical Basis of Auditory-Nerve Rate Suppression. JOURNALOF Neurophysiol. 1992:68. - PubMed

Publication types

LinkOut - more resources