

An image cytometric technique is a concise method to detect adenoviruses and host cell proteins and to monitor the infection and cellular responses induced
- PMID: 29126418
- PMCID: PMC5681831
- DOI: 10.1186/s12985-017-0888-0
An image cytometric technique is a concise method to detect adenoviruses and host cell proteins and to monitor the infection and cellular responses induced
Abstract
Background: Genetically modified adenoviruses (Ad) with preferential replications in tumor cells have been examined for a possible clinical applicability as an anti-cancer agent. A simple method to detect viral and cellular proteins is valuable to monitor the viral infections and to predict the Ad-mediated cytotoxicity.
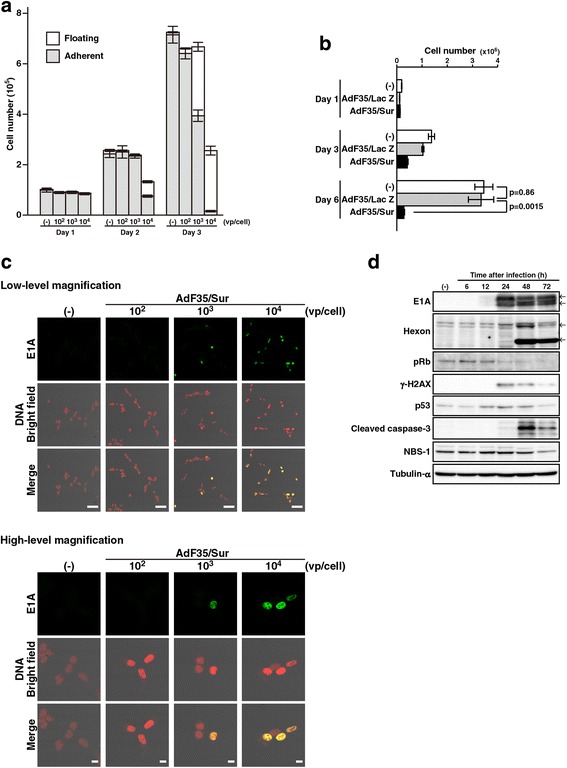
Methods: We used type 5 Ad in which the expression of E1A gene was activated by 5'-regulatory sequences of genes that were augmented in the expression in human tumors. The Ad were further modified to have the fiber-knob region replaced with that derived from type 35 Ad. We infected human mesothelioma cells with the fiber-replaced Ad, and sequentially examined cytotoxic processes together with an expression level of the viral E1A, hexon, and cellular cleaved caspase-3 with image cytometric and Western blot analyses.
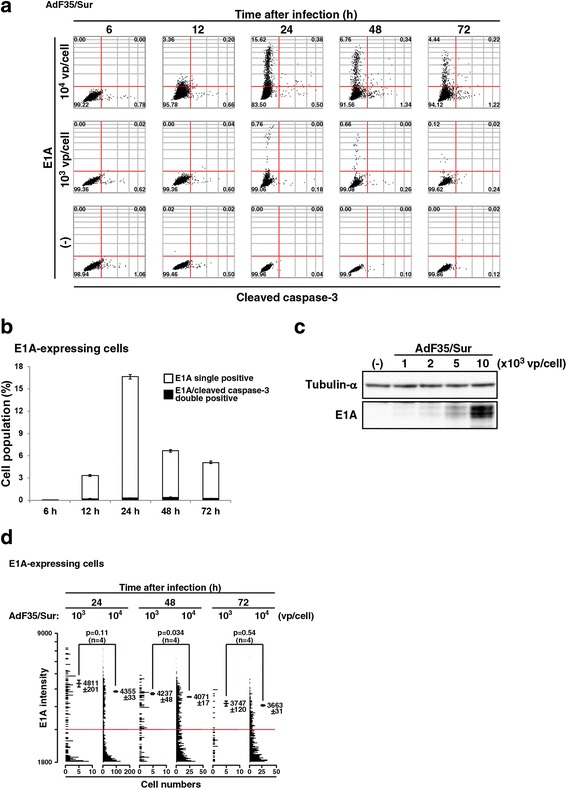
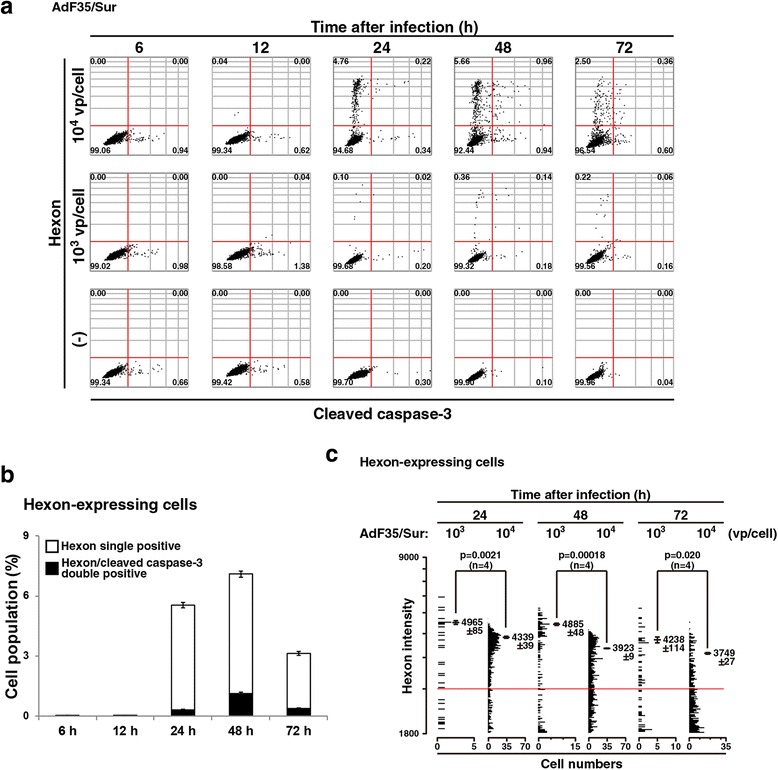
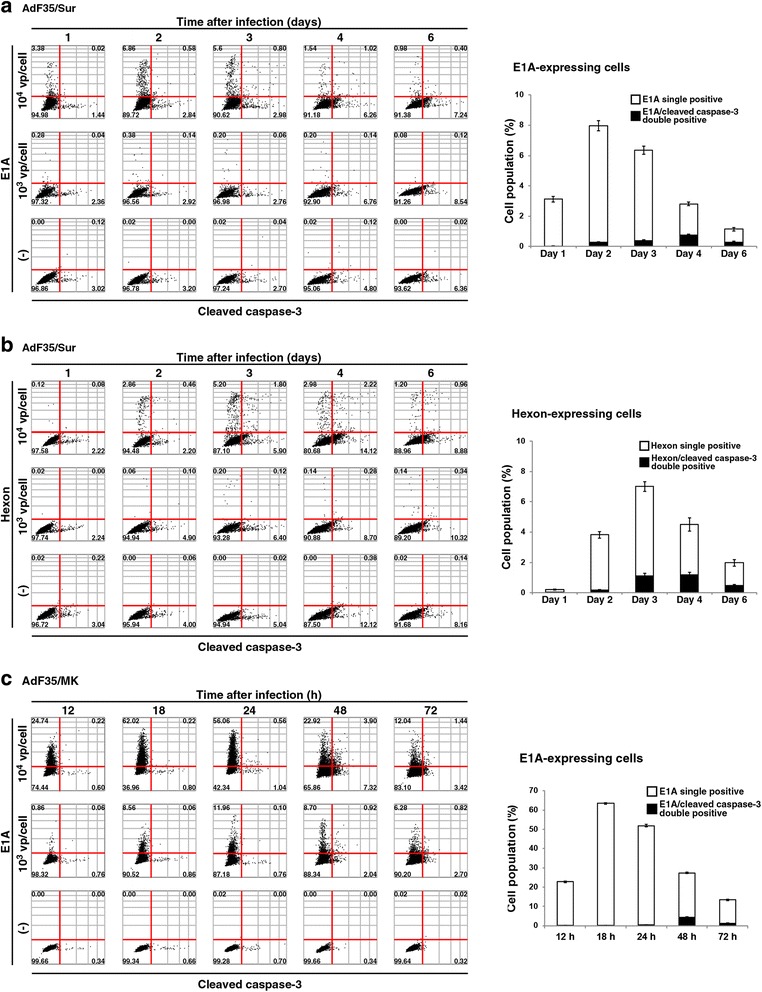
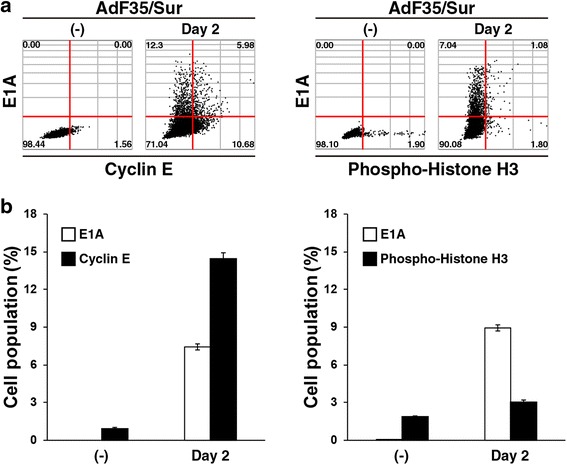
Results: The replication-competent Ad produced cytotoxicity on mesothelioma cells. The infected cells expressed E1A and hexon 24 h after the infection and then showed cleavage of caspase-3, all of which were detected with image cytometry and Western blot analysis. Image cytometry furthermore demonstrated that increased Ad doses did not enhance an expression level of E1A and hexon in an individual cell and that caspase-3-cleaved cells were found more frequently in hexon-positive cells than in E1A-positive cells. Image cytometry thus detected these molecular changes in a sensitive manner and at a single cell level. We also showed that an image cytometric technique detected expression changes of other host cell proteins, cyclin-E and phosphorylated histone H3 at a single cell level.
Conclusions: Image cytometry is a concise procedure to detect expression changes of Ad and host cell proteins at a single cell level, and is useful to analyze molecular events after the infection.
Keywords: Cleaved caspase-3; E1A; Hexon; Image cytometry; Replication-competent adenovirus.
Conflict of interest statement
Ethics approval and consent to participate
This article does not contain any studies with human beings or animals.
Consent for publication
Not applicable. This article does not contain any studies with human beings or animals.
Competing interests
The authors declare that there is no conflict of interests in this research. We obtained a grant from Nichias Corporation. It is not a pharmaceutical company but a company making industrial products for building, automobiles and pipes (see
Publisher’s Note
Springer Nature remains neutral with regard to jurisdictional claims in published maps and institutional affiliations.
Figures
Similar articles
-
Cytotoxicity of replication-competent adenoviruses powered by an exogenous regulatory region is not linearly correlated with the viral infectivity/gene expression or with the E1A-activating ability but is associated with the p53 genotypes.BMC Cancer. 2017 Sep 5;17(1):622. doi: 10.1186/s12885-017-3621-x. BMC Cancer. 2017. PMID: 28874135 Free PMC article.
-
Etoposide enhances antitumor efficacy of MDR1-driven oncolytic adenovirus through autoupregulation of the MDR1 promoter activity.Oncotarget. 2015 Nov 10;6(35):38308-26. doi: 10.18632/oncotarget.5702. Oncotarget. 2015. PMID: 26515462 Free PMC article.
-
Replication-competent adenoviruses with the type 35-derived fiber-knob region achieve reactive oxygen species-dependent cytotoxicity and produce greater toxicity than those with the type 5-derived region in pancreatic carcinoma.Apoptosis. 2015 Dec;20(12):1587-98. doi: 10.1007/s10495-015-1171-8. Apoptosis. 2015. PMID: 26373551
-
Tumor suppressor in lung cancer-1 (TSLC1) mediated by dual-regulated oncolytic adenovirus exerts specific antitumor actions in a mouse model.Acta Pharmacol Sin. 2013 Apr;34(4):531-40. doi: 10.1038/aps.2012.196. Epub 2013 Mar 18. Acta Pharmacol Sin. 2013. PMID: 23503473 Free PMC article.
-
Tropism and transduction of oncolytic adenovirus 5 vectors in cancer therapy: Focus on fiber chimerism and mosaicism, hexon and pIX.Virus Res. 2018 Sep 15;257:40-51. doi: 10.1016/j.virusres.2018.08.012. Epub 2018 Aug 17. Virus Res. 2018. PMID: 30125593 Review.
References
-
- Zhu ZB, Chen Y, Makhija SK, Lu B, Wang M, Rivera AA, Yamamoto M, Wang S, Siegal GP, Curiel DT, McDonald JM. Survivin promoter-based conditionally replicative adenoviruses target cholangiocarcinoma. Int J Oncol. 2006;29:1319–1329. - PubMed
-
- Miyauchi M, Yoshida Y, Tada Y, Narita M, Maeda T, Bahar R, Kadomatsu K, Muramatsu T, Matsubara S, Nakagawara A, Sakiyama S, Tagawa M. Expression of herpes simplex virus-thymidine kinase gene controlled by a promoter region of the midkine gene confers selective cytotoxicity to ganciclovir in human carcinoma cells. Int J Cancer. 2001;91:723–727. doi: 10.1002/1097-0215(200002)9999:9999<::AID-IJC1112>3.0.CO;2-X. - DOI - PubMed
MeSH terms
Substances
LinkOut - more resources
Full Text Sources
Other Literature Sources
Medical
Research Materials
