

Dual role of protein tyrosine phosphatase 1B in the progression and reversion of non-alcoholic steatohepatitis
- PMID: 29126873
- PMCID: PMC5784331
- DOI: 10.1016/j.molmet.2017.10.008
Dual role of protein tyrosine phosphatase 1B in the progression and reversion of non-alcoholic steatohepatitis
Abstract
Objectives: Non-alcoholic fatty liver disease (NAFLD) is the most common chronic liver disease in Western countries. Protein tyrosine phosphatase 1B (PTP1B), a negative modulator of insulin and cytokine signaling, is a therapeutic target for type 2 diabetes and obesity. We investigated the impact of PTP1B deficiency during NAFLD, particularly in non-alcoholic steatohepatitis (NASH).
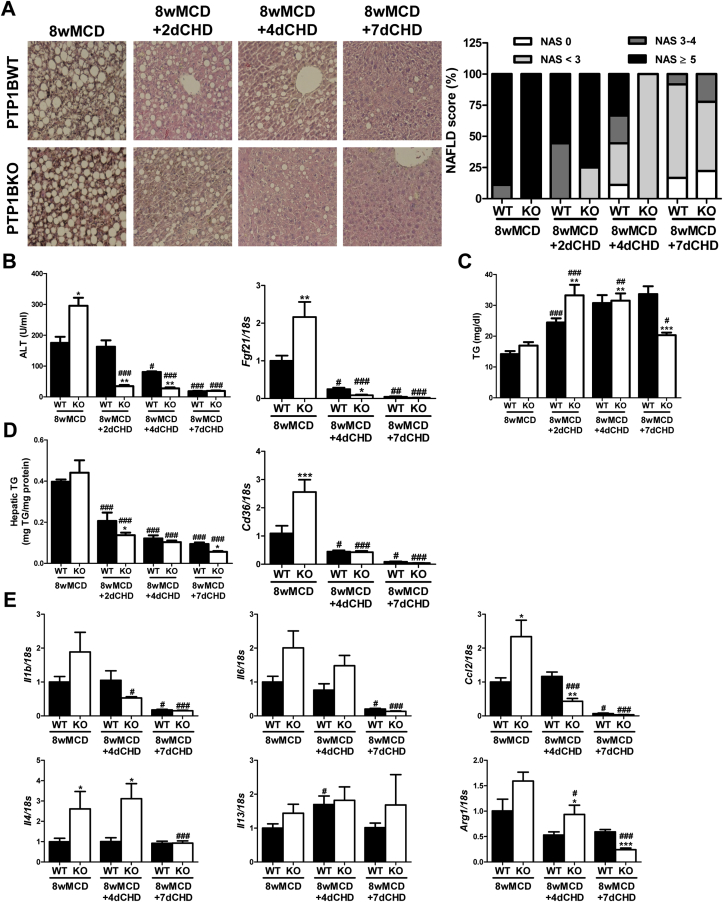
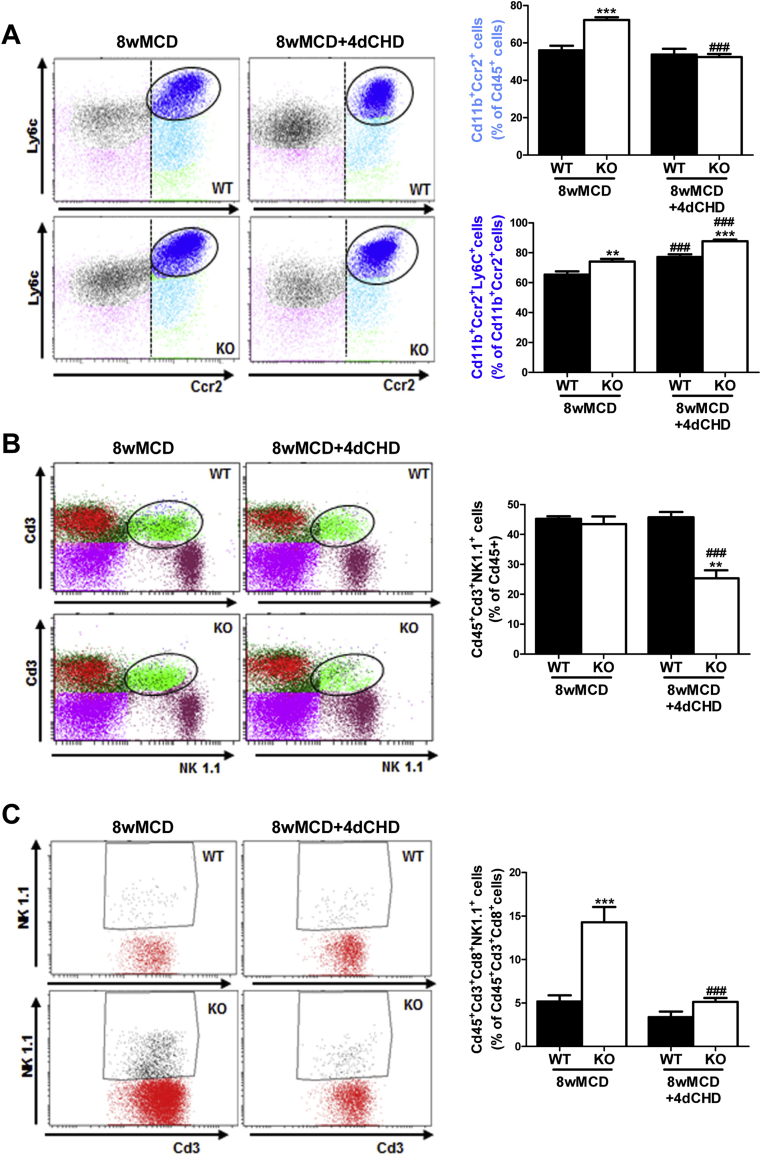
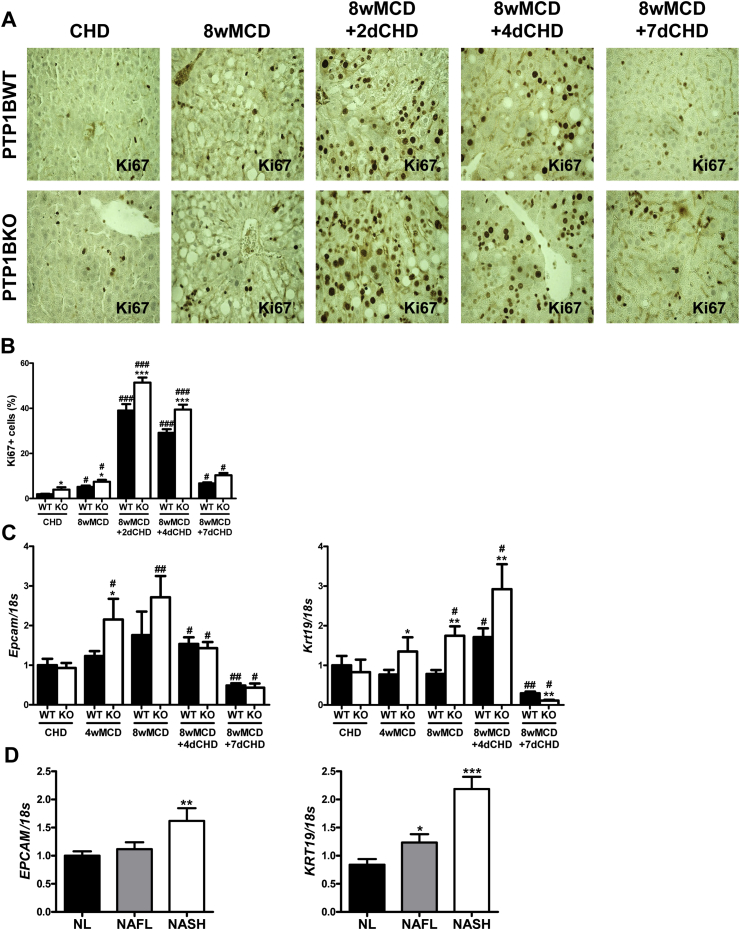
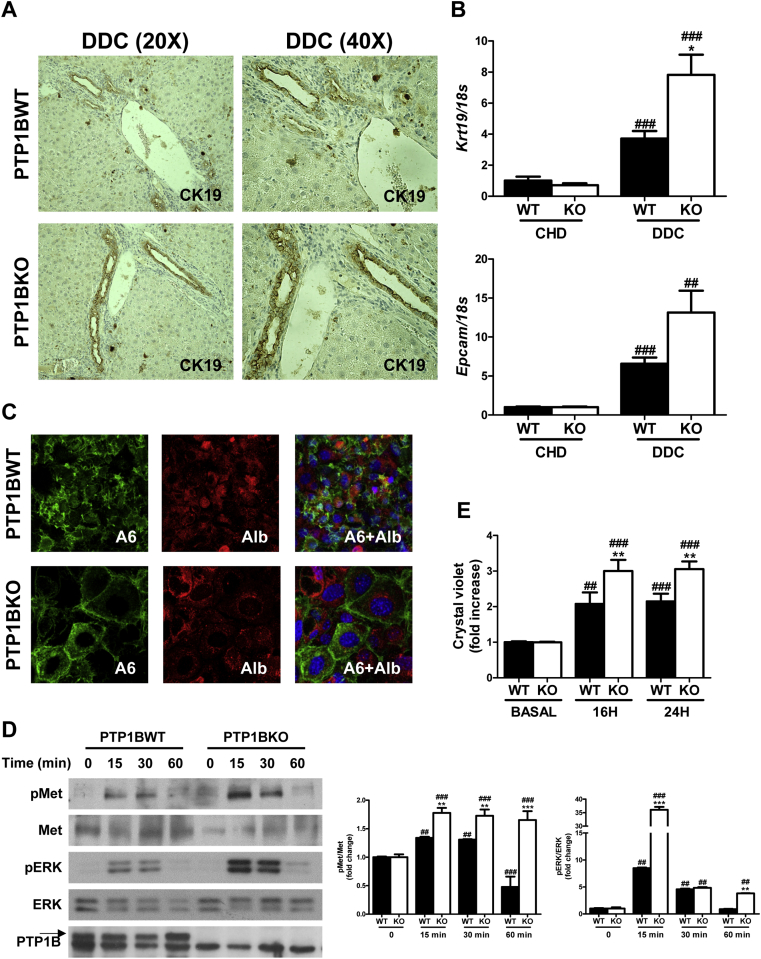
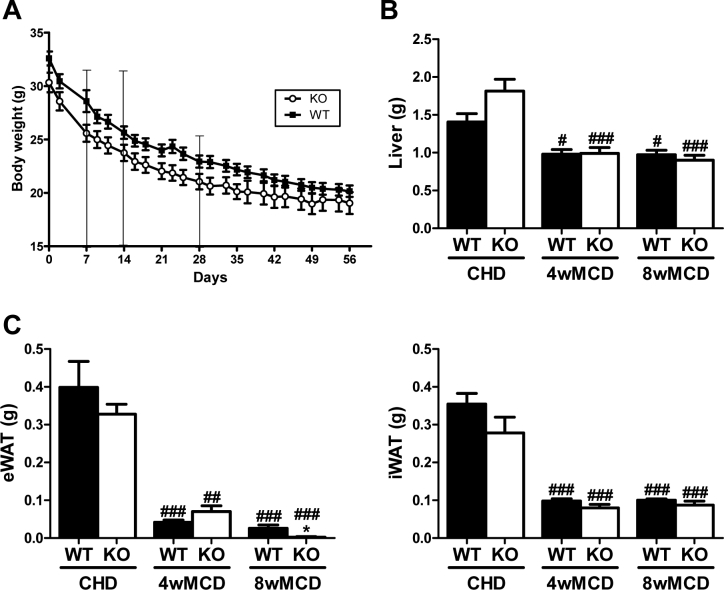
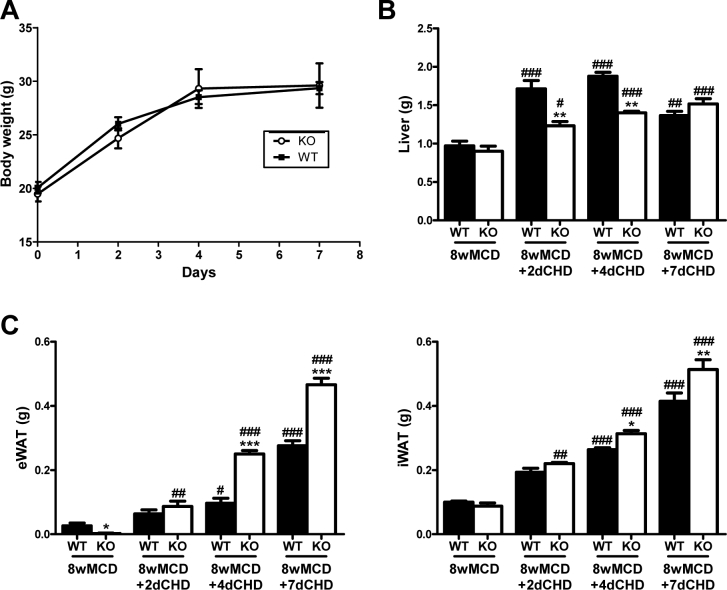
Methods: NASH features were evaluated in livers from wild-type (PTP1BWT) and PTP1B-deficient (PTP1BKO) mice fed methionine/choline-deficient diet (MCD) for 8 weeks. A recovery model was established by replacing MCD to chow diet (CHD) for 2-7 days. Non-parenchymal liver cells (NPCs) were analyzed by flow cytometry. Oval cells markers were measured in human and mouse livers with NASH, and in oval cells from PTP1BWT and PTP1BKO mice.
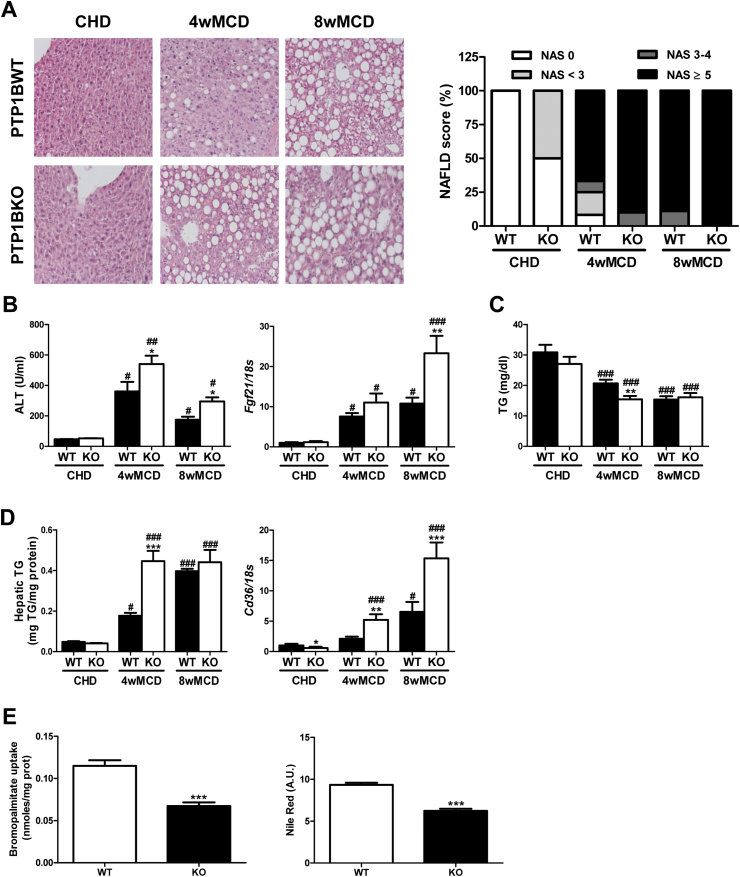
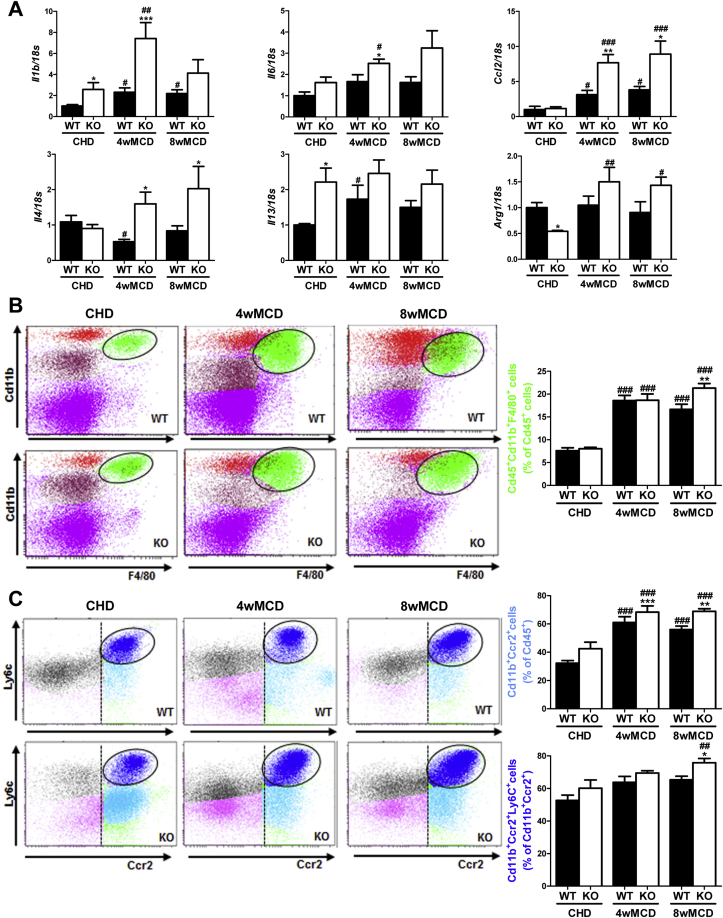
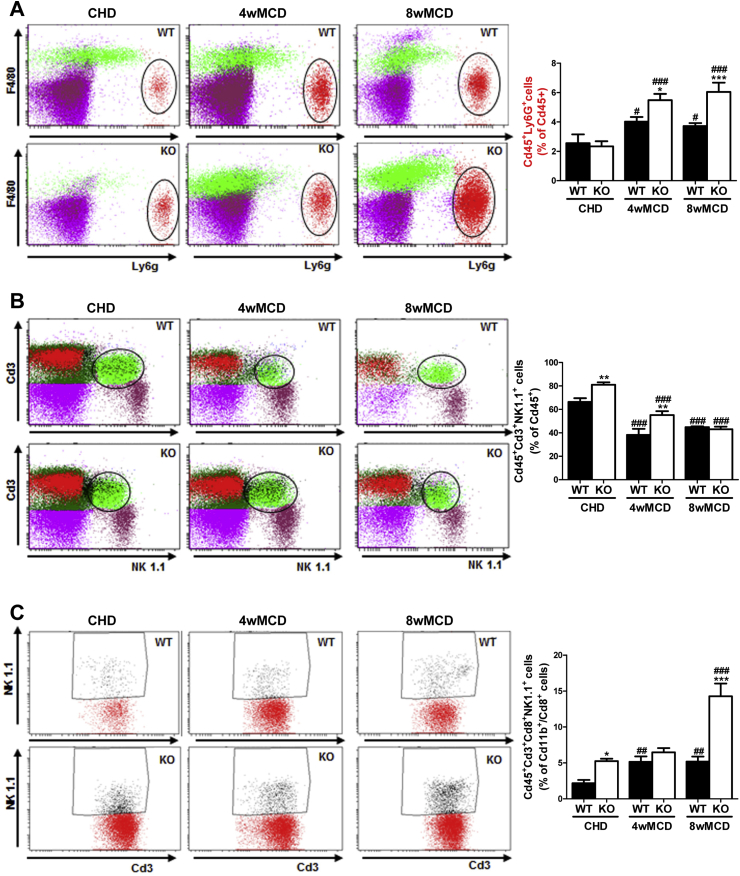
Results: PTP1BWT mice fed MCD for 8 weeks exhibited NASH, NPCs infiltration, and elevated Fgf21, Il6 and Il1b mRNAs. These parameters decreased after switching to CHD. PTP1B deficiency accelerated MCD-induced NASH. Conversely, after switching to CHD, PTP1BKO mice rapidly reverted NASH compared to PTP1BWT mice in parallel to the normalization of serum triglycerides (TG) levels. Among NPCs, a drop in cytotoxic natural killer T (NKT) subpopulation was detected in PTP1BKO livers during recovery, and in these conditions M2 macrophage markers were up-regulated. Oval cells markers (EpCAM and cytokeratin 19) significantly increased during NASH only in PTP1B-deficient livers. HGF-mediated signaling and proliferative capacity were enhanced in PTP1BKO oval cells. In NASH patients, oval cells markers were also elevated.
Conclusions: PTP1B elicits a dual role in NASH progression and reversion. Additionally, our results support a new role for PTP1B in oval cell proliferation during NAFLD.
Keywords: Inflammation; Oval cells; PTP1B; Steatohepatitis; Steatosis.
Copyright © 2017 The Authors. Published by Elsevier GmbH.. All rights reserved.
Figures
Similar articles
-
Impact of global PTP1B deficiency on the gut barrier permeability during NASH in mice.Mol Metab. 2020 May;35:100954. doi: 10.1016/j.molmet.2020.01.018. Epub 2020 Feb 6. Mol Metab. 2020. PMID: 32244182 Free PMC article.
-
β7-Integrin and MAdCAM-1 play opposing roles during the development of non-alcoholic steatohepatitis.J Hepatol. 2017 Jun;66(6):1251-1264. doi: 10.1016/j.jhep.2017.02.001. Epub 2017 Feb 10. J Hepatol. 2017. PMID: 28192190
-
CD44 is a key player in non-alcoholic steatohepatitis.J Hepatol. 2017 Aug;67(2):328-338. doi: 10.1016/j.jhep.2017.03.003. Epub 2017 Mar 16. J Hepatol. 2017. PMID: 28323124
-
A Comparison of the Gene Expression Profiles of Non-Alcoholic Fatty Liver Disease between Animal Models of a High-Fat Diet and Methionine-Choline-Deficient Diet.Molecules. 2022 Jan 27;27(3):858. doi: 10.3390/molecules27030858. Molecules. 2022. PMID: 35164140 Free PMC article. Review.
-
Fibroblast growth factor 21 in non-alcoholic fatty liver disease.Metabolism. 2019 Dec;101:153994. doi: 10.1016/j.metabol.2019.153994. Epub 2019 Oct 28. Metabolism. 2019. PMID: 31672443 Review.
Cited by
-
Small extracellular vesicles from Ptpn1-deficient macrophages alleviate intestinal inflammation by reprogramming macrophage polarization via lactadherin enrichment.Redox Biol. 2022 Dec;58:102558. doi: 10.1016/j.redox.2022.102558. Epub 2022 Nov 28. Redox Biol. 2022. PMID: 36462232 Free PMC article.
-
Platelet C3G protects from liver fibrosis, while enhancing tumor growth through regulation of the immune response.J Pathol. 2025 Apr;265(4):502-517. doi: 10.1002/path.6403. Epub 2025 Feb 24. J Pathol. 2025. PMID: 39989399 Free PMC article.
-
The role of protein tyrosine phosphatase 1B (PTP1B) in the pathogenesis of type 2 diabetes mellitus and its complications.J Physiol Biochem. 2022 May;78(2):307-322. doi: 10.1007/s13105-021-00860-7. Epub 2022 Jan 6. J Physiol Biochem. 2022. PMID: 34988903 Review.
-
Revelation of Proteomic Indicators for Colorectal Cancer in Initial Stages of Development.Molecules. 2020 Jan 31;25(3):619. doi: 10.3390/molecules25030619. Molecules. 2020. PMID: 32023884 Free PMC article.
-
The PTP1B Inhibitor Trodusquemine (MSI-1436) Improves Glucose Uptake in Equine Metabolic Syndrome Affected Liver through Anti-Inflammatory and Antifibrotic Activity.Int J Inflam. 2023 Sep 30;2023:3803056. doi: 10.1155/2023/3803056. eCollection 2023. Int J Inflam. 2023. PMID: 37808009 Free PMC article.
References
-
- Seely B.L., Staubs P.A., Reichart D.R., Berhanu P., Milarski K.L., Saltiel A.R. Protein tyrosine phosphatase 1B interacts with the activated insulin receptor. Diabetes. 1996;45:1379–1385. - PubMed
-
- Zabolotny J.M., Bence-Hanulec K.K., Stricker-Krongrad A., Haj F., Wang Y., Minokoshi Y. PTP1B regulates leptin signal transduction in vivo. Developmental Cell. 2002;2:489–495. - PubMed
-
- Elchebly M., Payette P., Michaliszyn E., Cromlish W., Collins S., Loy A.L. Increased insulin sensitivity and obesity resistance in mice lacking the protein tyrosine phosphatase-1B gene. Science. 1999;283:1544–1548. - PubMed
-
- Haj F.G., Zabolotny J.M., Kim Y.B., Kahn B.B., Neel B.G. Liver-specific protein-tyrosine phosphatase 1B (PTP1B) re-expression alters glucose homeostasis of PTP1B-/-mice. Journal of Biological Chemistry. 2005;280:15038–15046. - PubMed
Publication types
MeSH terms
Substances
LinkOut - more resources
Full Text Sources
Other Literature Sources
Medical
Molecular Biology Databases
Miscellaneous
