. 2018 Jan 15:369:1-14.
doi: 10.1016/j.neuroscience.2017.11.001. Epub 2017 Nov 8.

Quantitative Analysis of Kynurenine Aminotransferase II in the Adult Rat Brain Reveals High Expression in Proliferative Zones and Corpus Callosum

Affiliations

Quantitative Analysis of Kynurenine Aminotransferase II in the Adult Rat Brain Reveals High Expression in Proliferative Zones and Corpus Callosum

Chang Song et al. Neuroscience. .

Abstract

Kynurenic acid, a metabolite of the kynurenine pathway of tryptophan degradation, acts as an endogenous antagonist of alpha7 nicotinic and NMDA receptors and is implicated in a number of neurophysiological and neuropathological processes including cognition and neurodegenerative events. Therefore, kynurenine aminotransferase II (KAT II/AADAT), the enzyme responsible for the formation of the majority of neuroactive kynurenic acid in the brain, has prompted significant interest. Using immunohistochemistry, this enzyme was localized primarily in astrocytes throughout the adult rat brain, but detailed neuroanatomical studies are lacking. Here, we employed quantitative in situ hybridization to analyze the relative expression of KAT II mRNA in the brain of rats under normal conditions and 6 h after the administration of lipopolysaccharides (LPSs). Specific hybridization signals for KAT II were detected, with the highest expression in the subventricular zone (SVZ), the rostral migratory stream and the floor of the third ventricle followed by the corpus callosum and the hippocampus. This pattern of mRNA expression was paralleled by differential protein expression, determined by serial dilutions of antibodies (up to 1:1 million), and was confirmed to be primarily astrocytic in nature. The mRNA signal in the SVZ and the hippocampus was substantially increased by the LPS treatment without detectable changes elsewhere. These results demonstrate that KAT II is expressed in the rat brain in a region-specific manner and that gene expression is sensitive to inflammatory processes. This suggests an unrecognized role for kynurenic acid in the brain's germinal zones.

Keywords: astrocytes; doublecortin; in situ hybridization; lipopolysaccharides; subventricular zone; tanycytes.


Conflict of interest statement

All the authors declare no conflict of interest.

Figures
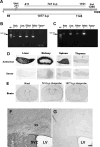
Figure 1
Figure 1
A) Template design for in vitro transcription of riboprobes of 741 or 1077 base pairs (b.p) targeting the rat KAT II mRNA Genebank accession number NM_017193.1. Specific PCR amplification products from RNA purified from different tissues for the regions generating a sequence of 741 bp (B) or 1077 bp (C) corresponding to KAT II mRNA. D) Film autoradiographic images of specific hybridization signals in different tissues generated by the riboprobe of 741 bp. E) Identical hybridization signals were obtained with the 2 riboprobes. Addition of purified KAT II to diluted antibody (1:30,000) completely blocks all staining. F–G: Specificity of the antibody, micrographs showing the staining in the corpus callosum (cc) and subventricular zone (SVZ) in rat sections processed normally (F) or preadsorbed with purified KAT II (B). LV: lateral ventricle. Scale bar = 100μm.
Figure 2
Figure 2
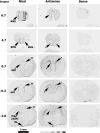
Film autoradiographic digital images of coronal sections of the brain of adult male rats hybridized with 35S labeled riboprobes directed against KAT II mRNA (antisense) or sense control probes. Left panel: The annotated Nissl stained images provided the anatomical coordinates with respect to bregma for the adjacent sections showing autoradiographic signals. 3V: third ventricle, cc: corpus callosum, Hipp (SLM): stratum lacunosum moleculare of the hippocampus, RMS: rostral migratory stream, SVZ: subventricular zone. The scale bar applies to all panels, and the gray bar refers to 14C standards used for quantification showing the linear range of the film according to the exposure time.
Figure 3
Figure 3
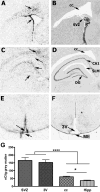
Film autoradiographic digital images (A, C, E) and Nissl stained adjacent sections (B, D, F) of representative signals used for quantification by densitometry in different brain regions. The image in panel A shows the hybridization signal in the subventricular zone (SVZ) and corpus callosum (cc) and the shaded areas in panel B depict the “mask” that was applied to measure mean intensity levels. Similarly, panels C and D show representative sections used for quantification in the hippocampal formation (Hipp) and corresponding level of the cc. Panels E and F correspond to the floor of the 3rd ventricle. G: Quantification of mean intensity values of KAT II expression in the brain regions shown above of adult male rats (n= 6). 3V: 3rd ventricle; CA1: pyramidal cell layer of the hippocampal CA1 region; SLM: stratum lacunosum moleculare; DG: granule cell layer of the dentate gyrus; ME: median eminence. (*): p < 0.05; (***): p < 0.0001.
Figure 4
Figure 4
Digital microscopic images of sections showing immunoreactivity against KAT II incubated 48–72 h with primary antibody dilutions of 1:100,000 (1/100K), 1:300,000 (1/300K) or 1:1,000,000 (1/1M). SVZ: subventricular zone; 3V: 3rd ventricle; cc: corpus callosum; Hipp: hippocampus; CPu: caudate putamen; Ctx: cerebral cortex. Scale bar applied to all panels.
Figure 5
Figure 5
Digital images of double fluorescent immunohistochemistry of KAT II (red) and glial fibrillary acidic protein (GFAP, green) in sagittal sections of the brain of adult male rats. A: low power micrograph at the level of the subventricular zone (SVZ) and the rostral migratory stream (RMS) indicates significant overlap of the two signals (yellow). Co-localization of KAT II and GFAP in the SVZ and the RMS, respectively, is shown at the cellular level in B and C, and with high resolution imaging in D. Orthogonal projections of z-stack images confirm co-localization of KAT II and GFAP in the RMS (D). cc: corpus callosum; CPu: caudate putamen; Ctx: cerebral cortex; LV: lateral ventricle; OB: olfactory bulb
Figure 6
Figure 6
Digital images of double fluorescent immunohistochemistry of KAT II (red) and doublecortin (DCX, green) in sagittal sections of the brain of adult male rats. A: low power micrographs at the level of the subventricular zone (SVZ) and the rostral migratory stream (RMS) illustrate the close apposition of the two signals. B and C: higher magnification of the areas denoted in A indicates a close association of KAT II with DCX but not co-localization. This is shown at the cellular level with high-resolution imaging (D). Orthogonal projections of z-stack images confirm that KAT II and DCX signals are not present in the same cellular structures. cc: corpus callosum; CPu: caudate putamen; Ctx: cerebral cortex; OB: olfactory bulb.
Figure 7
Figure 7
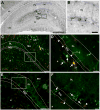
KAT II immunolabeling in the hippocampal formation. A) Low magnification image of KAT II Ni-DAB labeling (1:100K) in the hippocampus. Densely labeled KAT II positive cells are located in the stratum lacunosum moleculare (LM). Scale bar = 500 μm. B) High magnification image of the area outlined in (A) showing KAT II positive cells in the dentate gyrus, restricted primarily to the subgranular zone (SGZ). Scale bar = 50 μm. C) Low magnification (10×) image of double immunofluorescence of KAT II (red) and GFAP (green). Scale bar = 100 μm. D) High magnification (400×) image of area outlined in (C) showing KAT II positive cells associated with GFAP positive astrocytes (arrows) and radial glial cells (arrowheads). Scale bar = 10 μm. E) KAT II (red) and doublecortin (DCX, green) immunofluorescence in the dentate gyrus at low magnification. Scale bar = 100 μm. F) High magnification of region in (E) showing that KAT II (arrowheads) and DCX (arrows) are not expressed in the same cells. Scale bars = 10 μm. cc: corpus callosum, GL: granule cell layer; H: hilus; Mol: molecular layer; Py: pyramidal cell layer.
Figure 8
Figure 8
Expression of KAT II immunoreactivity in tanycytes of the 3rd ventricle (3V). A–C: Nickel DAB immunoreactivity (1:300,000 antibody dilution) along rostrocaudal levels (A: −1.8 mm, B: −2.8 mm and C: −4.3 mm from bregma). D–I: Double fluorescent immunohistochemistry of KAT II (red) and GFAP (green) at the levels of the median eminence (ME, −1.8 mm from bregma) showing co-localization of the signals in tanycytes (arrows).
Figure 9
Figure 9
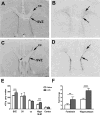
Digital images of Nissl stained coronal sections (A, C) and film autoradiographic images of adjacent sections (B, D) hybridized with 35S labeled riboprobes directed against KAT II mRNA at the level of the subventricular zone (SVZ) in rats in control saline (A, B) or after 6 h of LPS injection (C, D) (2mg/kg). E: Quantification of the mRNA signal in different brain regions by film autoradiography. F: Quantification of KAT II mRNA expression by real time RT-PCR in forebrain and hippocampus. 3V: 3rd ventricle; cc: corpus callosum; Hipp/SLM: stratum lacunosum moleculare of the hippocampus; CPu: caudate putamen; Ctx: cerebral cortex. Data are the mean ± SEM of 6 rats per group. (**): p < 0.01; (***): p < 0.001.

Similar articles

Cited by

References

    1. Alexander KS, Wu HQ, Schwarcz R, Bruno JP. Acute elevations of brain kynurenic acid impair cognitive flexibility: normalization by the alpha7 positive modulator galantamine. Psychopharmacology (Berl) 2012;220:627–37. - PMC - PubMed
    1. Amori L, Guidetti P, Pellicciari R, Kajii Y, Schwarcz R. On the relationship between the two branches of the kynurenine pathway in the rat brain in vivo. J Neurochem. 2009;109:316–25. - PMC - PubMed
    1. Bagasrawala I, Zecevic N, Radonjic NV. N-Methyl D-Aspartate Receptor Antagonist Kynurenic Acid Affects Human Cortical Development. Front Neurosci. 2016;10:435. - PMC - PubMed
    1. Balazs R. Trophic effect of glutamate. Curr Top Med Chem. 2006;6:961–8. - PubMed
    1. Bolborea M, Dale N. Hypothalamic tanycytes: potential roles in the control of feeding and energy balance. Trends Neurosci. 2013;36:91–100. - PMC - PubMed

Publication types

LinkOut - more resources