

Fourier phase based depth-resolved nanoscale nuclear architecture mapping for cancer detection
- PMID: 29127043
- PMCID: PMC5857421
- DOI: 10.1016/j.ymeth.2017.10.011
Fourier phase based depth-resolved nanoscale nuclear architecture mapping for cancer detection
Abstract
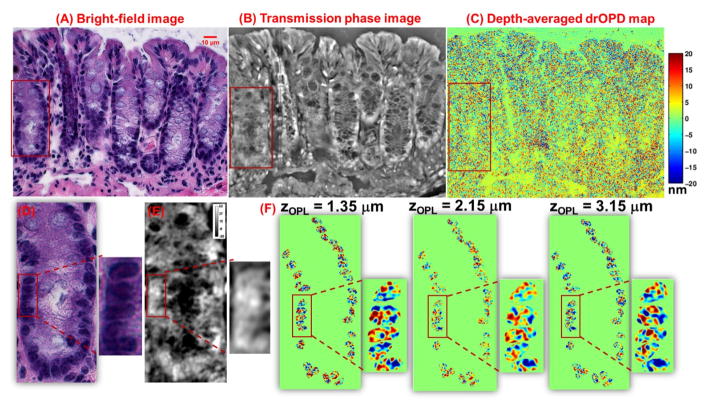
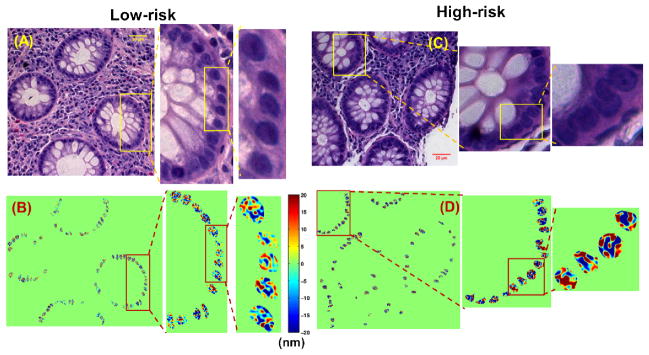
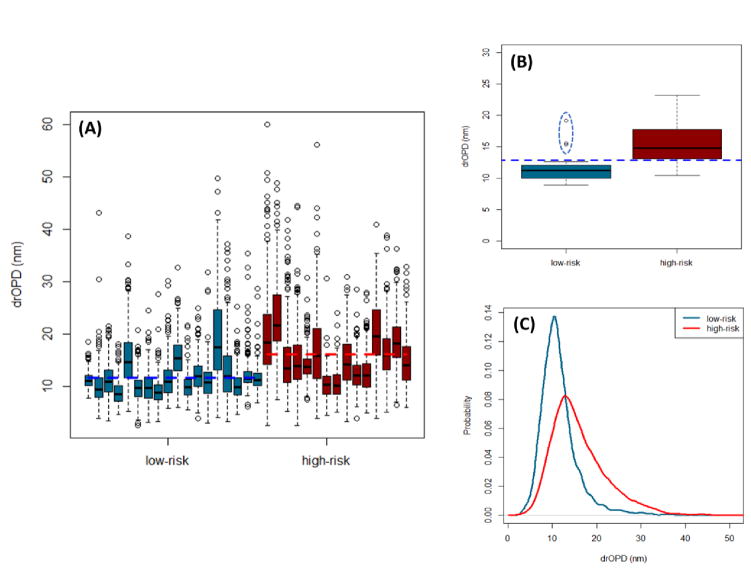
Quantitative phase imaging (QPI) modality has been widely adopted in a variety of applications ranging from identifying photomask defects in lithography to characterizing cell structure and tissue morphology in cancer. Traditional QPI utilizes the electromagnetic phase of transmitted light to measure, with nanometer scale sensitivity, alterations in the optical thickness of a sample of interest. In our work, the QPI paradigm is generalized to study depth-resolved properties of phase objects with slowly varying refractive index without a strong interface by utilizing the Fourier phase associated with Fourier-domain optical coherence tomography (FD-OCT). Specifically, based on computing the Fourier phase of light back-scattered by cell nuclei, we have developed nanoscale nuclear architecture mapping (nanoNAM) method that quantifies, with nanoscale sensitivity, (a) the depth-resolved alterations in mean nuclear optical density, and (b) depth-resolved localized heterogeneity in optical density of the cell nuclei. We have used nanoNAM to detect malignant transformation in colon carcinogenesis, even in tissue that appears histologically normal according to pathologists, thereby showing its potential as a pathology aid in cases where pathology examination remains inconclusive, and for screening patient populations at risk of developing cancer. In this paper, we integrate all aspects of nanoNAM, from principle through instrumentation and analysis, to show that nanoNAM is a promising, low-cost, and label-free method for identifying pathologically indeterminate pre-cancerous and cancerous cells. Importantly, it can seamlessly integrate into the clinical pipeline by utilizing clinically prepared formalin-fixed, paraffin-embedded tissue sections.
Copyright © 2017 Elsevier Inc. All rights reserved.
Figures
Similar articles
-
Early Prediction of Cancer Progression by Depth-Resolved Nanoscale Mapping of Nuclear Architecture from Unstained Tissue Specimens.Cancer Res. 2015 Nov 15;75(22):4718-27. doi: 10.1158/0008-5472.CAN-15-1274. Epub 2015 Sep 17. Cancer Res. 2015. PMID: 26383164 Free PMC article.
-
Fourier phase in Fourier-domain optical coherence tomography.J Opt Soc Am A Opt Image Sci Vis. 2015 Dec 1;32(12):2286-306. doi: 10.1364/JOSAA.32.002286. J Opt Soc Am A Opt Image Sci Vis. 2015. PMID: 26831383 Free PMC article.
-
Fourier optics analysis of phase-mask-based path-length-multiplexed optical coherence tomography.J Opt Soc Am A Opt Image Sci Vis. 2015 Nov 1;32(11):2169-77. doi: 10.1364/JOSAA.32.002169. J Opt Soc Am A Opt Image Sci Vis. 2015. PMID: 26560931
-
Optical coherence tomography.ScientificWorldJournal. 2007 Jan 26;7:87-108. doi: 10.1100/tsw.2007.29. ScientificWorldJournal. 2007. PMID: 17334603 Free PMC article. Review.
-
Quantitative Phase Imaging: Recent Advances and Expanding Potential in Biomedicine.ACS Nano. 2022 Aug 23;16(8):11516-11544. doi: 10.1021/acsnano.1c11507. Epub 2022 Aug 2. ACS Nano. 2022. PMID: 35916417 Free PMC article. Review.
Cited by
-
Recognition of potential therapeutic role of 2-hydroxy-3-methylanthraquinones in the treatment of gallbladder carcinoma: A proteomics analysis.Fundam Clin Pharmacol. 2022 Apr;36(2):350-362. doi: 10.1111/fcp.12740. Epub 2021 Dec 10. Fundam Clin Pharmacol. 2022. PMID: 34850442
-
High-resolution microscopy for imaging cancer pathobiology.Curr Pathobiol Rep. 2019;7(3):85-96. doi: 10.1007/s40139-019-00201-w. Epub 2019 Jul 11. Curr Pathobiol Rep. 2019. PMID: 32953251 Free PMC article.
-
Perspective on quantitative phase imaging to improve precision cancer medicine.J Biomed Opt. 2024 Jun;29(Suppl 2):S22705. doi: 10.1117/1.JBO.29.S2.S22705. Epub 2024 Mar 26. J Biomed Opt. 2024. PMID: 38584967 Free PMC article.
-
Three-Dimensional Nanoscale Nuclear Architecture Mapping of Rectal Biopsies Detects Colorectal Neoplasia in Patients with Inflammatory Bowel Disease.Cancer Prev Res (Phila). 2019 Aug;12(8):527-538. doi: 10.1158/1940-6207.CAPR-19-0024. Epub 2019 Jun 4. Cancer Prev Res (Phila). 2019. PMID: 31164345 Free PMC article.
-
Prediction of neoplastic progression in Barrett's esophagus using nanoscale nuclear architecture mapping: a pilot study.Gastrointest Endosc. 2022 Jun;95(6):1239-1246. doi: 10.1016/j.gie.2022.01.007. Epub 2022 Jan 20. Gastrointest Endosc. 2022. PMID: 35065946 Free PMC article.
References
-
- Mir M, Bhaduri B, Wang R, Zhu R, Popescu G. Quantitative phase imaging. Prog Opt. 2012;57:133. doi: 10.1016/B978-0-44-459422-8.00003-5. - DOI
-
- Shanker A, Waller L, Neureuther AR. Defocus based phase imaging for quantifying electromagnetic edge effects in photomasks. 2014 Technical Report No. UCB/EECS-2014-105.
-
- Popescu G. Quantitative Phase Imaging of Cells and Tissues. McGraw-Hill Education; 2011.
Publication types
MeSH terms
Grants and funding
LinkOut - more resources
Full Text Sources
Other Literature Sources
