. 2018 Feb;24(2):219-236.
doi: 10.1261/rna.064618.117. Epub 2017 Nov 10.

HIV-1 NC-induced stress granule assembly and translation arrest are inhibited by the dsRNA binding protein Staufen1

Affiliations

HIV-1 NC-induced stress granule assembly and translation arrest are inhibited by the dsRNA binding protein Staufen1

Shringar Rao et al. RNA. 2018 Feb.

Abstract

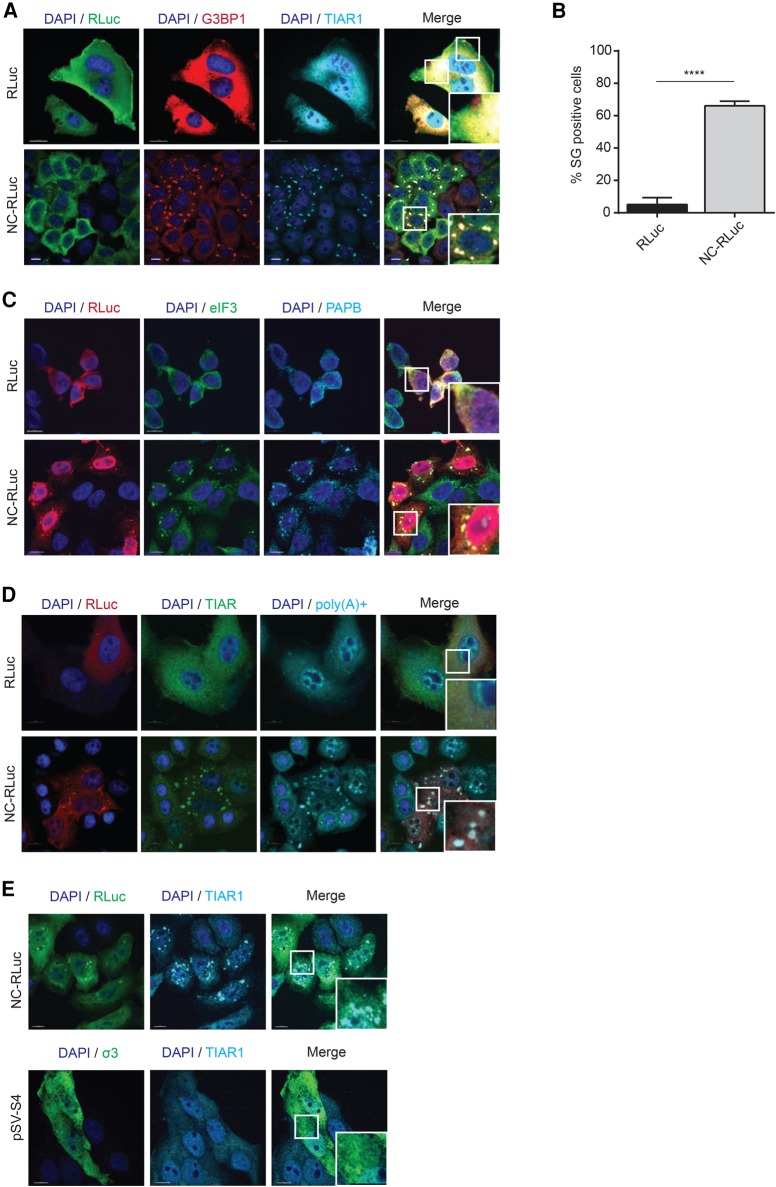
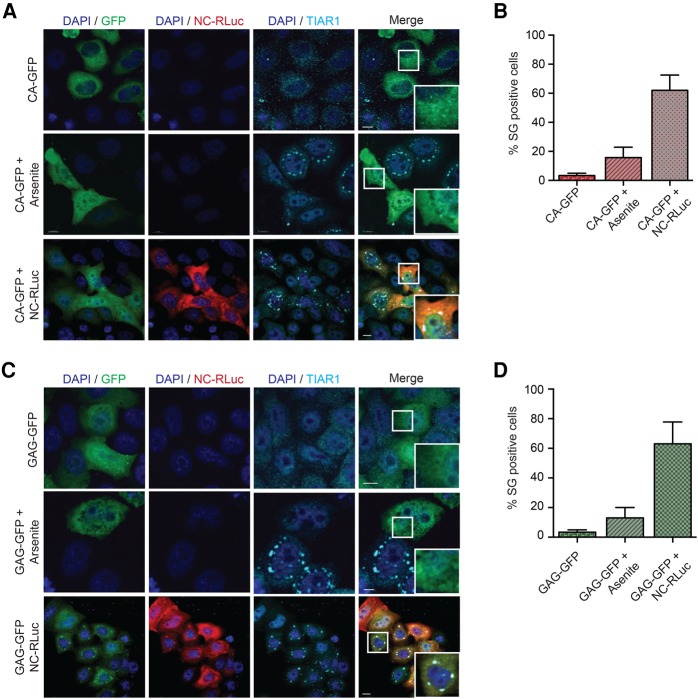
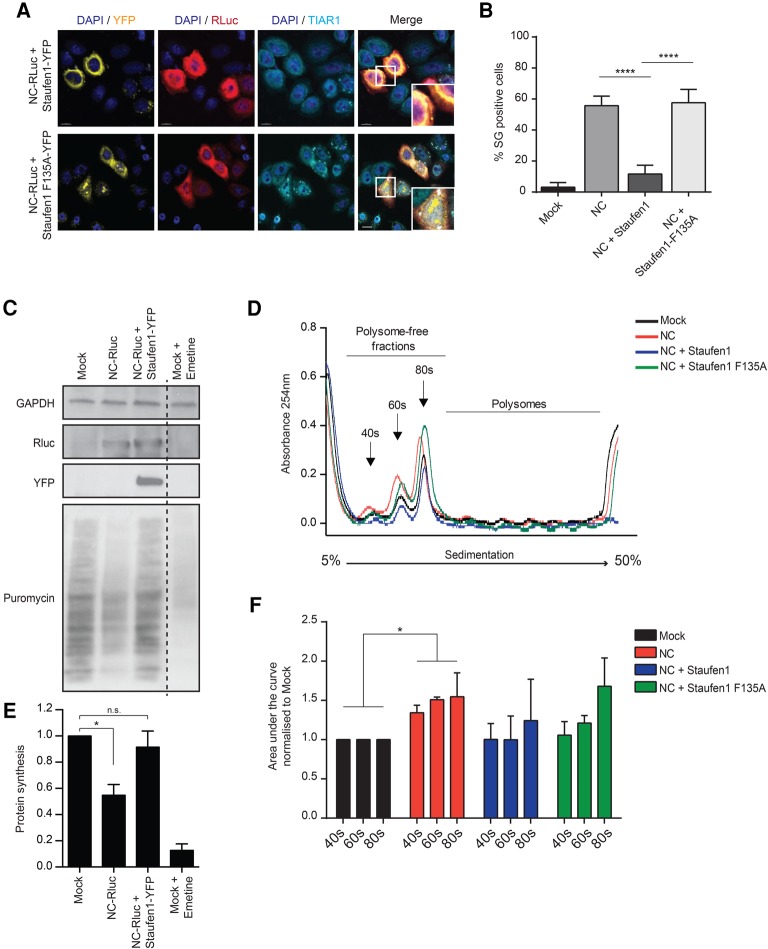
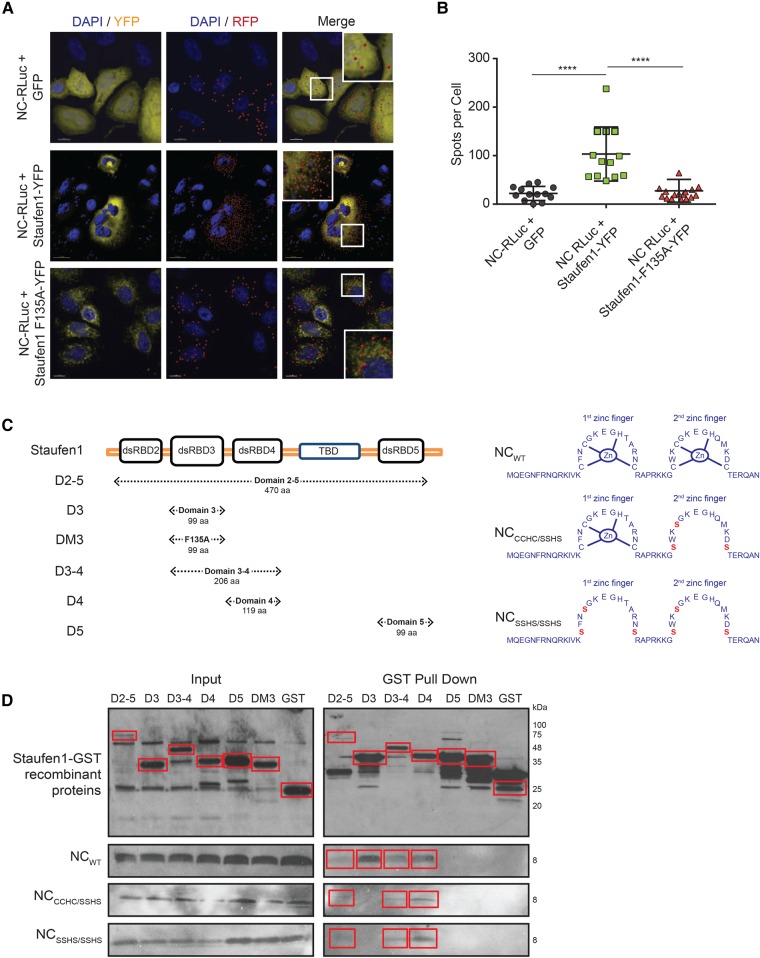
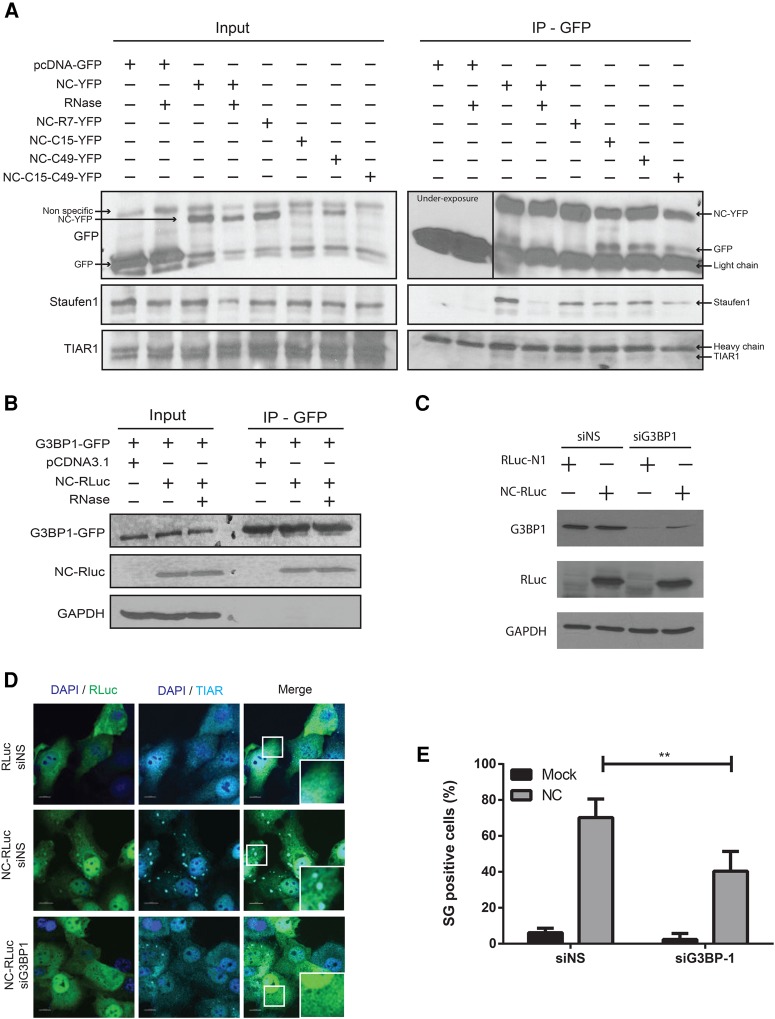
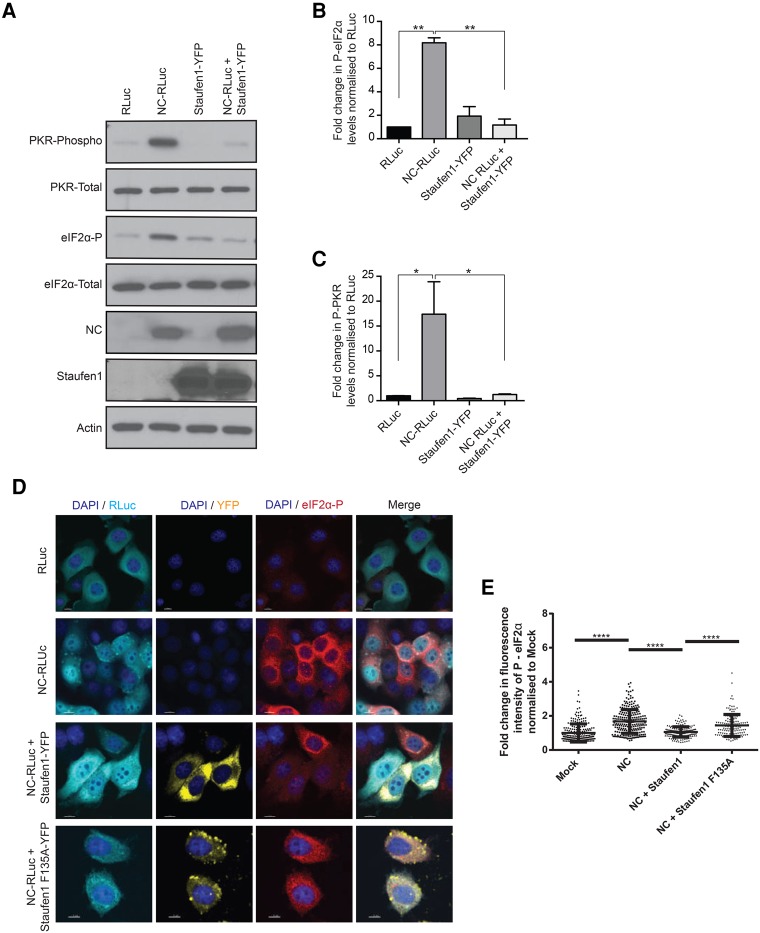
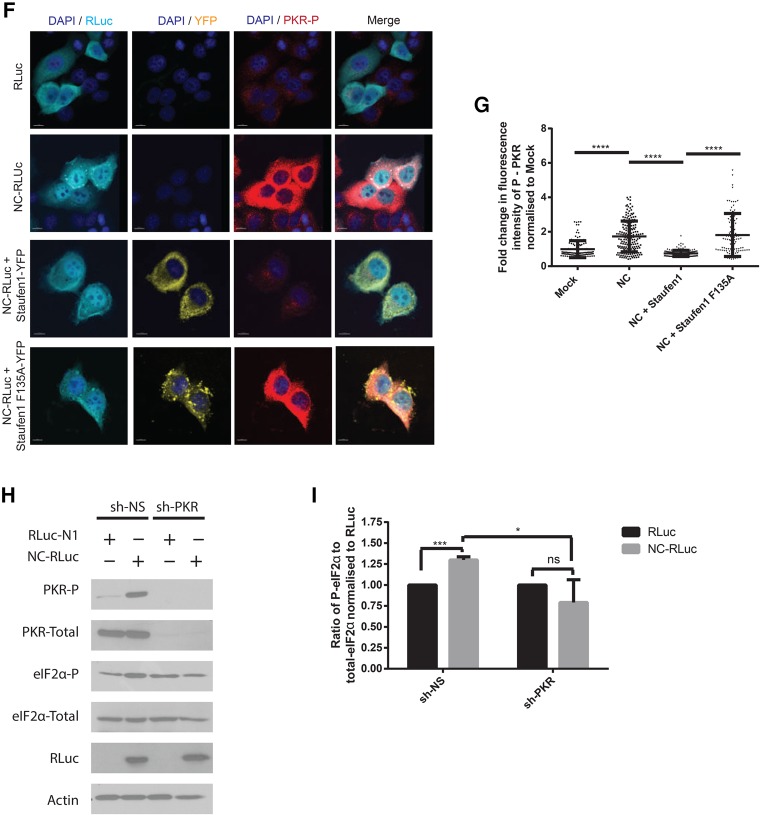
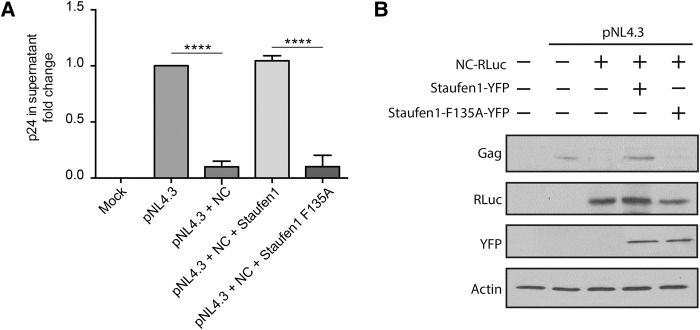
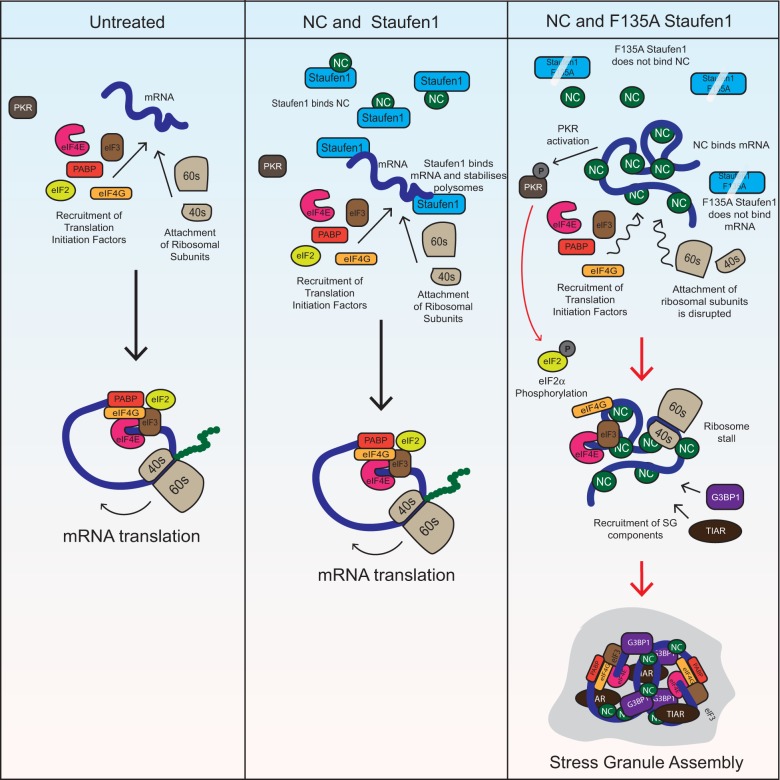
The nucleocapsid (NC) is an N-terminal protein derived from the HIV-1 Gag precursor polyprotein, pr55Gag NC possesses key functions at several pivotal stages of viral replication. For example, an interaction between NC and the host double-stranded RNA-binding protein Staufen1 was shown to regulate several steps in the viral replication cycle, such as Gag multimerization and genomic RNA encapsidation. In this work, we observed that the overexpression of NC leads to the induction of stress granule (SG) assembly. NC-mediated SG assembly was unique as it was resistant to the SG blockade imposed by the HIV-1 capsid (CA), as shown in earlier work. NC also reduced host cell mRNA translation, as judged by a puromycylation assay of de novo synthesized proteins, and this was recapitulated in polysome profile analyses. Virus production was also found to be significantly reduced. Finally, Staufen1 expression completely rescued the blockade to NC-mediated SG assembly, global mRNA translation as well as virus production. NC expression also resulted in the phosphorylation of protein kinase R (PKR) and eIF2α, and this was inhibited with Staufen1 coexpression. This work sheds light on an unexpected function of NC in host cell translation. A comprehensive understanding of the molecular mechanisms by which a fine balance of the HIV-1 structural proteins NC and CA act in concert with host proteins such as Staufen1 to modulate the host stress response will aid in the development of new antiviral therapeutics.

Keywords: HIV-1; Staufen1; mRNA translation; nucleocapsid; stress granules.


Figures

FIGURE 1.
FIGURE 1.
NC expression induces assembly of SG containing G3BP1, TIAR1, PABP, eIF3 and poly(A) mRNAs. (A) HeLa cells were transfected with RLuc or NC-RLuc, and 24 h later were stained for RLuc (green), G3BP1 (red), and TIAR1 (cyan). Scale bars are 10 µm. (B) Quantification of HeLa cells containing SGs transfected with RLuc or NC-RLuc from A. Error bars represent the standard deviation from three independent experiments with at least 150 cells counted per treatment. Asterisks represent statistically significant difference between RLuc and NC-RLuc-expressing cells (Student's t-test; P < 0.001). (C) HeLa cells transfected as in A were stained for RLuc (red), eIF3 (green), and PABP (cyan). Scale bars are 10 µm. (D) HeLa cells transfected as in A were stained for RLuc (green), TIAR (red), and poly(A) mRNAs (cyan). Scale bars are 10 µm. (E) Expression of CCHC-type zinc finger on a dsRNA binding protein does not lead to SG assembly. HeLa cells were transfected with pSV-S4 to express the Reovirus σ3 protein (which contains CCHC-zinc fingers). SG assembly was then monitored by staining the cells for TIAR1 (cyan).
FIGURE 2.
FIGURE 2.
Gag and CA block Arsenite-induced SGs but cannot disrupt NC-induced SGs. (A) HeLa cells were transfected with CA-GFP and CA-GFP + NC-RLuc. Twenty-four hours later, cells were either untreated or treated with Arsenite and stained for RLuc (red) and TIAR1 (cyan). Scale bars are 10 µm. (B) Quantification of HeLa cells containing SGs from A. Only CA and NC expressing cells were considered for the quantification. Error bars represent the standard deviation from three independent experiments. (C) HeLa cells were transfected with GAG-GFP and GAG-GFP + NC-RLuc. Twenty-four hours later, cells were either untreated or treated with Arsenite and stained for RLuc (red) and TIAR1 (cyan). Scale bars are 10 µm. (D) Quantification of HeLa cells containing SGs from C. Only Gag and NC expressing cells were considered for the quantification. Error bars represent the standard deviation from three independent experiments.
FIGURE 3.
FIGURE 3.
Staufen1 rescues NC-induced SG assembly and translation arrest. (A) HeLa cells were cotransfected with NC-RLuc and Staufen1-YFP or Staufen1-F135A-YFP and 24 h later were stained for RLuc (red) and TIAR1 (cyan). Scale bars are 10 µm. (B) Quantification of HeLa cells containing SGs from A. Error bars represent the standard deviation from three independent experiments with at least 150 cells counted per treatment. Asterisks represent statistically significant difference between groups (one-way ANOVA; P < 0.001). (C) Measurements of protein synthesis by puromycylation technique were performed by incubating mock, NC-RLuc, or NC-RLuc + Staufen1-YFP-transfected HeLa cells with medium containing puromycin as described in Materials and Methods. As positive control mock-transfected cells were incubated with 1 µM Emetine 1 h before the puromycin treatment. HeLa extracts were separated by denaturing electrophoresis and analyzed by western blot with antibody to puromycin (12D10). GAPDH immunoblot is shown as a loading control. (D) HeLa cells were mock-transfected or transfected with NC-RLuc, NC-RLuc + Staufen1-YFP, or NC-RLuc + Staufen1-F135A-YFP and 24 h later polysome fractionation and profiling was conducted. (E) Quantification of the puromycin-labeled peptides from C, values were normalized against mock cells extracts. Error bars represent the standard deviation from three independent experiments. Asterisks represent statistically significant difference between groups (one-way ANOVA; P < 0.05) (F) Area under the curve corresponding to 40s, 60s, and 80s peaks from D were quantified using GraphPad Prism 6. Error bars represent the standard deviation from three independent experiments. Asterisks represent statistically significant difference between groups (two-way ANOVA; P < 0.05).
FIGURE 4.
FIGURE 4.
NC and Staufen1 interact in situ and in vitro. (A) HeLa cells were cotransfected with NC-RLuc and GFP or Staufen1-YFP or Staufen1-F135A-YFP and 24 h later were incubated with primary mouse and rabbit antibodies against RLuc and GFP. Coverslips were subsequently incubated with anti-mouse and anti-rabbit PLA probes. Each red signal corresponds to a single interaction event between NC and Staufen1. Nuclei were stained with DAPI (blue). Images shown are representative of >50 cells analyzed from two independent experiments. (B) The graph indicates the number of dots per cell. Asterisks represent statistically significant difference between groups (one-way ANOVA; P < 0.001). (C) Representation of Staufen1 and NC mutants used in GST pull down assays. (D) GST-Staufen1 mutants were incubated with GST SpinTrap columns in the presence of absence of NC mutants. After washing extensively, the proteins bound to the beads were detected by western blotting using anti-GST and anti-NC antibodies. Blot depicting GST tagged recombinant Staufen1 is a representative blot from three independent experiments using different NC constructs.
FIGURE 5.
FIGURE 5.
NC coimmunoprecipitates with multiple SG markers. (A) HeLa cells were transfected with pEGFP-C1 or different NC-YFP mutants for 24 h. Cell lysates were collected, treated with RNase when indicated and subjected to anti-GFP immunoprecipitation. NC-associated proteins were processed for western blotting and probed for GFP, Staufen1, and TIAR1. Representative blots from three independent experiments are depicted. (B) U2OS cells stably expressing G3BP1-GFP were transfected with pcDNA3.1 or NC-RLuc for 24 h. Cell lysates were collected, treated with RNase when indicated and subjected to anti-GFP immunoprecipitation. G3BP1-associated proteins were processed for western blotting and probed for GFP, RLuc, and GAPDH. Representative blots from three independent experiments are depicted. (C) HeLa cells were transfected as indicated and cell lysates were processed for western blotting and probed for G3BP1, RLuc, and GAPDH. (D) Cells transfected as depicted were stained for RLuc (green) and TIAR1 (cyan). Scale bars are 10 µm. (E) Quantification of HeLa cells containing SGs from D. Error bars represent the standard deviation from three independent experiments with at least 100 cells counted per treatment. Asterisks represent statistically significant difference between groups (two-way ANOVA; P < 0.01).
FIGURE 6.
FIGURE 6.
NC induces PKR activation and eIF2α phosphorylation. (A) HeLa cells were transfected as indicated and 24 h later cell lysates were subjected to SDS-PAGE, immunoblotted, and probed to investigate eIF2α and PKR phosphorylation. (B) Densitometry quantification of P-eIF2α was determined by ImageJ analysis. Values presented in the graph are normalized against the total amount of eIF2α in the cell lysate and represent fold change with the RLuc-transfected cells being arbitrarily set to 1. Error bars represent the standard error of the mean from three independent experiments. Asterisks represent statistically significant difference between groups (one-way ANOVA; P < 0.01). (C) Densitometry quantification of P-PKR was determined by ImageJ analysis. Values presented in the graph are normalized against the total amount of PKR in the cell lysate and represent fold change with the RLuc-transfected cells being arbitrarily set to 1. Error bars represent the standard error of the mean from three independent experiments. Asterisks represent statistically significant difference between groups (one-way ANOVA; P < 0.05) (D) Cells were transfected as indicated and stained for RLuc (cyan) and P-eIF2α (red). Images shown are representative of >150 cells analyzed from three independent experiments. Scale bars represent 10 µm. (E) Quantification of the integrated density of p-eIF2α signal in cells from E from by ImageJ analysis. Each dot represents fluorescence intensity of a cell normalized to the mean fluorescence intensity of the mock transfected condition (arbitrarily set to 1). Error bars represent the standard error of the mean of cells from three independent experiments. Asterisks represent statistically significant difference between groups (one-way ANOVA; P < 0.0001). (F) Cells were transfected as indicated and stained for RLuc (cyan) and P-PKR (red). Images shown are representative of >150 cells analyzed from three independent experiments. Scale bars represent 10 µm. (G) Quantification of the integrated density of p-PKR signal in cells from F from by ImageJ analysis. Each dot represents fluorescence intensity of a cell normalized to the mean fluorescence intensity of the mock transfected condition (arbitrarily set to 1). Error bars represent the standard error of the mean of cells from three independent experiments. Asterisks represent statistically significant difference between groups (one-way ANOVA; P < 0.0001). (H) Cells were transfected as indicated and cell lysates were subjected to SDS-PAGE, immunoblotted, and probed to investigate eIF2α and PKR phosphorylation. (I) Densitometry quantification of P-eIF2α was determined by ImageJ analysis. Values presented in the graph are normalized against the total amount of eIF2α in the cell lysate and represent fold change with the RLuc-transfected cells being arbitrarily set to 1. Error bars represent the standard error of the mean from three independent experiments. Asterisks represent statistically significant difference between groups (one-way ANOVA; [*] P < 0.05, [***] P < 0.001).
FIGURE 6.
FIGURE 6.
NC induces PKR activation and eIF2α phosphorylation. (A) HeLa cells were transfected as indicated and 24 h later cell lysates were subjected to SDS-PAGE, immunoblotted, and probed to investigate eIF2α and PKR phosphorylation. (B) Densitometry quantification of P-eIF2α was determined by ImageJ analysis. Values presented in the graph are normalized against the total amount of eIF2α in the cell lysate and represent fold change with the RLuc-transfected cells being arbitrarily set to 1. Error bars represent the standard error of the mean from three independent experiments. Asterisks represent statistically significant difference between groups (one-way ANOVA; P < 0.01). (C) Densitometry quantification of P-PKR was determined by ImageJ analysis. Values presented in the graph are normalized against the total amount of PKR in the cell lysate and represent fold change with the RLuc-transfected cells being arbitrarily set to 1. Error bars represent the standard error of the mean from three independent experiments. Asterisks represent statistically significant difference between groups (one-way ANOVA; P < 0.05) (D) Cells were transfected as indicated and stained for RLuc (cyan) and P-eIF2α (red). Images shown are representative of >150 cells analyzed from three independent experiments. Scale bars represent 10 µm. (E) Quantification of the integrated density of p-eIF2α signal in cells from E from by ImageJ analysis. Each dot represents fluorescence intensity of a cell normalized to the mean fluorescence intensity of the mock transfected condition (arbitrarily set to 1). Error bars represent the standard error of the mean of cells from three independent experiments. Asterisks represent statistically significant difference between groups (one-way ANOVA; P < 0.0001). (F) Cells were transfected as indicated and stained for RLuc (cyan) and P-PKR (red). Images shown are representative of >150 cells analyzed from three independent experiments. Scale bars represent 10 µm. (G) Quantification of the integrated density of p-PKR signal in cells from F from by ImageJ analysis. Each dot represents fluorescence intensity of a cell normalized to the mean fluorescence intensity of the mock transfected condition (arbitrarily set to 1). Error bars represent the standard error of the mean of cells from three independent experiments. Asterisks represent statistically significant difference between groups (one-way ANOVA; P < 0.0001). (H) Cells were transfected as indicated and cell lysates were subjected to SDS-PAGE, immunoblotted, and probed to investigate eIF2α and PKR phosphorylation. (I) Densitometry quantification of P-eIF2α was determined by ImageJ analysis. Values presented in the graph are normalized against the total amount of eIF2α in the cell lysate and represent fold change with the RLuc-transfected cells being arbitrarily set to 1. Error bars represent the standard error of the mean from three independent experiments. Asterisks represent statistically significant difference between groups (one-way ANOVA; [*] P < 0.05, [***] P < 0.001).
FIGURE 7.
FIGURE 7.
NC-mediated reduction of viral production is rescued by Staufen1. (A) HIV-1 p24 in the supernatant of transfected HeLa cells was quantified via ELISA 48 h after transfection. Asterisks represent statistically significant difference between groups (one-way ANOVA; P < 0.001). (B) Cell lysates were subjected to SDS-PAGE, immunoblotted, and probed to investigate Gag production.
FIGURE 8.
FIGURE 8.
Model of NC-induced SG assembly. Under untreated conditions, host cell translation progresses as normal. When NC is overexpressed, it binds cellular mRNAs, aggregates nucleic acids, and leads to PKR activation. NC also prevents ribosomal translocation, thereby leading to SG assembly. Staufen1 can bind and sequester NC as well as stabilize polysomes and disrupt NC-induced SG assembly; but not if it contains an F135A mutation by virtue of which it loses its ability to bind NC and RNA.

Similar articles

Cited by

References

    1. Abrahamyan L, Chatel-Chaix L, Ajamian L, Milev M, Monette A, Clément JF, Song R, Lehmann M, DesGroseillers L, Laughrea M, et al. 2010. Novel Staufen1 ribonucleoproteins prevent formation of stress granules but favour encapsidation of HIV-1 genomic RNA. J Cell Sci 123: 369–383. - PubMed
    1. Ajamian L, Abrahamyan L, Milev M, Ivanov PV, Kulozik AE, Gehring NH, Mouland AJ. 2008. Unexpected roles for UPF1 in HIV-1 RNA metabolism and translation. RNA 14: 914–927. - PMC - PubMed
    1. Ajamian L, Abel K, Rao S, Vyboh K, Garcia-de-Gracia F, Soto-Rifo R, Kulozik AE, Gehring NH, Mouland AJ. 2015. HIV-1 recruits UPF1 but excludes UPF2 to promote nucleocytoplasmic export of the genomic RNA. Biomolecules 5: 2808–2839. - PMC - PubMed
    1. Anderson P, Kedersha N. 2009. RNA granules: post-transcriptional and epigenetic modulators of gene expression. Nat Rev Mol Cell Biol 10: 430–436. - PubMed
    1. Aulas A, Fay MM, Lyons SM, Achorn CA, Kedersha N, Anderson P, Ivanov P. 2017. Stress-specific differences in assembly and composition of stress granules and related foci. J Cell Sci 130: 927–937. - PMC - PubMed

Publication types

MeSH terms

LinkOut - more resources