. 2017 Nov 10;8(1):1434.
doi: 10.1038/s41467-017-01484-6.

Outflow of cerebrospinal fluid is predominantly through lymphatic vessels and is reduced in aged mice

Affiliations

Outflow of cerebrospinal fluid is predominantly through lymphatic vessels and is reduced in aged mice

Qiaoli Ma et al. Nat Commun. .

Abstract

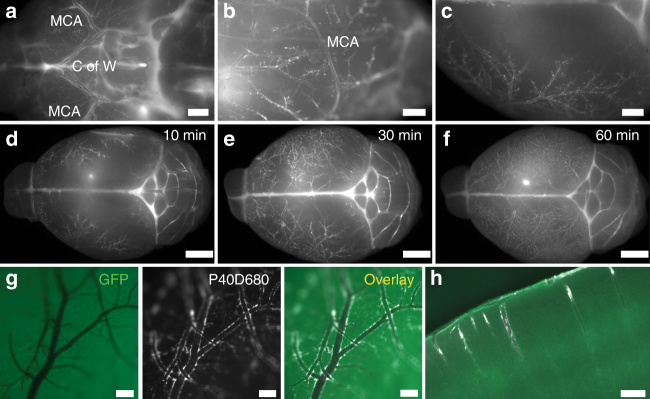
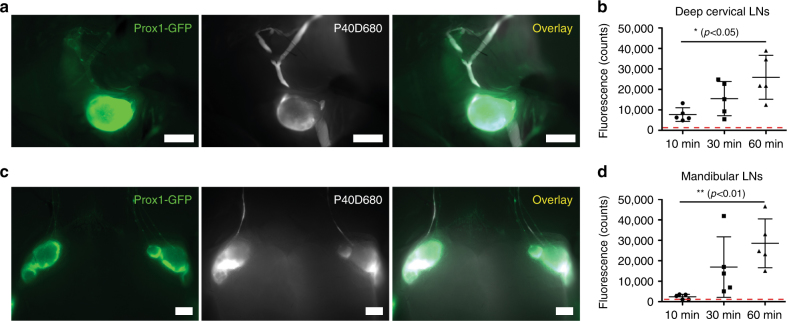
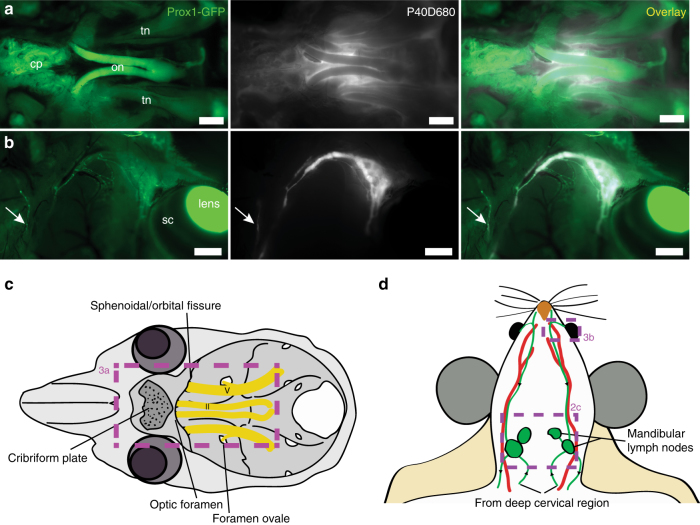
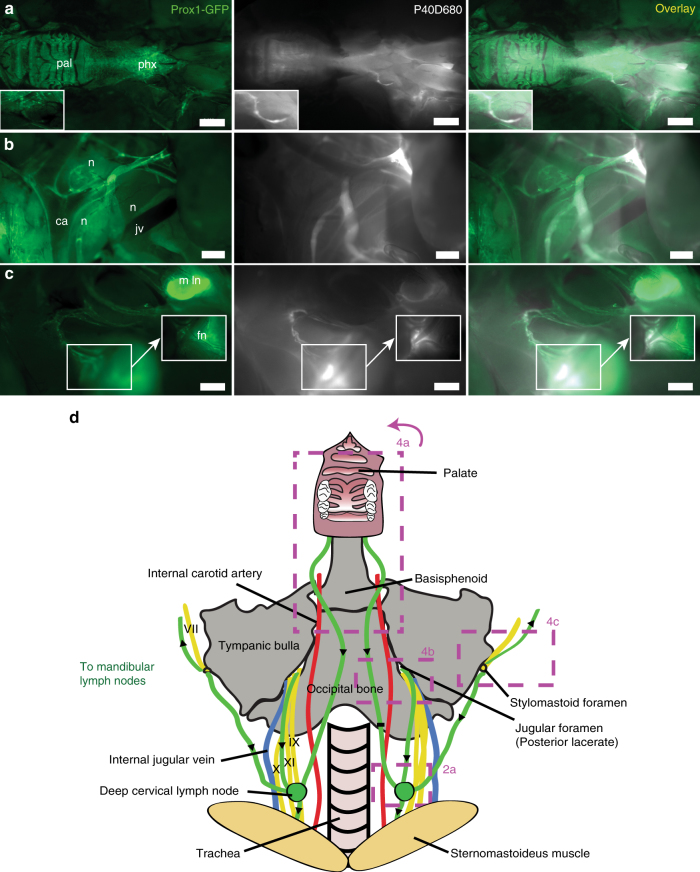
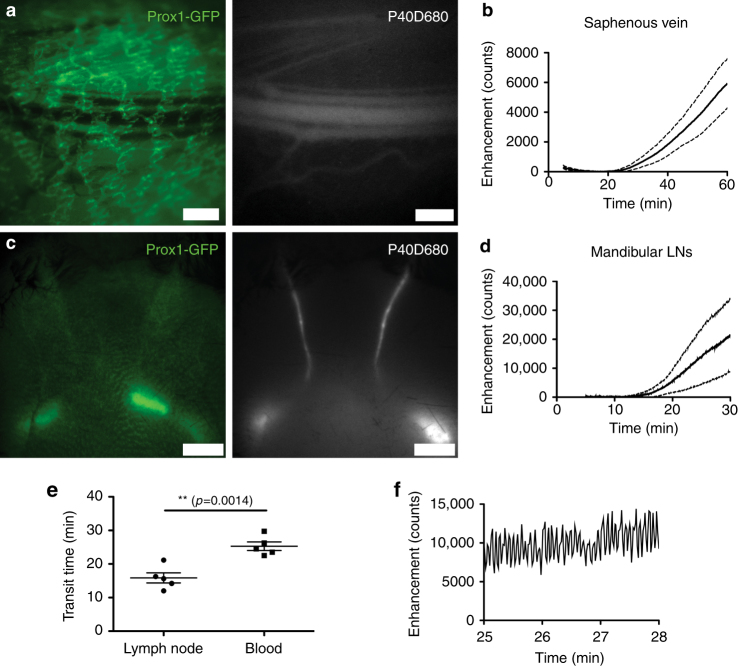
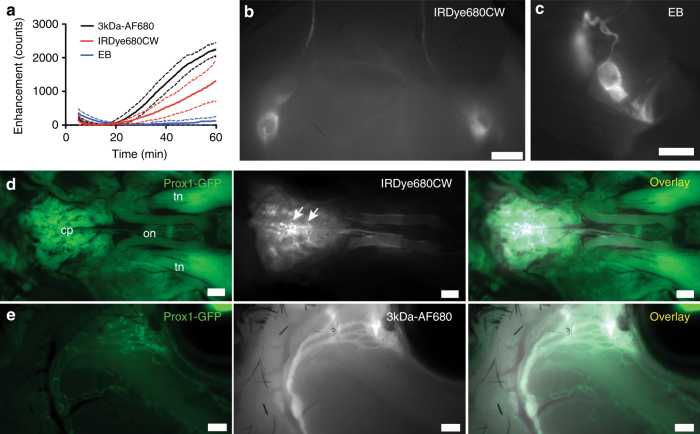
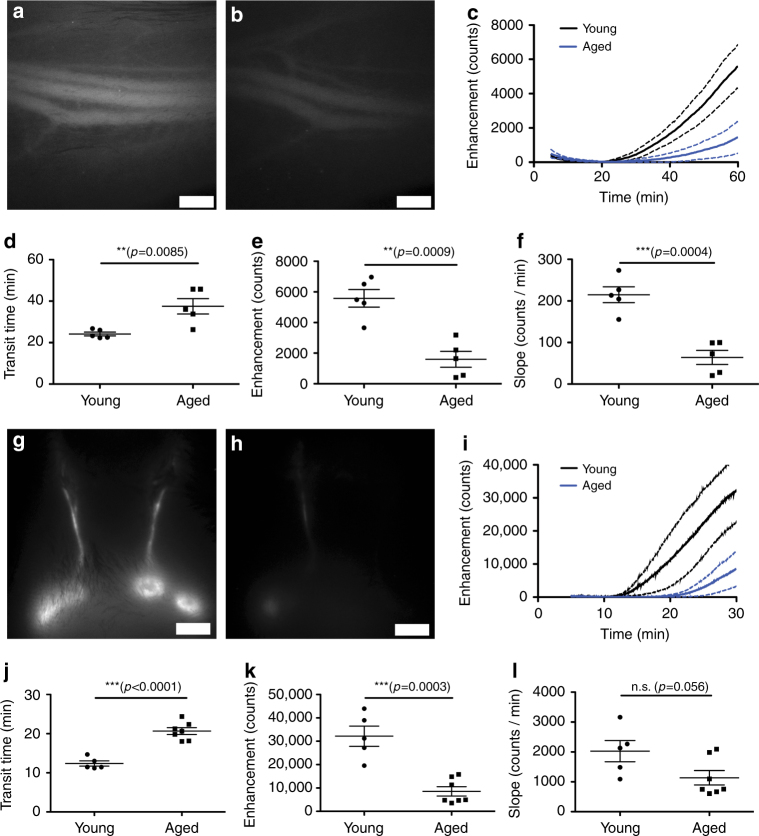
Cerebrospinal fluid (CSF) has been commonly accepted to drain through arachnoid projections from the subarachnoid space to the dural venous sinuses. However, a lymphatic component to CSF outflow has long been known. Here, we utilize lymphatic-reporter mice and high-resolution stereomicroscopy to characterize the anatomical routes and dynamics of outflow of CSF. After infusion into a lateral ventricle, tracers spread into the paravascular spaces of the pia mater and cortex of the brain. Tracers also rapidly reach lymph nodes using perineural routes through foramina in the skull. Using noninvasive imaging techniques that can quantify the transport of tracers to the blood and lymph nodes, we find that lymphatic vessels are the major outflow pathway for both large and small molecular tracers in mice. A significant decline in CSF lymphatic outflow is found in aged compared to young mice, suggesting that the lymphatic system may represent a target for age-associated neurological conditions.


Conflict of interest statement

The authors declare no competing financial interests.

Figures

Fig. 1
Fig. 1
Paravascular localization of P40D680 on the pial surface and in the cortex. ac Images of paravascular P40D680 on the ventral, lateral, and dorsal surfaces of the brain. Mice were euthanized 10 min after the completion of intraventricular infusion of P40D680. Images are representative of n = 5 mice. Scale bars: 1 mm. MCA: middle cerebral artery. C of W: Circle of Willis. df Images of paravascular P40D680 at t = 10 min, 30 min, and 60 min after infusion. Representative of n = 5 mice of each group. Scale bars: 2 mm. g Representative detailed image of the dorsal surface of the brain showing paravascular localization of P40D680 at t = 60 min. GFP label represents autofluorescence channel. Scale bars: 200 µm. h Representative GFP and P40D680 overlay image of penetrating arteries and paravascular localization of P40D680 at t = 60 min. Scale bar: 200 µm
Fig. 2
Fig. 2
Tracer outflow to draining lymph nodes in the neck. a Representative pictures of tracer within the left deep cervical lymph node and afferent and efferent lymphatic vessels at euthanization at 10 min after P40D680 infusion into the right lateral ventricle of a Prox1-GFP mouse. Scale bars: 1 mm. b Quantification of fluorescent signal of deep cervical lymph nodes at t = 10 min, 30 min, and 60 min after infusion. n = 5 mice each time point. Red dashed line indicates baseline values from uninjected mice. Data are the mean ± SD. *p < 0.05 (one-way ANOVA with the Tukey’s multiple comparison). c Representative pictures of tracer within the mandibular lymph nodes and afferent and efferent lymphatic vessels at euthanization at 30 min after P40D680 infusion into the right lateral ventricle of a Prox1-GFP mouse. Scale bar: 1 mm. d Quantification of fluorescent signal of mandibular lymph nodes at t = 10 min, 30 min, and 60 min after infusion. n = 5 mice each time point. Red dashed line indicates baseline values from uninjected mice. Data are the mean ± SD. **p < 0.01 (one-way ANOVA with the Tukey’s multiple comparison)
Fig. 3
Fig. 3
Perineural CSF outflow pathways to mandibular lymph nodes. a Representative image showing the perineural outflow at the base of the skull after removal of the brain. tn: trigeminal nerve, on: optic nerves, cp: cribriform plate. Scale bars: 1 mm. b Representative image showing the lymphatic outflow from the orbit with skin around the eye removed. Prox1-GFP expression is obvious in the lens, Schlemm’s canal (sc), and tracer-filled lymphatic vessels draining the orbit. Arrow indicates a tracer-filled lymphatic from the nasal region. Scale bars: 1 mm. Images are acquired at t = 60 min after infusion and are representative of n = 10 mice. c Scheme of the base of the skull with the optic (II) and trigeminal (V) nerves with associated foramina and the cribriform plate indicated. Box indicates region of image in a. d Scheme outlining the CSF outflow routes to the mandibular lymph nodes. Green: lymphatic vessels with black arrows indicating direction of flow, red: facial arteries. Veins are omitted for clarity. Boxes indicates regions of images in b and in Fig. 2c
Fig. 4
Fig. 4
CSF outflow pathways to deep cervical lymph nodes. a Representative image showing lymphatic outflow from the nasal cavity. Lower jaw, tongue, trachea, and esophagus have been removed. pal: palate, phx: pharynx. Inset shows a tracer-filled collecting lymphatic vessel. Scale bar: 2 mm. b Representative image showing outflow from the jugular foramen on the medial side of the tympanic bulla. n: cranial nerves IX, X, and XI, jv: jugular vein, ca: carotid artery. Scale bar: 500 µm. c Representative image showing the perineural outflow along the facial nerve (fn) from the stylomastoid foramen on the lateral side of the tympanic bulla towards a mandibular lymph node (m ln). Scale bar: 1 mm. Images are acquired at t = 60 min after infusion and are representative of n = 10 mice. d Scheme demonstrating the outflow routes in the deep cervical region. Green: lymphatic vessels with black arrows indicating direction of flow, yellow: cranial nerves, red: arteries, blue: veins. Boxes indicates regions of images in ac and in Fig. 2a
Fig. 5
Fig. 5
Dynamics of CSF outflow to systemic blood and mandibular lymph nodes. a Representative GFP and P40D680 images of the saphenous vein region in a Prox1-GFP mouse 60 min after lateral ventricle infusion of P40D680. Prox1-GFP+ dermal lymphatic vessels can be observed overlying the saphenous bundle of blood vessels. Scale bars: 500 µm. b Saphenous vein signal enhancement plot of n = 5 mice showing delayed tracer transport to systemic blood after lateral ventricle infusion of P40D680. The slight loss of signal at 5–10 min is due to photobleaching of endogenous autofluorescence (solid line: mean value, dashed line: SD). c Representative GFP and P40D680 images of the superficial aspect of cervical region (region shown in Fig. 3d) in a Prox1-GFP mouse 30 min after lateral ventricle infusion of P40D680. Prox1-GFP+ mandibular lymph nodes can be observed through the skin and a subset of these nodes are filled with P40D680. Scale bars: 2 mm. d Signal enhancement plot of mandibular lymph nodes (LNs) in n = 5 mice (solid line: mean value, dashed line: SD). e Quantification of transit time of P40D680 tracer to mandibular lymph nodes and systemic blood after intraventricular infusions (n = 5 each). **p < 0.01 (two-tailed Student’s t-test). Data are mean ± SD. f Representative plot of signal enhancement in afferent collecting lymphatic vessels of the mandibular lymph nodes at a time point of 25–28 min after infusion showing a contractile pattern
Fig. 6
Fig. 6
CSF outflow after intraventricular infusions of small molecular tracers. a Saphenous vein signal enhancement plots of Prox1-GFP mice after lateral ventricle infusions of 0.6% EB, 200 μM IRDye680CW, or 1.6 mg/mL 3kDa-AF680 (n = 4 each; solid line: mean value, dashed line: SD). The loss of signal from 5 to 15 min is due to photobleaching of endogenous autofluorescence. b Representative image of mandibular lymph nodes and afferent collecting vessels 60 min after lateral ventricle infusion of 200 μM IRDye680CW. Similar images were acquired for EB and 3kDa-AF680. Scale bar: 1 mm. c Representative image of the left deep cervical lymph node and collecting vessels 60 min after lateral ventricle infusion of 0.6% Evans blue. Similar images were acquired for IRDye680CW and 3kDa-AF680. Scale bar: 1 mm. d Representative image showing the perineural outflow of IRDye680CW at the base of the skull after removal of the brain. tn trigeminal nerve, on optic nerves, cp cribriform plate. White arrows indicate foramina in the cribriform plate. Scale bars: 500 µm. Similar images were acquired for EB and 3kDa-AF680. e Representative image showing the lymphatic outflow of 3kDa-AF680 from the orbit with skin around the eye removed. Scale bars: 500 µm. Similar images were acquired for EB and IRDye680CW
Fig. 7
Fig. 7
CSF outflow to systemic blood and lymph nodes in young and aged mice. a Representative image of the saphenous vein in a young (2-month-old) mouse 60 min after lateral ventricle infusion of P40D680. b Representative image of the saphenous vein in an aged (18-month-old) mouse at the same time point. Scale bars: 500 µm. c Saphenous vein signal enhancement plots of young and aged mice (n = 5 each). Solid line indicates mean, dashed lines indicate SD. d Quantification of transit time. e Quantification of signal enhancement at 60 min. f Quantification of slopes of the signal enhancement from 45 to 60 min. **p < 0.01, ***p < 0.001 (two-tailed Student’s t-test). Data are mean ± SD. g Representative image of the mandibular lymph node region in a young mouse 30 min after lateral ventricle infusion of P40D680. h Representative image of the mandibular lymph node region in an aged mouse 30 min at the same time point. Scale bars: 2 mm. i Mandibular lymph node enhancement plots of young (n = 5) and aged mice (n = 7). Solid line indicates mean, dashed lines indicate SD. j Quantification of the transit time to the mandibular lymph nodes. k Quantification of average signal enhancement at the lymph nodes at 30 min. l Quantification of the average slopes of the signal enhancement in the lymph nodes during the last 5 min of imaging. **p < 0.01, ***p < 0.001 (two-tailed Student’s t-test). Data are the mean ± SD

References

    1. Davson, H. & Segal, M. B. Physiology of the CSF and Blood-Brain Barriers (CRC, Boca Raton, FL, 1996).
    1. Cserr, H. F. in Hydrocephalus (eds Shapiro, K., Marmarou, A. & Portnoy, H.) 59–68 (Raven, New York, NY, 1984).
    1. Brightman MW, Reese TS. Junctions between intimately apposed cell membranes in the vertebrate brain. J. Cell Biol. 1969;40:648–677. doi: 10.1083/jcb.40.3.648. - DOI - PMC - PubMed
    1. Nabeshima S, Reese TS, Landis DM, Brightman MW. Junctions in the meninges and marginal glia. J. Comp. Neurol. 1975;164:127–169. doi: 10.1002/cne.901640202. - DOI - PubMed
    1. Iliff JJ, et al. A paravascular pathway facilitates CSF flow through the brain parenchyma and the clearance of interstitial solutes, including amyloid beta. Sci. Transl. Med. 2012;4:147ra111. doi: 10.1126/scitranslmed.3003748. - DOI - PMC - PubMed

Publication types

Substances