

Diagnosis of Plasma Cell Dyscrasias and Monitoring of Minimal Residual Disease by Multiparametric Flow Cytometry
- PMID: 29128071
- PMCID: PMC5804349
- DOI: 10.1016/j.cll.2017.08.001
Diagnosis of Plasma Cell Dyscrasias and Monitoring of Minimal Residual Disease by Multiparametric Flow Cytometry
Abstract
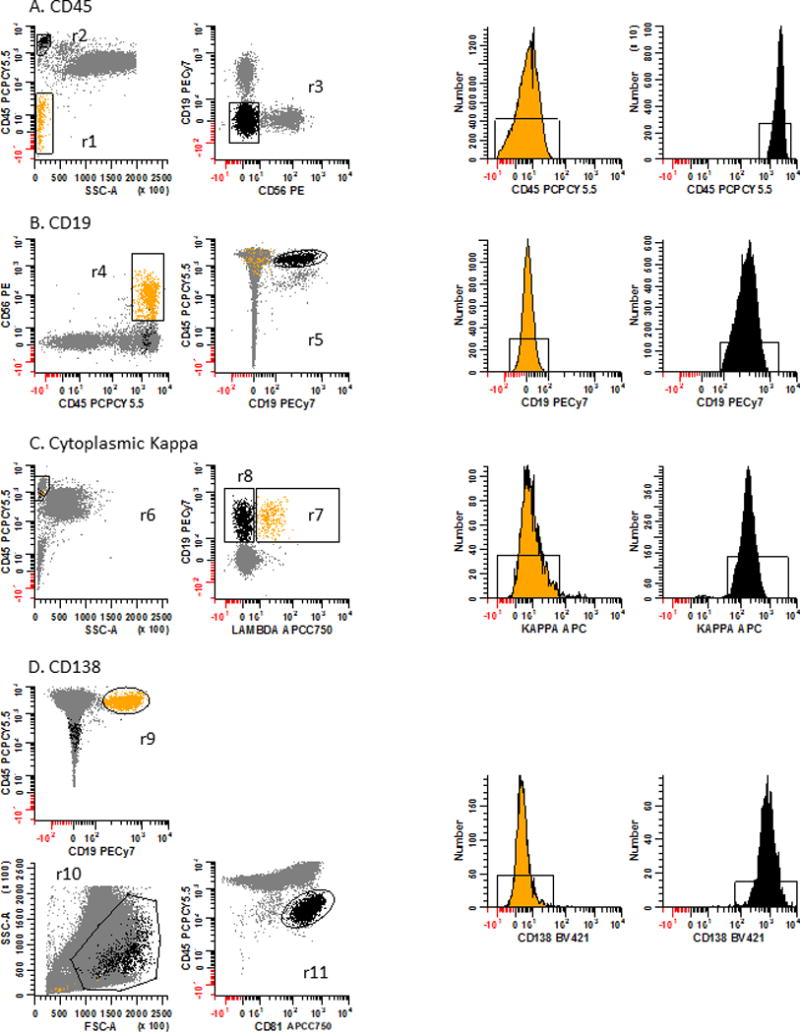
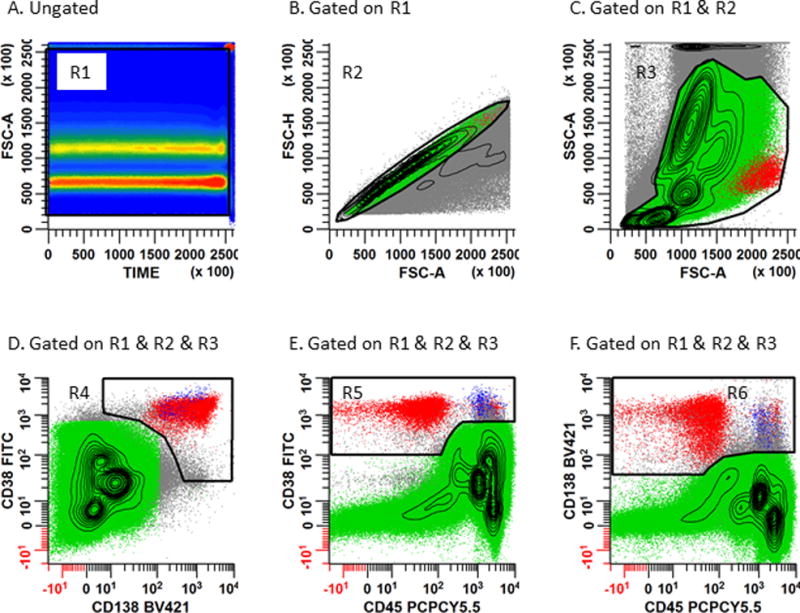
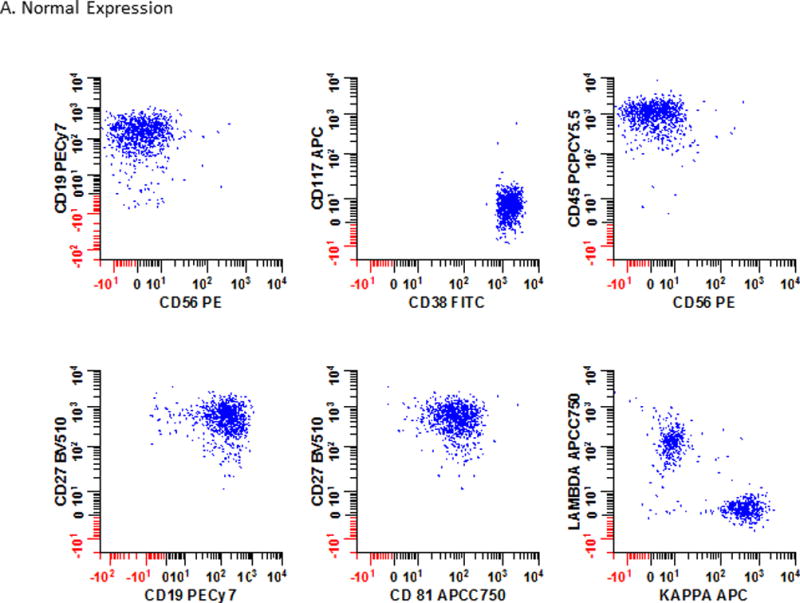
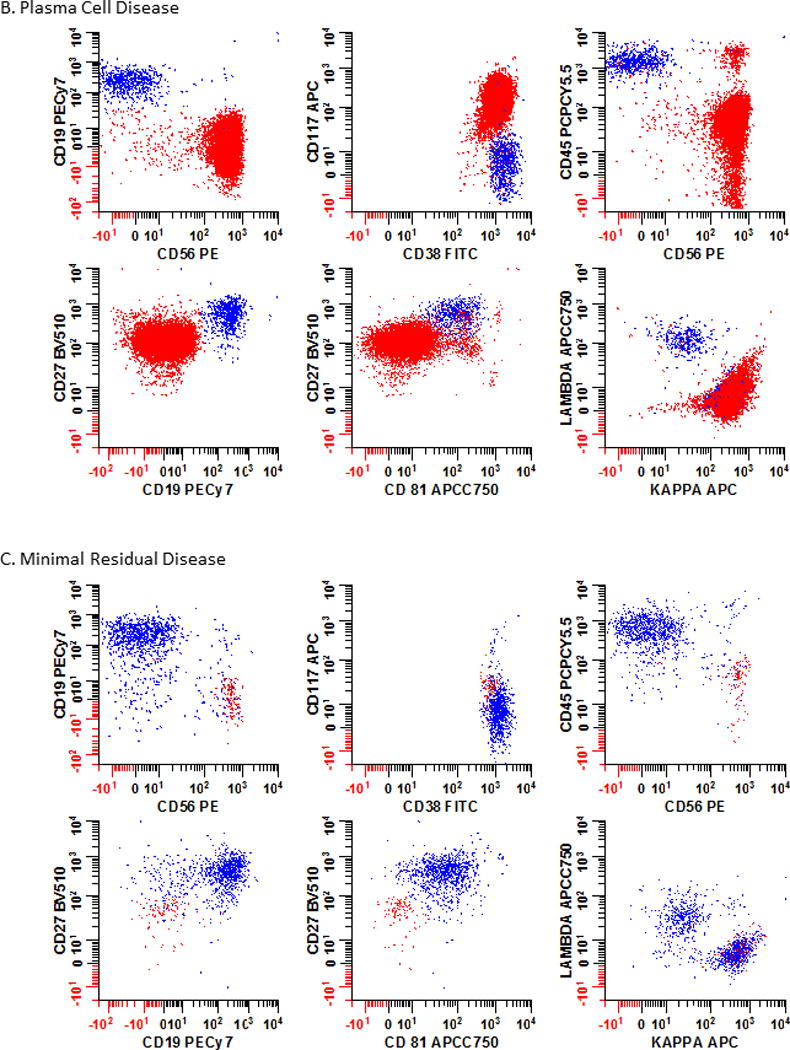
Plasma cell dyscrasia (PCD) is a heterogeneous disease that has seen a tremendous change in outcomes due to improved therapies. Over the past few decades, multiparametric flow cytometry has played an important role in the detection and monitoring of PCDs. Flow cytometry is a high-sensitivity assay for early detection of minimal residual disease (MRD) that correlates well with progression-free survival and overall survival. Before flow cytometry can be effectively implemented in the clinical setting, sample preparation, panel configuration, analysis, and gating strategies must be optimized to ensure accurate results. Current consensus methods and reporting guidelines for MRD testing are discussed.
Keywords: High-sensitivity assay; MRD; Minimal residual disease; Multiparametric flow cytometry; Multiple myeloma; Panel optimization; Plasma cell dyscrasia; Plasma cell neoplasm.
Copyright © 2017 Elsevier Inc. All rights reserved.
Conflict of interest statement
Disclosure Statement:
The authors have no commercial or financial conflicts of interest to disclose.
Figures
Similar articles
-
Evaluation of measurable residual disease in multiple myeloma by multiparametric flow cytometry: Current paradigm, guidelines, and future applications.Int J Lab Hematol. 2021 Jul;43 Suppl 1:43-53. doi: 10.1111/ijlh.13562. Int J Lab Hematol. 2021. PMID: 34288449 Review.
-
Consensus guidelines on plasma cell myeloma minimal residual disease analysis and reporting.Cytometry B Clin Cytom. 2016 Jan;90(1):31-9. doi: 10.1002/cyto.b.21228. Epub 2015 Jun 2. Cytometry B Clin Cytom. 2016. PMID: 25619868
-
Evaluation of multiple myeloma measurable residual disease by high sensitivity flow cytometry: An international harmonized approach for data analysis.Cytometry B Clin Cytom. 2022 Mar;102(2):88-106. doi: 10.1002/cyto.b.22053. Epub 2022 Jan 10. Cytometry B Clin Cytom. 2022. PMID: 35005838 Free PMC article.
-
Minimal Residual Disease Assessment in Multiple Myeloma by Multiparametric Flow Cytometry.Klin Onkol. 2017 Summer;30(Supplementum2):21-28. doi: 10.14735/amko20172S21. Klin Onkol. 2017. PMID: 28903567 Review. English.
-
Utility and feasibility of a six-color multiparametric flow cytometry for measurable residual disease analysis in plasma cell myeloma in resource-limited settings with 5-year survival data.J Cancer Res Ther. 2021 Oct-Dec;17(6):1515-1520. doi: 10.4103/jcrt.JCRT_1027_19. J Cancer Res Ther. 2021. PMID: 34916387
Cited by
-
High-Sensitivity Flow Cytometry for the Reliable Detection of Measurable Residual Disease in Hematological Malignancies in Clinical Laboratories.Diseases. 2024 Dec 22;12(12):338. doi: 10.3390/diseases12120338. Diseases. 2024. PMID: 39727668 Free PMC article.
-
CD319 (SLAMF7) an alternative marker for detecting plasma cells in the presence of daratumumab or elotuzumab.Cytometry B Clin Cytom. 2021 Jul;100(4):497-508. doi: 10.1002/cyto.b.21961. Epub 2020 Oct 5. Cytometry B Clin Cytom. 2021. PMID: 33017079 Free PMC article.
-
Minimal Residual Disease Negativity Does Not Overcome Poor Prognosis in High-Risk Multiple Myeloma: A Single-Center Retrospective Study.Clin Lymphoma Myeloma Leuk. 2020 May;20(5):e221-e238. doi: 10.1016/j.clml.2020.01.001. Epub 2020 Jan 15. Clin Lymphoma Myeloma Leuk. 2020. PMID: 32037287 Free PMC article. Clinical Trial.
-
Hunting down the dominating subclone of cancer stem cells as a potential new therapeutic target in multiple myeloma: An artificial intelligence perspective.World J Stem Cells. 2020 Aug 26;12(8):706-720. doi: 10.4252/wjsc.v12.i8.706. World J Stem Cells. 2020. PMID: 32952853 Free PMC article. Review.
-
Using Artificial Intelligence to Interpret Clinical Flow Cytometry Datasets for Automated Disease Diagnosis and/or Monitoring.Methods Mol Biol. 2024;2779:353-367. doi: 10.1007/978-1-0716-3738-8_16. Methods Mol Biol. 2024. PMID: 38526794
References
-
- Shapiro-Shelef M, Calame K. Plasma cell differentiation and multiple myeloma. Current Opinion in Immunology. 2004;16(2):226–234. - PubMed
-
- Shapiro-Shelef M, Calame K. Regulation of plasma-cell development. Nat Rev Immunol. 2005;5(3):230–242. - PubMed
-
- Nutt SL, Hodgkin PD, Tarlinton DM, Corcoran LM. The generation of antibody-secreting plasma cells. Nat Rev Immunol. 2015;15(3):160–171. - PubMed
-
- Chu VT, Beller A, Nguyen TT, Steinhauser G, Berek C. The long-term survival of plasma cells. Scandinavian journal of immunology. 2011;73(6):508–511. - PubMed
Publication types
MeSH terms
Grants and funding
LinkOut - more resources
Full Text Sources
Other Literature Sources
Miscellaneous
