. 2018 May;138(5):1116-1125.
doi: 10.1016/j.jid.2017.10.028. Epub 2017 Nov 8.

Role of Dysregulated Cytokine Signaling and Bacterial Triggers in the Pathogenesis of Cutaneous T-Cell Lymphoma

Affiliations

Role of Dysregulated Cytokine Signaling and Bacterial Triggers in the Pathogenesis of Cutaneous T-Cell Lymphoma

Melania H Fanok et al. J Invest Dermatol. 2018 May.

Abstract

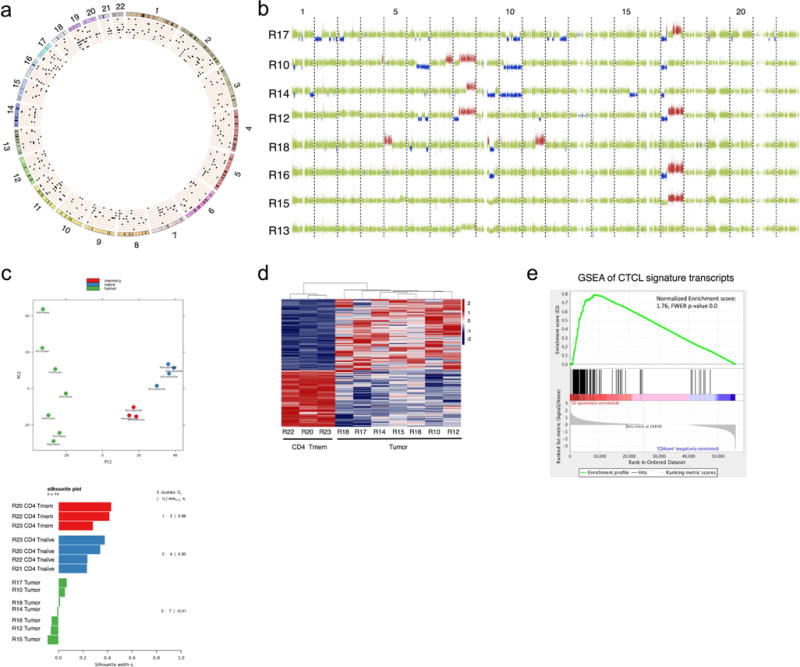
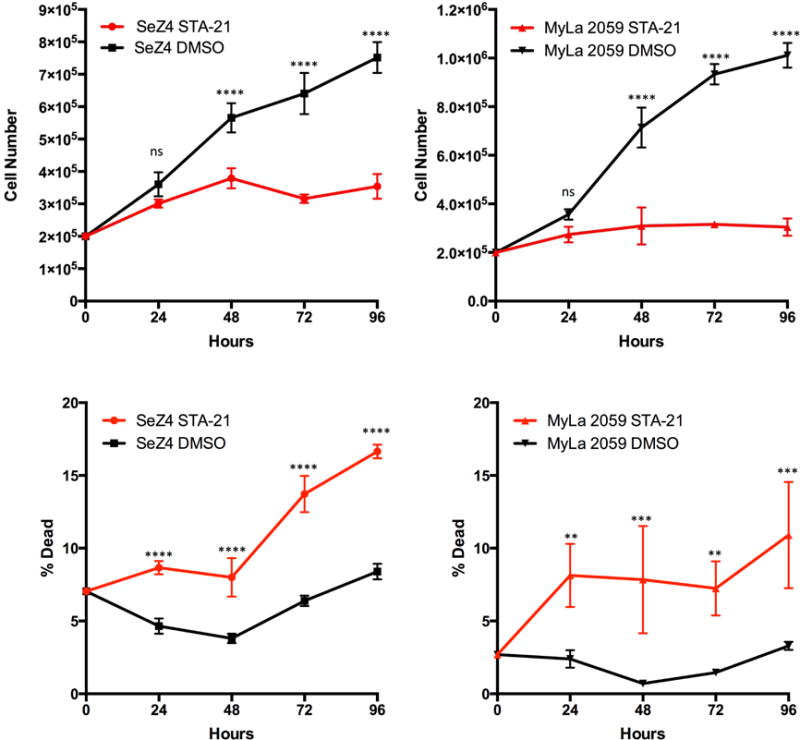
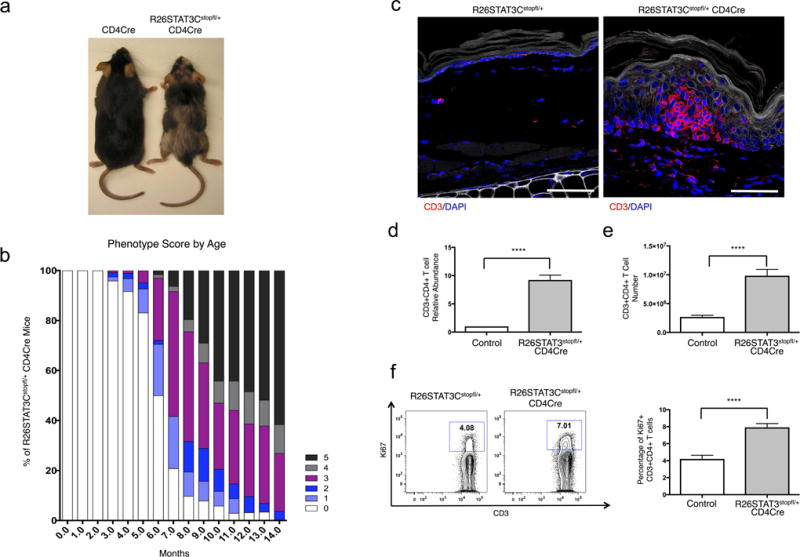
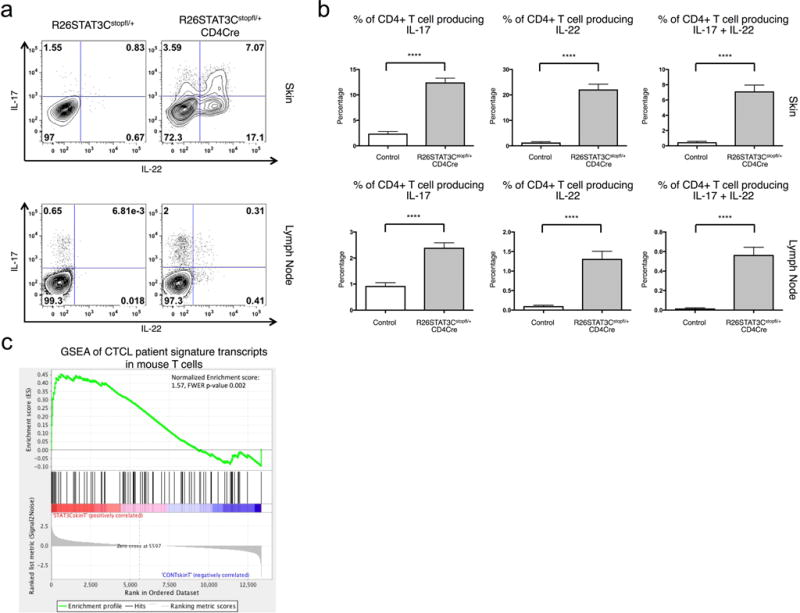
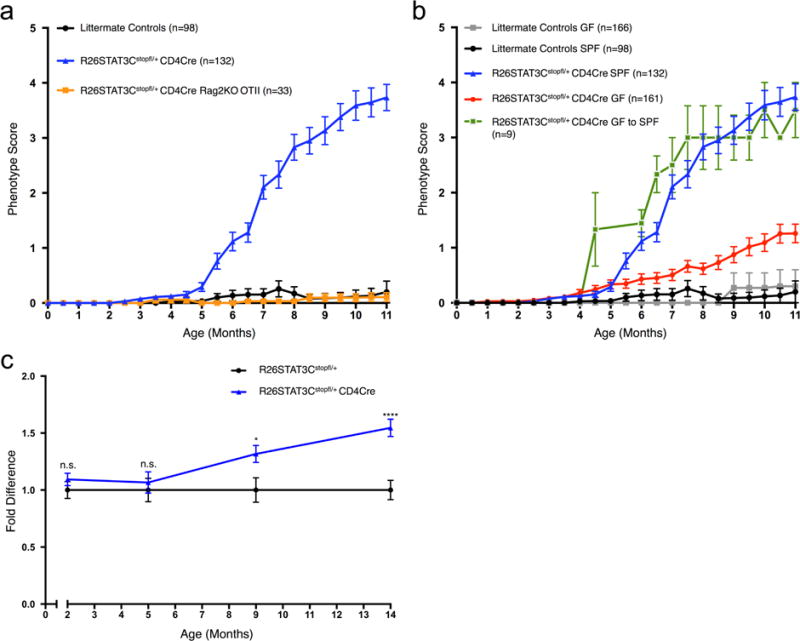
Cutaneous T-cell lymphoma is a heterogeneous group of lymphomas characterized by the accumulation of malignant T cells in the skin. The molecular and cellular etiology of this malignancy remains enigmatic, and what role antigenic stimulation plays in the initiation and/or progression of the disease remains to be elucidated. Deep sequencing of the tumor genome showed a highly heterogeneous landscape of genetic perturbations, and transcriptome analysis of transformed T cells further highlighted the heterogeneity of this disease. Nonetheless, using data harvested from high-throughput transcriptional profiling allowed us to develop a reliable signature of this malignancy. Focusing on a key cytokine signaling pathway previously implicated in cutaneous T-cell lymphoma pathogenesis, JAK/STAT signaling, we used conditional gene targeting to develop a fully penetrant small animal model of this disease that recapitulates many key features of mycosis fungoides, a common variant of cutaneous T-cell lymphoma. Using this mouse model, we show that T-cell receptor engagement is critical for malignant transformation of the T lymphocytes and that progression of the disease is dependent on microbiota.


Conflict of interest statement

CONFLICT OF INTEREST

The authors state no conflict of interest. Dr. Kutok is currently employed at Infinity Pharmaceuticals. His contribution to this work was prior to his employment there, while he was faculty at Brigham and Women’s Hospital.

Figures

Fig. 1
Fig. 1. Genetic landscape of CTCL
(a) Circos plot of SNVs identified by WES. Mutations were identified by comparing the tumor cells with patient’s B cells. Individual chromosomes are marked on the outer ring. Concentric circles represent patient genomes. Black pips indicate deleterious SNVs filtered for coverage >14 reads and predicted deleteriousness score of >0.5 by PolyPhen-2. 8 patient biospecimens are ordered from outside-in by decreasing tumor burden. (b) Copy number gains (red) and losses (blue) detected in SS genomes. Green indicates normal copy number. Each row represents analysis from an individual patient with samples ordered by decreasing tumor burden. (c) PCA plot (top) and silhouette analysis (bottom) of RNAseq data from 7 SS samples, and Tnaïve and Tmemory cells from healthy individuals. (d) Heat map displaying differential gene expression of malignant T cells (tumor) to memory T cells (memCD4), genes displayed have q value ≤ 0.05 (e) GSEA analysis performed on published transcriptome of sorted T cells from SS patients and healthy individuals using our CTCL gene signature.
Fig. 2
Fig. 2. STAT3 regulates cell survival in CTCL
Cultured Sez4 or MyLa cells were treated with 80μM STA-21 or DMSO. Total cell number and percentage of dead cells using trypan blue staining was determined at set time points. n=3 for all conditions. 3 independent experiments with multiple technical duplicates. 2way ANOVA with Sidak’s multiple comparison post-test. ** (p ≤ 0.01), *** (p≤ 0.001), **** (p≤ 0.0001). Values shown as mean ± SEM.
Fig. 3
Fig. 3. R26STAT3Cstopfl/+ CD4Cre mice develop a skin phenotype highly reminiscent of CTCL
(a) Representative image of 6-month-old R26STAT3Cstopfl/+ CD4Cre and littermate control mice. (b) Phenotype progression in R26STAT3Cstopfl/+ CD4Cre mice. Darker shading indicates more severe phenotype. Scale ranges from (0) no phenotype to (5) moribund condition -see methods section for a full description. n = 132 mice. (c) Skin sections from ~10-month-old control and R26STAT3Cstopfl/+ CD4Cre mice, with a cluster of T cells, reminiscent of Pautrier microabscess in the knock-in animal. Scale bar = 50 μm. (d) Fold difference of CD3+CD4+ T cells isolated from skin of R26STAT3Cstopfl/+ CD4Cre and age matched control mice. Mean ± SEM from 30 independent experiments, n ≥ 32 for each genotype. P value was determined using a Wilcoxon Signed Rank Test. (e) Number of CD3+CD4+ T cells from peripheral lymph nodes of control and R26STAT3Cstopfl/+ CD4Cre mice. Mean ± SEM from 24 independent experiments, n ≥ 29 for each genotype. Significance assessed using the nonparametric two-tailed Mann-Whitney U test (f) (Left) Representative Ki67 staining of CD3+CD4+ T cells from peripheral lymph nodes of control and R26STAT3Cstopfl/+ CD4Cre mice. (Right) Quantification of Ki67+ CD3+CD4+ cells. Data is from 14 independent experiments. n≥16 for each genotype. For figures d–f significance values are as follows: ns (p > 0.05), * (p ≤ 0.05), ** (p ≤ 0.01), *** (p ≤ 0.001) **** (p ≤ 0.0001).
Fig. 4
Fig. 4. Expanded population of Th17 cells in R26STAT3Cstopfl/+ CD4Cre mice have a distinct CTCL transcriptional signature
(a) Representative intracellular flow cytometry analysis of CD3+CD4+ T cells from the skin and peripheral lymph nodes of ~10-month-old R26STAT3Cstopfl/+ CD4Cre and control mice (b) Top: Quantification of cytokine production from CD3+CD4+ T cells isolated from skin R26STAT3Cstopfl/+ CD4Cre and control animals. 23 independent experiments. n≥25 for each genotype. Bottom: Th17 cytokine production in CD4+ T cells from peripheral lymph nodes. ≥25 independent experiments. n≥28 for each genotype. Statistical significance was assessed using the nonparametric two-tailed Mann-Whitney U test. Significance values are as follows: ns (p > 0.05), * (p ≤ 0.05), ** (p ≤ 0.01), *** (p ≤ 0.001) **** (p ≤ 0.0001). Values shown as mean ± SEM (c) GSEA comparing the transcriptional profile of T cells from the skin of R26STAT3Cstopfl/+ CD4Cre mice vs controls using the established human CTCL gene signature.
Fig. 5
Fig. 5. Disease symptoms of R26STAT3Cstopfl/+ CD4Cre mice are ameliorated in TCR limited and germ free settings
(a) Average phenotype score of R26STAT3Cstopfl/+CD4Cre (blue line), R26STAT3Cstopfl/+ CD4Cre Rag2KO OTII (orange line), and control mice (black line). Scale ranges from (0) no phenotype to (5) moribund condition -see methods section for a full description. Results are mean ± SEM (b) Average phenotype score of R26STAT3Cstopfl/+ CD4Cre and control animals housed under Specific Pathogen Free (SPF) or Germ Free (GF) conditions. Results are mean ± SEM (c) Evaluation of pruritus over time normalized to average of control mice at each time point. n=3 per genotype aged <5 months, n= 5 mice for each genotype above 5 months. See methods for details of video monitoring protocol. 2 way ANOVA with Bonferroni post-test. * (p ≤ 0.05), **** (p≤ 0.0001).

Comment in

References

    1. Abrams JT, Lessin S, Ghosh SK, Ju W. A clonal CD4-positive T-cell line established from the blood of a patient with Sézary syndrome. J Invest Dermatol. 1991;96(1):31–7. - PubMed
    1. Adachi T, Kobayashi T, Sugihara E, Yamada T, Ikuta K, Pittaluga S, et al. Hair follicle-derived IL-7 and IL-15 mediate skin-resident memory T cell homeostasis and lymphoma. Nat Med. 2015 Oct;19:1–10. - PMC - PubMed
    1. Ahern K, Gilmore ES, Poligone B. Pruritus in cutaneous T-cell lymphoma: a review. J Am Acad Dermatol. 2012 Oct;67(4):760–8. - PMC - PubMed
    1. Axelrod PI, Lorber B, Vonderheid EC. Infections complicating mycosis fungoides and Sézary syndrome. JAMA. 1992 Mar 11;267(10):1354–8. - PubMed
    1. Bagot M, Echchakir H, Mami-Chouaib F, Delfau-Larue MH, Charue D, Bernheim A, et al. Isolation of tumor-specific cytotoxic CD4+ and CD4+CD8dim+ T-cell clones infiltrating a cutaneous T-cell lymphoma. Blood. 1998 Jun 1;91(11):4331–41. - PubMed

Publication types

MeSH terms