Case Reports
. 2018 Jun;141(6):2234-2248.
doi: 10.1016/j.jaci.2017.08.044. Epub 2017 Nov 8.

Biallelic interferon regulatory factor 8 mutation: A complex immunodeficiency syndrome with dendritic cell deficiency, monocytopenia, and immune dysregulation

Affiliations
Case Reports

Biallelic interferon regulatory factor 8 mutation: A complex immunodeficiency syndrome with dendritic cell deficiency, monocytopenia, and immune dysregulation

Venetia Bigley et al. J Allergy Clin Immunol. 2018 Jun.

Abstract

Background: The homozygous K108E mutation of interferon regulatory factor 8 (IRF8) is reported to cause dendritic cell (DC) and monocyte deficiency. However, more widespread immune dysfunction is predicted from the multiple roles ascribed to IRF8 in immune cell development and function.

Objective: We sought to describe the effect on hematopoiesis and immunity of the compound heterozygous R83C/R291Q mutation of IRF8, which is present in a patient with recurrent viral infection, granuloproliferation, and intracerebral calcification.

Methods: Variant IRF8 alleles were identified by means of exome sequencing, and their function was tested by using reporter assays. The cellular phenotype was studied in detail by using flow cytometry, functional immunologic assay transcriptional profiling, and antigen receptor profiling.

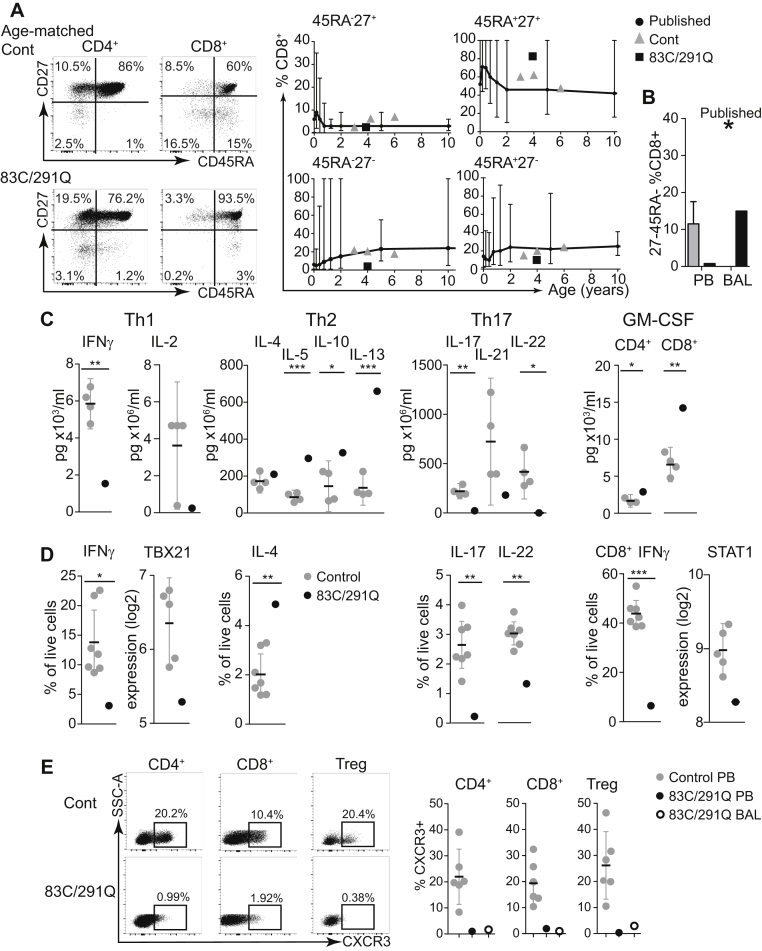
Results: Both mutations affected conserved residues, and R291Q is orthologous to R294, which is mutated in the BXH2 IRF8-deficient mouse. R83C showed reduced nuclear translocation, and neither mutant was able to regulate the Ets/IRF composite element or interferon-stimulated response element, whereas R291Q retained BATF/JUN interactions. DC deficiency and monocytopenia were observed in blood, dermis, and lung lavage fluid. Granulocytes were consistently increased, dysplastic, and hypofunctional. Natural killer cell development and maturation were arrested. TH1, TH17, and CD8+ memory T-cell differentiation was significantly reduced, and T cells did not express CXCR3. B-cell development was impaired, with fewer memory cells, reduced class-switching, and lower frequency and complexity of somatic hypermutation. Cell-specific gene expression was widely disturbed in interferon- and IRF8-regulated transcripts.

Conclusions: This analysis defines the clinical features of human biallelic IRF8 deficiency, revealing a complex immunodeficiency syndrome caused by DC and monocyte deficiency combined with widespread immune dysregulation.

Keywords: Interferon regulatory factor 8; dendritic cell; immunodeficiency; interferon; monocyte; myeloproliferation.


Figures

None
Graphical abstract
Fig 1
Fig 1
Immunodeficiency. A, Clinical course of the patient showing peripheral blood (PB) neutrophil counts (× 109/L) compared with the upper limit of normal. Black dots represent hospital admissions, boxes indicate pathogens isolated, and outlined boxes indicate admission to intensive care for respiratory support and length of stay. PICU, Pediatric intensive care unit. B, Standard noncontrast enhanced computed tomogram showing multifocal bilateral parenchymal calcification (white arrows) involving the subcortical white matter, globus pallidus, internal capsule, and dentate nuclei. C, Whole-blood cytokine production from the patient bearing the IRF8R83C/R291Q mutation (black) compared with a travel control subject (gray). D and E, Antibody reactivity in serum from the patient and 2 age-matched control subjects against a panel of protein targets representing greater than 15,000 human genes (HuProt). Fig 1, D, Anti-immunoglobulin heavy chain (IGH) or light chain (IGK and IGL) reactivity after quantile normalization across the 3 samples. Fig 1, E, Nonimmunoglobulin antigen reactivity present discretely in the patient or control subjects.
Fig 2
Fig 2
Compound heterozygous IRF8 mutations R83C and R291Q. A,IRF8 genotype of the proband (III.1) and family. B, Protein schematic and multiple sequence alignment of IRF8 orthologs. Mutated amino acids and core ISRE binding residues are marked. C, Evaluation of IRF8/cofactor transcriptional potential, as determined by relative luciferase activity of IRF response elements in the absence of IRF8 (None) or transactivated by wild-type IRF8 or the variants R83C and R291Q in the presence of PU.1 and PSMB8 derivative (EICE), SPIB and PSMB8 derivative (EICE), IRF1 and TAPASIN derivative (ISRE), and BATF/JUNB and IL10 derivative (AICE), as indicated. Graphs show results from 3 experiments. Luciferase activity is displayed relative to cells cotransfected with empty vector normalized to 1. Data were analyzed by using an unpaired t test as follows: **P < .01 and ***P < .001. D, Evaluation of IRF8/cofactor complex–forming potential, as determined by using EMSAs with nuclear extracts prepared from HeLa cells transfected with IRF8 WT or the variants R83C and R291Q and mixed with extracts containing PU.1 and PSMB8 derivative (EICE), SPIB and PSMB8 (EICE), IRF1 and TAPASIN (ISRE), BATF/JUNB and IL10 (AICE), as indicated. Arrows indicate IRF8/cofactor complexes. E, Flow cytometric evaluation of intracellular IRF8 protein expression in EBV-transformed B cells from the patient and 2 control subjects. F, IRF8 expression in whole-cell lysates from HeLa cells transfected with the indicated constructs. G, IRF8 and tubulin expression in cytoplasmic (C) and nuclear (N) fractions of HeLa cells transfected with the indicated constructs. Transfected IRF8 was detected by using both anti-IRF8 and anti-HA.
Fig 3
Fig 3
Monocyte and DC deficiency with preservation of macrophages and Langerhans cells (LCs). A, Flow cytometric analysis of PBMCs showing CD15SSClow lymphocytes, CD15SSCmed monocytes, and residual CD15+ granulocytes with morphology confirmed by means of Giemsa staining. Pie charts represent proportions of cells in PBMCs of the patient (83C/291Q mutation) and the mean of control subjects (n = 9). B, Flow cytometric PBMC profiling of the patient and a control subject after staining with anti-CD15 to exclude abundant hypogranular neutrophils with high nonspecific antibody binding. The Lineage (CD3, CD19, CD20, and CD56)HLA-DR+ gate contains CD14+ classical monocytes (gate 1), CD14CD16+ nonclassical monocytes (gate 2), CD123+ pDCs (gate 3), CD34+ progenitors (gate 4), CD141+ cDC1s (gate 5), and CD11c+CD1c+ cDC2s (gate 6). C, Flow cytometric profiling of blood, dermis, and BAL fluid. Absolute counts (BD TruCount) in whole blood are shown. Lymphocytes were gated as CD3+ T cells, CD19+ B cells, and CD3CD56+ NK cells. Bars represent means ± SDs of 18 control subjects. Dermis bars represent means ± ranges of 3 healthy control subjects. BAL bars represent means ± ranges of 4 healthy control subjects. Gran, Granulocytes; Lymph, lymphocytes; Mac, macrophages. D, Enumeration of LCs by means of immunofluorescence microscopy of an epidermal sheet from the patient stained with anti-CD1a, anti–Ki-67, and 4′-6-diamidino-2-phenylindole dihydrochloride (DAPI). Numbers of LCs and Ki-67+ proportions derived from the mean of 6 fields of view (at ×20 or ×40 magnification) for the patient and 13 or 3 healthy control subjects, respectively. Bars represent means ± SDs.
Fig 4
Fig 4
Dysregulated granulopoiesis. A, Flow cytometric analysis of CD34+ progenitors in PBMCs from a control subject and patient (83C/291Q). LineageCD34+ cells contain CD38+CD10+ BNK precursors (gate 1), CD10CD45RA common myeloid progenitor/megakaryocyte-erythroid progenitor (CMP/MEP; gate 2), and CD45RA+ granulocyte-macrophage progenitor (GMP; gate 3). CD38 cells contain CD45RA+ lymphoid-primed multipotent progenitors (LMPP; gate 4), CD45RACD90 multipotent progenitors (MPP; gate 5), and CD90+ hematopoietic stem cells (HSC; gate 6). Numbers represent the percentage of cells in the upstream gate or the percentage of CD34+ cells. B, Serum cytokine analysis with Luminex in a patient with the 83C/291Q mutation (black) compared with 10 control subjects (gray). The graph shows cytokines outside the reference range (z score ≥ 2). +, Cytokine genes with an IRF8 binding site within 20 kb of the transcription start site. C, Cathepsin G (CTSG) expression in neutrophils from a patient with the 83C/291Q mutation and 3 control subjects analyzed by using the NanoString Human Immunology V2 panel (control subjects are in gray and the patient with the 83C/291Q mutation is in black). D, Dihydrorhodamine oxidative burst response of whole-blood neutrophils to PBS, Escherichia coli, and phorbol 12-myristate 13-acetate (PMA). The patient with the 83C/291Q mutation is shown in black. Gray bars indicate means ± SDs of 45 control subjects. MFI, Mean fluorescence intensity. E, Basophils (Baso) identified as LineageHLA-DRCD45lowCD123+ cells. Absolute count (BD TruCount) in whole blood is shown. Bars represent means ± SDs of 18 control subjects. F, Heat map showing differential gene expression of 1.5 log2 or greater from control mean and z score of 2 or greater between the patient with the 83C/291Q mutation and control subjects (n = 3). Open circles, Genes differentially regulated by interferon; solid squares, genes bound by IRF8. Pie charts show gene ontology (GO) terms significantly (P < .01) enriched after hypergeometric testing of differentially regulated transcripts by using the nCounter Human Immunology V2 panel as the gene universe.
Fig 5
Fig 5
Impairment of TH1/TH17 and CD8+ effector memory T-cell differentiation. A, CD4 and CD8 T-cell differentiation defined by expression of CD27 and CD45RA and proportions of each quadrant of CD8+ T cells (outlined gray circle) relative to 3 age-matched control subjects (gray triangles) and published normal ranges (black bars) analyzed as a percentage of total CD8+ T cells. B, Proportion of CD27CD45RACD8+ T cells in the PB of the patient (black column) versus control subjects (gray column) and BAL fluid of the patient (black column) versus published mean of healthy control subjects (star). C, Cytokine secretion into culture medium, as determined by using Luminex technology by purified CD4+ and CD8+ T cells from the patient and 4 healthy control subjects after phorbol 12-myristate 13-acetate (PMA)/ionomycin stimulation. Bars represent means ± 95% CIs. D, Intracellular cytokine production by purified CD4+ and CD8+ T cells from the patient and 4 healthy control subjects after PMA/ionomycin stimulation and selected gene expression analysis in the patient with the 83C/291Q mutation (black) versus 5 age-matched control subjects, as determined by using NanoString nCounter technology (Human Immunology V2 panel). Bars represent means ± 95% CIs. E, Flow cytometric analysis of CXCR3 expression on CD4+, CD8+, and CD4+CD127CD25+ Treg cells from a representative control subject and the patient, with the percentage of CXCR3+ cells indicated. Summary of CXCR3 expression in blood (filled circles) and BAL fluid (open circles) CD4+, CD8+, and CD4+CD127CD25+ Treg cell subsets from the patient with the 83C/291Q mutation versus 6 healthy control subjects (gray circles). Bars represent means ± 95% CIs. *P < .05, **P < .01, and ***P < .001.
Fig 6
Fig 6
Reduced memory B-cell counts with impaired somatic hypermutation. A, Flow cytometric analysis of B-cell phenotype in the patient with 83C/291Q mutations compared with an age-matched control subject. The left column shows populations defined by IgD and CD27: naive (gate 1), nonswitched memory (gate 2), switched memory (gate 3), and CD27 memory (gate4). The right column shows populations defined by CD38 and CD27 to identify transitional (gate 5), naive mature (gate 6), mature activated (gate 7), memory (gate 8), and plasmablastic (gate 9) cells. B, PB B-cell subsets defined by CD27 and IgD expression as a proportion of total B cells from the patient with 83C/291Q mutations (gray outlined dots) and 3 local age-matched control subjects (gray triangles) plotted against an age-specific (18 months to 4 years) normal range.Bars represent means and ranges. C, Serum immunoglobulin isotype levels (IgG, IgA, IgM, and IgE) over time. Horizontal lines represent upper and lower limits of normal. The right plot shows serum levels of IgG subtypes at age 6 months. Gray bars show the reference range. D-H, B-cell receptor (BCR) IgH CDR3 region sequencing of genomic DNA from purified PB B cells (Adaptive Biotechnologies' ImmunoSEQ Assay) from the patient with the 83C/291Q mutations (red), the patient with the K108E mutations (blue), and 3 age-matched control subjects (gray). Fig 6, D, Summary of template generation showing the percentage of productive (Prod), out-of-frame (OoF), or stop templates generated. Mean CDR3 length (nucleotides; Fig 6, E) and mean number of inserted untemplated nucleotides (N1 and N2; Fig 6, F) in out-of-frame and in-frame rearrangements. Fig 6, G, Percentage of templates with 1 or more mutated bases. Fig 6, H, Frequency of mutated bases per in-frame template expressed as the percentage of total mutations. Bars represent means and SDs (Fig 6, E-H). Statistics were calculated by using t tests as follows: *P < .05 and **P < .01.

References

    1. Tamura T., Yanai H., Savitsky D., Taniguchi T. The IRF family transcription factors in immunity and oncogenesis. Annu Rev Immunol. 2008;26:535–584. - PubMed
    1. Glasmacher E., Agrawal S., Chang A.B., Murphy T.L., Zeng W., Vander Lugt B. A genomic regulatory element that directs assembly and function of immune-specific AP-1-IRF complexes. Science. 2012;338:975–980. - PMC - PubMed
    1. Kanno Y., Levi B.Z., Tamura T., Ozato K. Immune cell-specific amplification of interferon signaling by the IRF-4/8-PU.1 complex. J Interferon Cytokine Res. 2005;25:770–779. - PubMed
    1. Langlais D., Barreiro L.B., Gros P. The macrophage IRF8/IRF1 regulome is required for protection against infections and is associated with chronic inflammation. J Exp Med. 2016;213:585–603. - PMC - PubMed
    1. Murphy T.L., Tussiwand R., Murphy K.M. Specificity through cooperation: BATF-IRF interactions control immune-regulatory networks. Nat Rev Immunol. 2013;13:499–509. - PubMed

Publication types

Substances