

Pediatric glioblastoma cells inhibit neurogenesis and promote astrogenesis, phenotypic transformation and migration of human neural progenitor cells within cocultures
- PMID: 29129566
- PMCID: PMC5741502
- DOI: 10.1016/j.yexcr.2017.11.013
Pediatric glioblastoma cells inhibit neurogenesis and promote astrogenesis, phenotypic transformation and migration of human neural progenitor cells within cocultures
Abstract
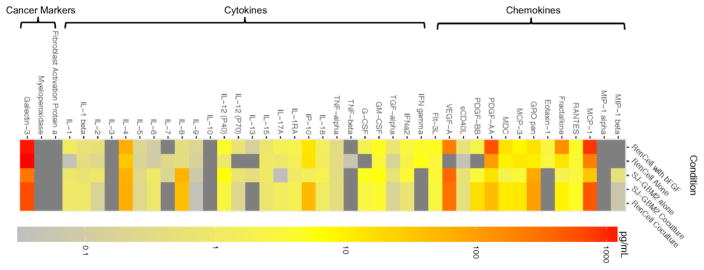
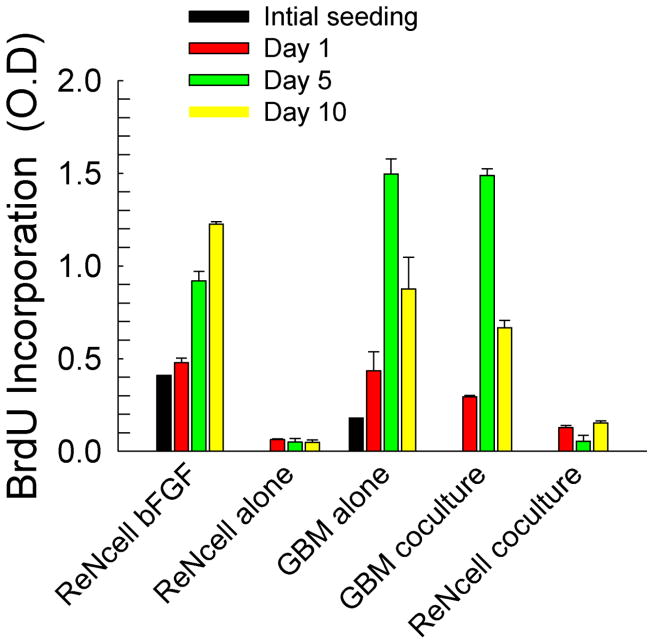
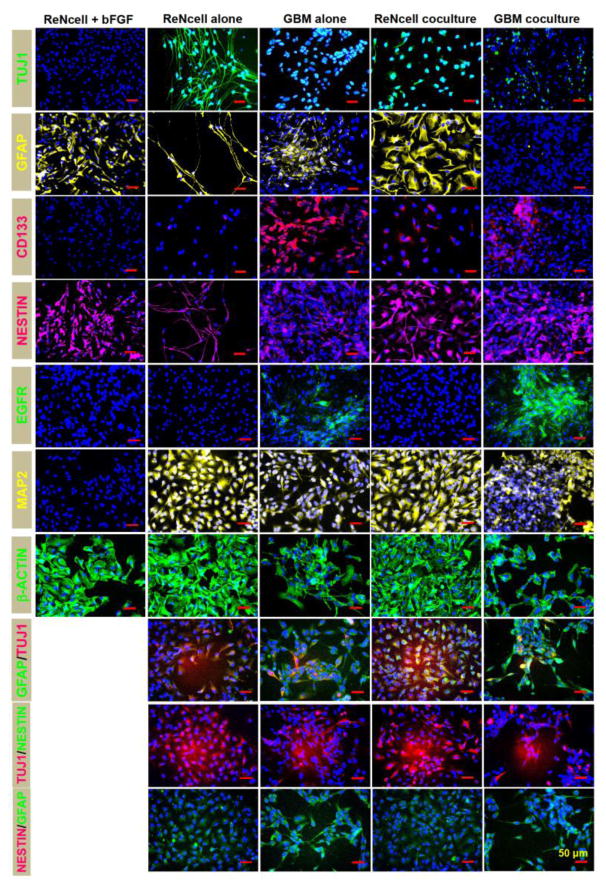
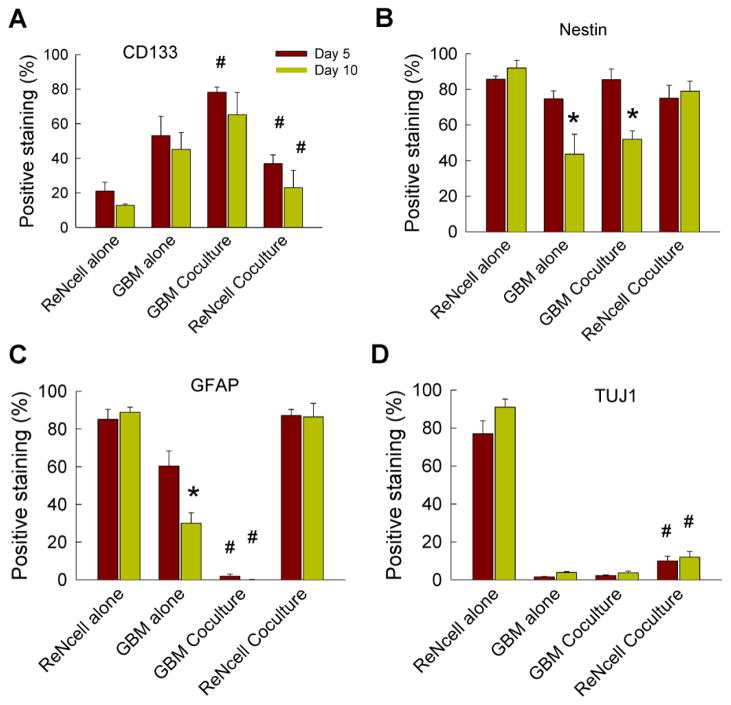
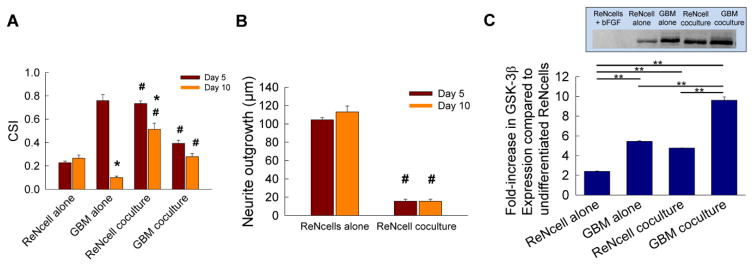
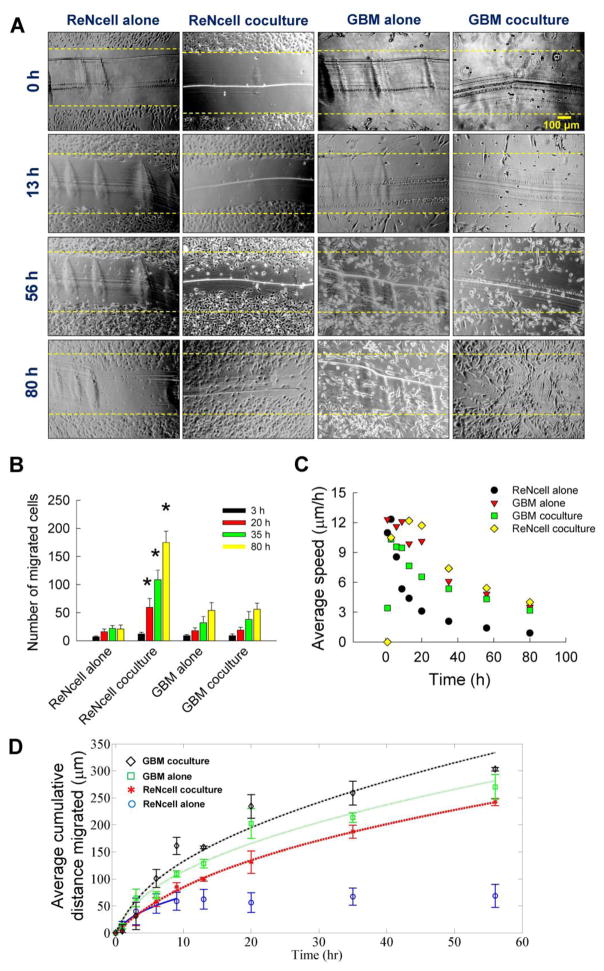
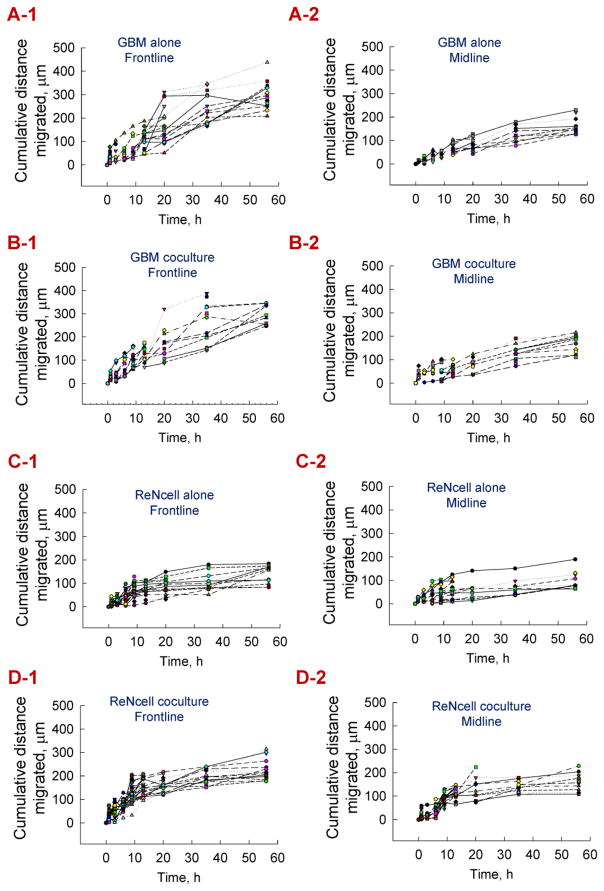
Neural progenitor cell (NPC) fate is influenced by a variety of biological cues elicited from the surrounding microenvironment and recent studies suggest their possible role in pediatric glioblastoma multiforme (GBM) development. Since a few GBM cells also display NPC characteristics, it is not clear whether NPCs transform to tumor cell phenotype leading to the onset of GBM formation, or NPCs migrate to developing tumor sites in response to paracrine signaling from GBM cells. Elucidating the paracrine interactions between GBM cells and NPCs in vivo is challenging due to the inherent complexity of the CNS. Here, we investigated the interactions between human NPCs (ReNcell) and human pediatric GBM-derived cells (SJ-GBM2) using a Transwell® coculture setup to assess the effects of GBM cells on ReNcells (cytokine and chemokine release, viability, phenotype, differentiation, migration). Standalone ReNcell or GBM cultures served as controls. Qualitative and quantitative results from ELISA®, Live/Dead® and BrdU assays, immunofluorescence labeling, western blot analysis, and scratch test suggests that although ReNcell viability remained unaffected in the presence of pediatric GBM cells, their morphology, phenotype, differentiation patterns, neurite outgrowth, migration patterns (average speed, distance, number of cells) and GSK-3β expression were significantly influenced. The cumulative distance migrated by the cells in each condition was fit to Furth's formula, derived formally from Ornstein-Uhlenbeck process. ReNcell differentiation into neural lineage was compromised and astrogenesis promoted within cocultures. Such coculture platform could be extended to identify the specific molecules contributing to the observed phenomena, to investigate whether NPCs could be transplanted to replace lesions of excised tumor sites, and to elucidate the underlying molecular pathways involved in GBM-NPC interactions within the tumor microenvironment.
Keywords: Differentiation; GSK-3β; Migration; Neural progenitor cells; Pediatric glioblastoma cells.
Copyright © 2017 Elsevier Inc. All rights reserved.
Figures
Similar articles
-
GBM secretome induces transient transformation of human neural precursor cells.J Neurooncol. 2012 Sep;109(3):457-66. doi: 10.1007/s11060-012-0917-1. Epub 2012 Jul 1. J Neurooncol. 2012. PMID: 22752853
-
Smac Mimetic-Induced Upregulation of CCL2/MCP-1 Triggers Migration and Invasion of Glioblastoma Cells and Influences the Tumor Microenvironment in a Paracrine Manner.Neoplasia. 2015 Jun;17(6):481-9. doi: 10.1016/j.neo.2015.05.002. Neoplasia. 2015. PMID: 26152356 Free PMC article.
-
Human mesenchymal stem cells exploit the immune response mediating chemokines to impact the phenotype of glioblastoma.Cell Transplant. 2012;21(7):1529-45. doi: 10.3727/096368912X640547. Cell Transplant. 2012. PMID: 22554389
-
Novel concept of the border niche: glioblastoma cells use oligodendrocytes progenitor cells (GAOs) and microglia to acquire stem cell-like features.Brain Tumor Pathol. 2019 Apr;36(2):63-73. doi: 10.1007/s10014-019-00341-2. Epub 2019 Apr 9. Brain Tumor Pathol. 2019. PMID: 30968276 Review.
-
From the vascular microenvironment to neurogenesis.Brain Res Bull. 2011 Jan 15;84(1):1-7. doi: 10.1016/j.brainresbull.2010.09.008. Epub 2010 Sep 17. Brain Res Bull. 2011. PMID: 20850508 Review.
Cited by
-
Extracellular vesicle-mediated amyloid transfer to neural progenitor cells: implications for RAGE and HIV infection.Mol Brain. 2020 Feb 17;13(1):21. doi: 10.1186/s13041-020-0562-0. Mol Brain. 2020. PMID: 32066471 Free PMC article.
-
Pediatric glioblastoma: mechanisms of immune evasion and potential therapeutic opportunities.Cancer Immunol Immunother. 2022 Aug;71(8):1813-1822. doi: 10.1007/s00262-021-03131-y. Epub 2022 Jan 12. Cancer Immunol Immunother. 2022. PMID: 35020009 Free PMC article. Review.
-
A tumorigenicity evaluation platform for cell therapies based on brain organoids.Transl Neurodegener. 2024 Oct 29;13(1):53. doi: 10.1186/s40035-024-00446-5. Transl Neurodegener. 2024. PMID: 39472972 Free PMC article.
-
Advanced Spheroid, Tumouroid and 3D Bioprinted In-Vitro Models of Adult and Paediatric Glioblastoma.Int J Mol Sci. 2021 Mar 15;22(6):2962. doi: 10.3390/ijms22062962. Int J Mol Sci. 2021. PMID: 33803967 Free PMC article. Review.
-
Biomaterials and 3D Bioprinting Strategies to Model Glioblastoma and the Blood-Brain Barrier.Adv Mater. 2021 Feb;33(5):e2004776. doi: 10.1002/adma.202004776. Epub 2020 Dec 16. Adv Mater. 2021. PMID: 33326131 Free PMC article. Review.
References
-
- Sandberg CJ, Altschuler G, Jeong J, et al. Comparison of glioma stem cells to neural stem cells from the adult human brain identifies dysregulated Wnt- signaling and a fingerprint associated with clinical outcome. Exp Cell Res. 2013;319:2230–2243. - PubMed
-
- Galli R, Binda E, Orfanelli U, et al. Isolation and characterization of tumorigenic, stem-like neural precursors from human glioblastoma. Cancer Res. 2004;64:7011–7021. - PubMed
-
- Singh SK, Hawkins C, Clarke ID, et al. Identification of human brain tumour initiating cells. Nature. 2004;432:396–401. - PubMed
Publication types
MeSH terms
Substances
Grants and funding
LinkOut - more resources
Full Text Sources
Other Literature Sources
Medical
